CONTROL LOGIC & STATEFLOW IMPLEMENTATION
AIM :
To implement Control logic using Stateflow as per given sequence
OBJECTIVE :
To implement control logic of a “washing machine”.
To make a Simulink chart for the “Gear shift” logic.
CONTROL LOGIC :
Control logic is the part of a controller that defines how a reactive system responds to events or conditional changes. Applications for control logic include:
- Supervising how to switch between different modes of operation
- Scheduling a sequence of tasks or steps for a system
- Defining fault detection, isolation, and recovery logic
Common tasks for modeling control logic include:
- Modeling hierarchical state machines for large-scale systems
- Adding flow charts to define complex control logic
- Defining orthogonal states to represent systems with parallelism.
STATEFLOW :
Stateflow provides a graphical language that includes state transition diagrams, flow charts, state transition tables, and truth tables. You can use Stateflow to describe how MATLAB algorithms and Simulink models react to input signals, events, and time-based conditions.
Stateflow enables you to design and develop supervisory control, task scheduling, fault management, communication protocols, user interfaces, and hybrid systems.
With Stateflow, you model combinatorial and sequential decision logic that can be simulated as a block within a Simulink model or executed as an object in MATLAB.
Graphical animation enables you to analyze and debug your logic while it is executing. Edit-time and run-time checks ensure design consistency and completeness before implementation.
STUDY 1 : Implement control logic of a “Washing Machine” using Stateflow
Washing Machine :
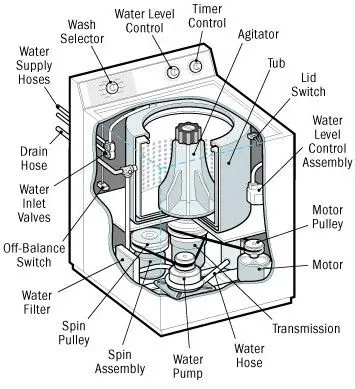
The working principle of a washing machine is centrifugation. Centrifugation is a separation process which uses the action of centrifugal force to promote accelerated settling of particles in a solid-liquid mixture. The washing machine consists of centrifuge for this purpose.
Model :
The Simulation to implement control logic of a “washing machine” was attached below.
The various conditions for the simulation were given as follows,
- If the power supply is available, the system gets activated
- If the Water supply is not available, stop the process & indicate through LED
- Soaking time should be 200s followed by Washing time of 100s.
- Then rinsing happens for next 20s & dryer runs for 50s
- After all the processes have completed turn on the finished LED
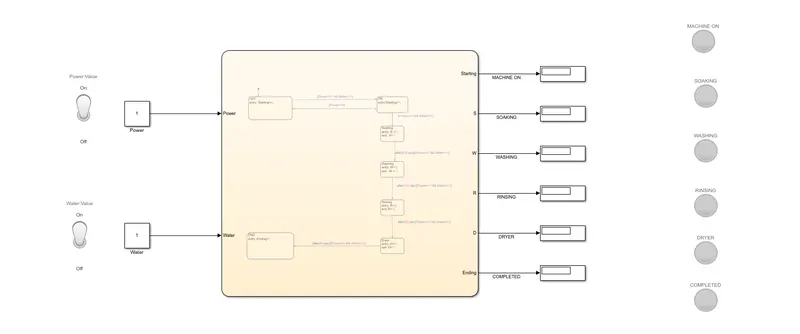
Initially to toggle switches were connected to two constant blockes namely power and water.
These blocks ensure the power and water supply to the washing machine.
A Chart was then created and inside the chart block, the working conditions were specified.
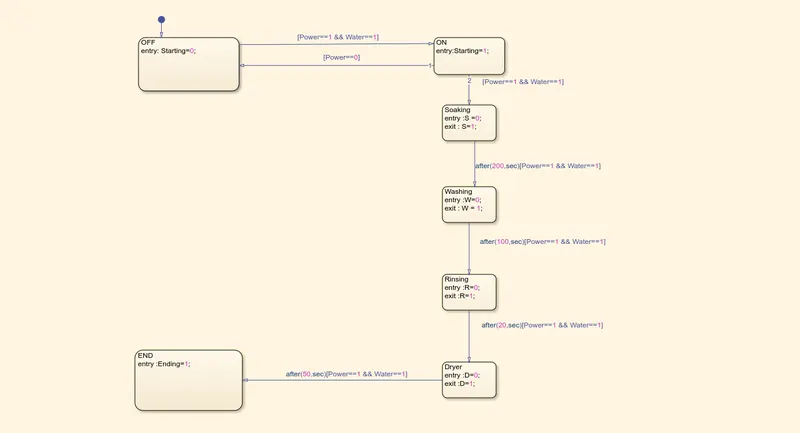
The power and water values were given as inputs to the chart block and if the conditions were satisfied (Power==1 && Water==1),it was directed to the block indicating the starting of the process.
This initial condition was checked during each and every process if any block fails to satisfy this condition, the process will be terminated.
The initial condition was checked again and it was directed to the block indicating the Soaking process.
For the soaking process a delay of 200 s was implemented.
After the end of soaking,it was directed to the Washing block which had a delay of 100 s.
Finally the Drying process was carrried out which had a delay of 50 s.
Thus the total delay was 370 s, which was the time specific to the individual processess.
Symbols pane :
The input and output values and ports were asiigned and operated through the symbols pane.
This symbols pane helps in establishing a contact to the chart from outside of it.
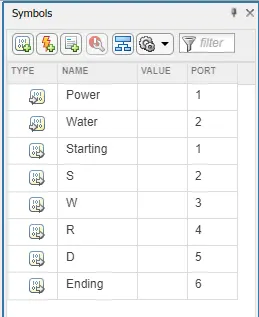
All the blocks resembling a particular process were connected to a lamp outside the chart which indicates the suitable color based on the outcome of the operation.
Output :
The below snapshot shows the simulation with a runtime of 400 s,which was sufficient to complete all the processess.
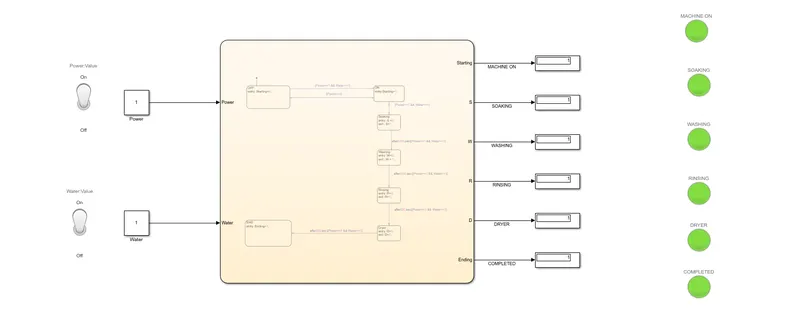
This snapshot shows the simulation for a runtime of 320 s for which the process was completed only till washing.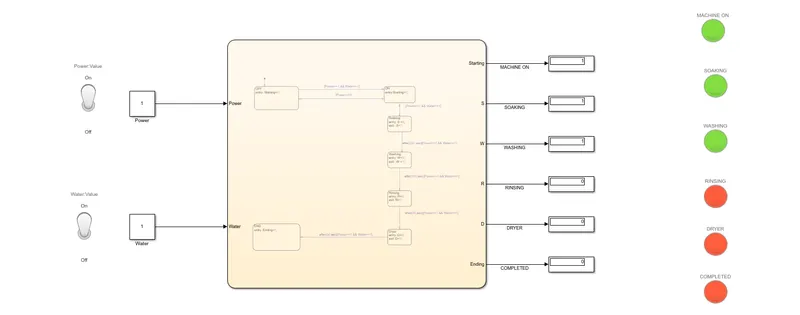
STUDY 2 : Making a Simulink chart for the “Gear shift” logic
Gear Transmission :
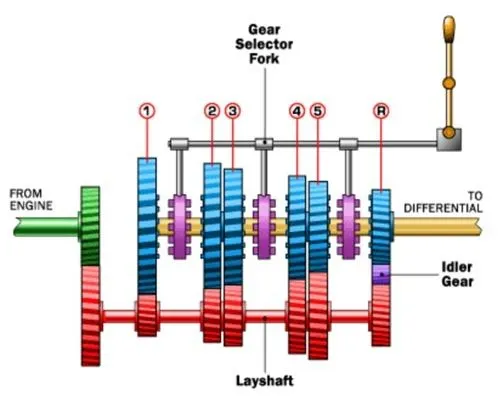
Gears are used for transmitting power from one part of a machine to another. In a bicycle, for example, it's gears (with the help of a chain) that take power from the pedals to the back wheel. Similarly, in a car, gears transmit power from the crankshaft (the rotating axle that takes power from the engine) to the driveshaft running under the car that ultimately powers the wheels.
The most common use is in motor vehicles, where the transmission adapts the output of the Internal combustion engine to the drive wheels. Such engines need to operate at a relatively high rotational speed, which is inappropriate for starting, stopping, and slower travel. The transmission reduces the higher engine speed to the slower wheel speed, increasing torque in the process. Transmissions are also used on pedal bicycles, fixed machines, and where different rotational speeds and torques are adapted.
Model :
The Simulation for “Gear shift” logic through control logic was attached below.
The various conditions for the simulation were given as follows,
Speed Range(kmph) Gear
0 to 15 1
16 to 25 2
26 to 40 3
41 to 60 4
Above 61 5
Give speed input while the simulation is running & display the gear number.
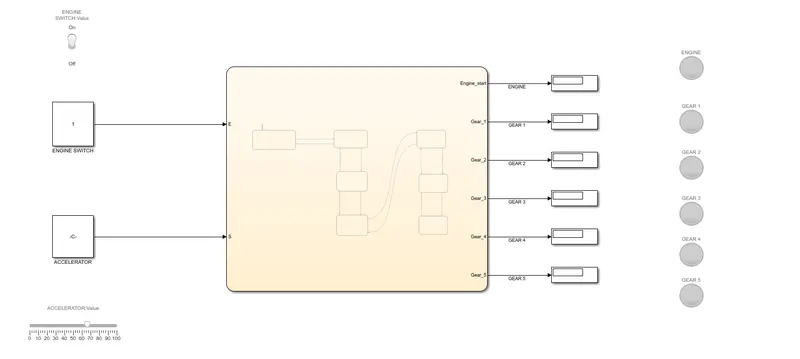
Initially two constant blocks were implemented for the purpose of providing the inputs to the chart.
One block was connected to a toggle switch which acts as the Engine switch and the other block was connected to a slider which acts as an accelerator, controlling the speed.
A Chart was then created and inside the chart block, the working conditions were specified.
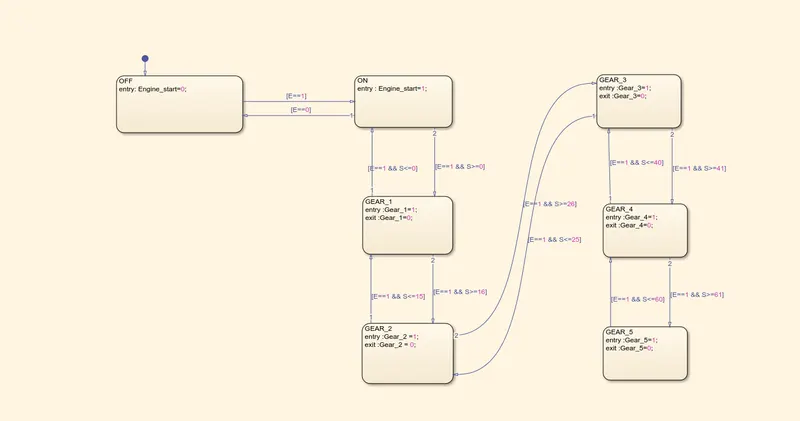
The E (Engine switch) and S (speed) values were given as inputs to the chart block and for the process to run,the engine switch must be in switched ON always which was given as the condition E==1.
This initial condition had to be satisfied while each process was ran.
Further there were 5 blocks representing 5 gears, each having a condition involving the speed.
The block representing Gear 1 was selected if the speed value was between 0-15 , if the conditon is true it signals to the output else it moves to the next or previous block based on the condition.
The next block representing Gear 2 was selected if the speed value was between16-25.
The next block representing Gear 3 was selected if the speed value was between 26-40.
The next block representing Gear 4 was selected if the speed value was between 41-60.
The next block representing Gear 5 was selected if the speed value was above 61.
No delays were incorporated in the simulation.
Symbols pane :
The input and output values and ports were asiigned and operated through the symbols pane.
This symbols pane helps in establishing a contact to the chart from outside of it.
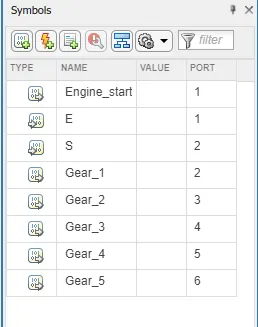
All the blocks resembling a particular process were connected to a lamp outside the chart.
The lamps representing the respective gears were ignited during the simulation based on the speed values.
Output :
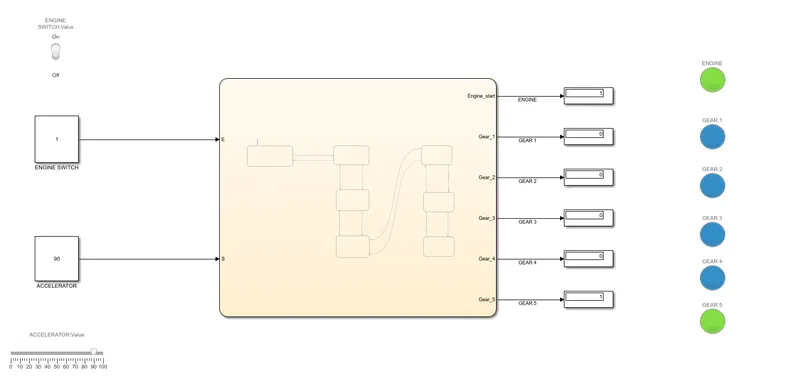
The Simulation was made to run infinitely and the slider was used to vary the speed.
The below snapshot shows the outcome for a speed of 27, which indicates that the vechicle must be running in GEAR 3. 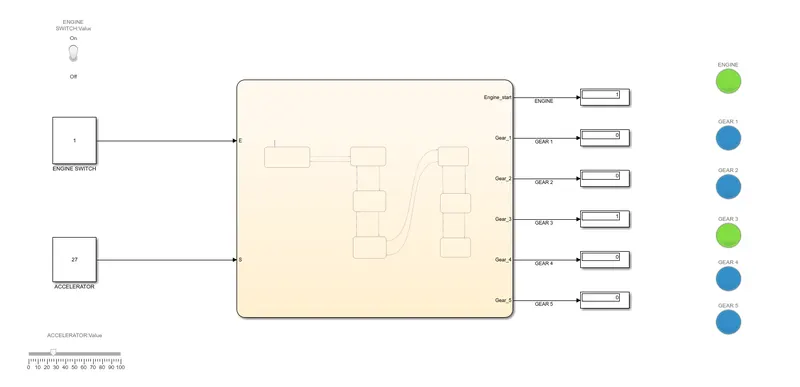
This snapshot shows the outcome for a speed of 90, which indicates that the vechicle must be running in GEAR 5.
CONCLUSION :
Stateflow is generally used to specify the discrete controller in the model of a hybrid system where the continuous dynamics are specified using simulink.
Specific applications for Stateflow include:
- Mode logic, where each discrete mode of a system is represented by a state.
- Fault management, where the Stateflow chart is used to control how the system responds to faults and failures within a system.
- Task scheduling, where the Stateflow chart is used to schedule when specific tasks occur, either within the Stateflow chart or within the overall Simulink model.
The given cases were implemented and simulated through controllogic and state flow.
It was made sure that the simulation included all the given conditions and the necessary outputs were provided.
REFERENCES :