Week-4 Challenge WOT Condition Part-2
- What is the difference between mapped and dynamic model of engine, motor and generator? How can you change model type?
SOL:
- IN Mapped model lookup tables are used in terms of data which is given in the spread sheet. this Model uses a set of steady-state lookup tables to characterize engine performance.The tables provide overall engine characteristics, including actual torque, fuel flow rate, BSFC, and engine-out exhaust emissions. It is very fast in simulattion.
- IN Dynamic model decomposes the engine behavior into engine characteristics that are separated into lower-level components. By combining components in this way, the models capture the dynamic effects.
How can you change model type:
Generator: HevMmReferenceApplication/Passenger Car/Electric Plant/Generator
Motor: HevMmReferenceApplication/Passenger Car/Electric Plant/Motor
Engine: HevMmReferenceApplication/Passenger Car/Engine
Generator Model: In generator block there will be two model mapped and dynamic we can swape the model here
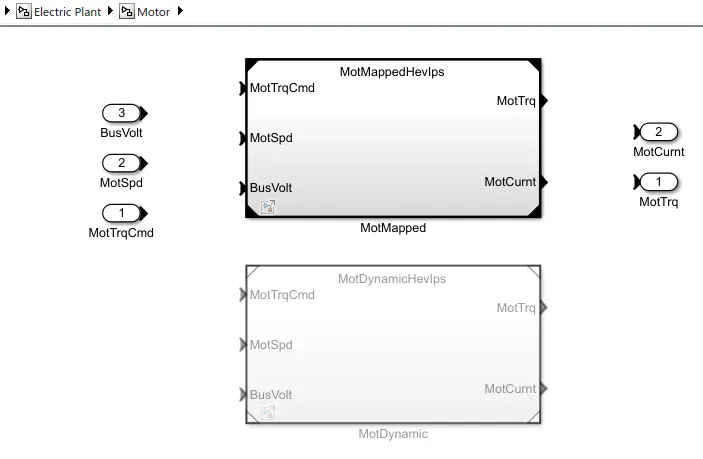
MOTOR MODEL:In motor block there will be two model mapped and dynamic we can swape the model here
ENGINE MODEL:In Engine block there will be two model mapped and dynamic we can swape the model here
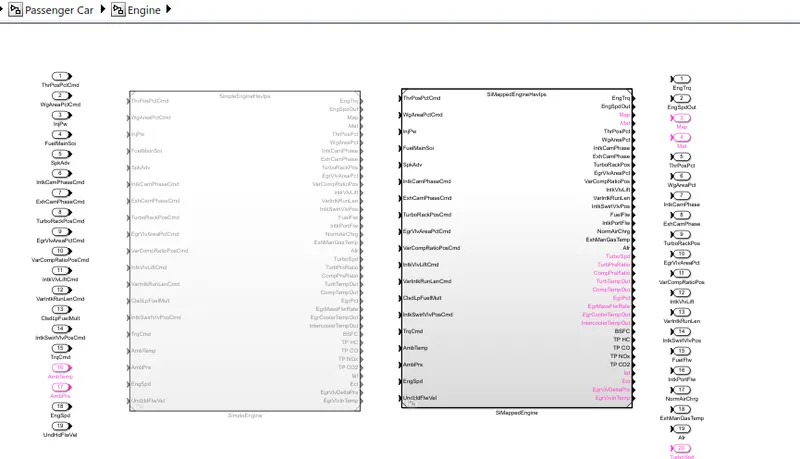
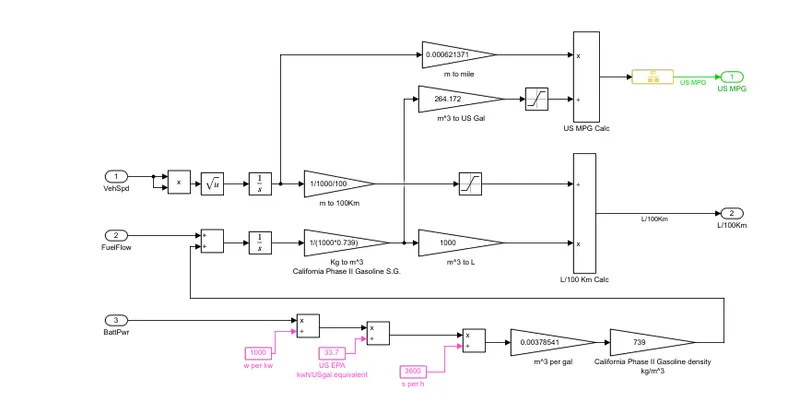
2) How does the model calculate miles per gallon? Which factors are considered to model fuel flow?
SOL:
Based on the inputs from vehicle speed, Fuel flow and battery power miles per gallon is calculated in the model:
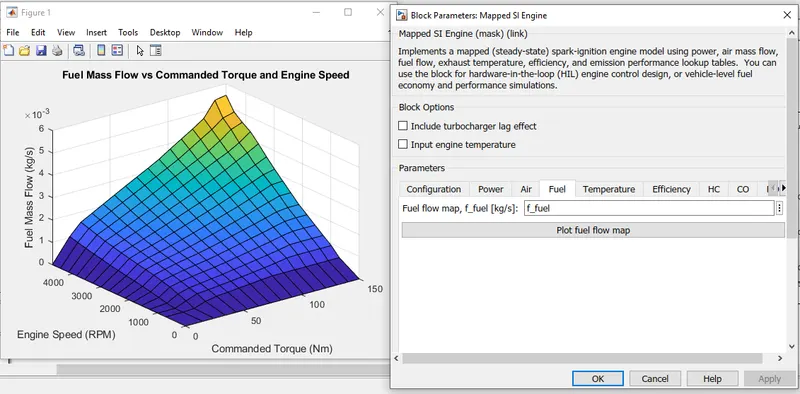
Fuel Flow Graph:
3) Run the HEV ReferenceApplication with WOT drive cycle. Change the grade and wind velocity in the environment block. Comment on the results.
SOL:
mps= meter per secand
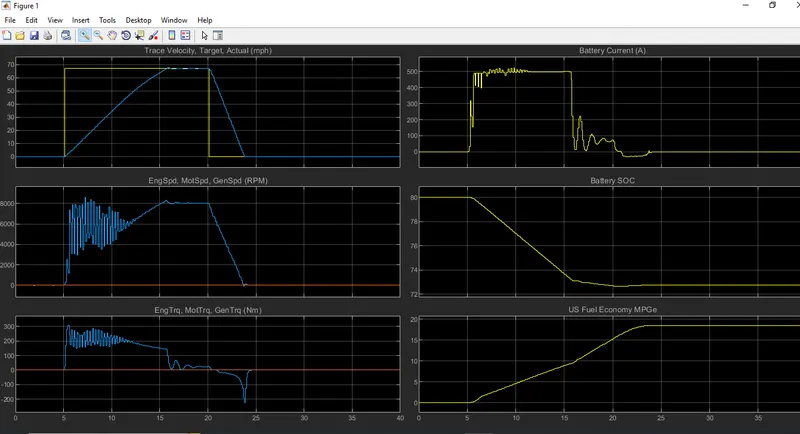
GRADE=0% , Wind speed=0 mps:
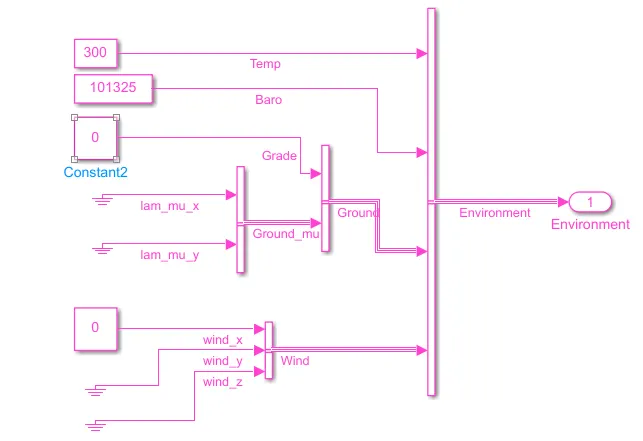
Simulation result of grade=0% and wind=0mps:
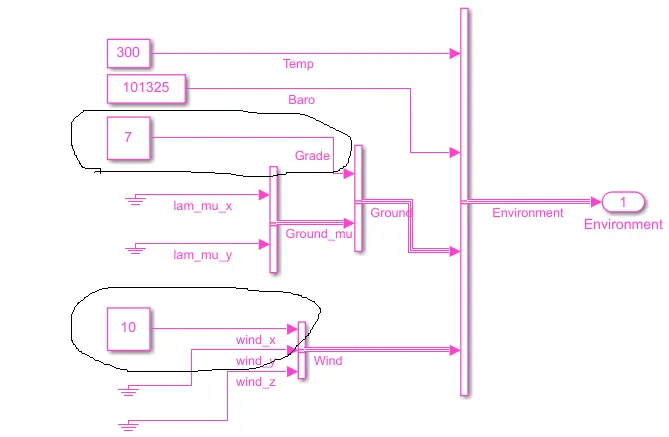
GRADE=7% , Wind speed=10 mps:
Simulation result of grade=7% and wind=10 mps:
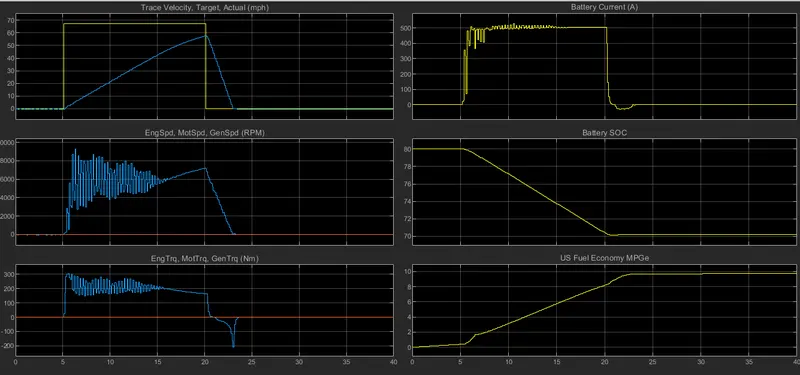
| s.no | Description | Grade=0% and wind velocity =0mps | Grade=7% and wind velocity =10mps |
SI units |
| 1 | Drive cycle | WOT |
WOT |
- |
| 2 | Fuel Economy | 18 |
9.5 |
MPG(milles per gallen) |
| 3 | Battery SOc | 80 - 73 | 80 - 70 | Percentage |
| 4 | Battery current |
500 amps Peak 50 amps average |
500 amps during full duration | Amps |
|
5 |
Motor speed | 8000 |
9000 Peak 8500 Average |
RPM |
- From the above results while changing the grade and wind speed the set velocity is not reaching due to Battery reaching the maximum discharging capacity. set target velocity is 68 but velocity reached is 58 only.
- For reference iam attaching the matlab output.
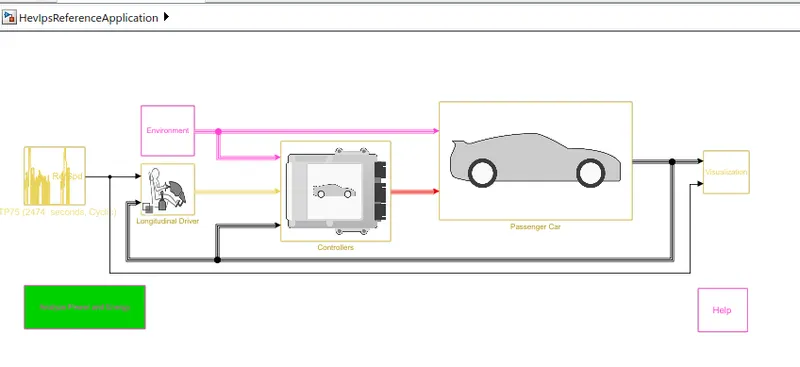
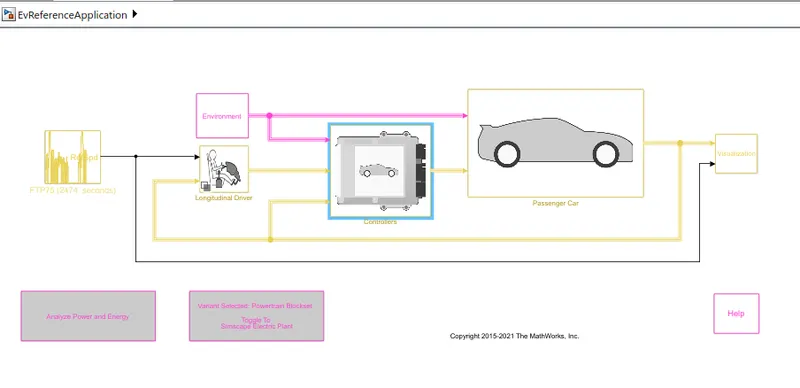
4) Keeping all other parameters same, compare the simulated results of hybrid and pure electric powertrains.
SOL:
HEV model:
PURE EV model:
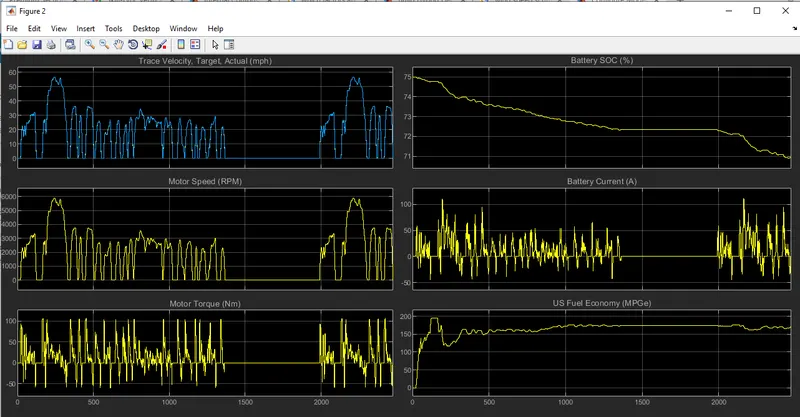
Pure Electric simuatiion Result:
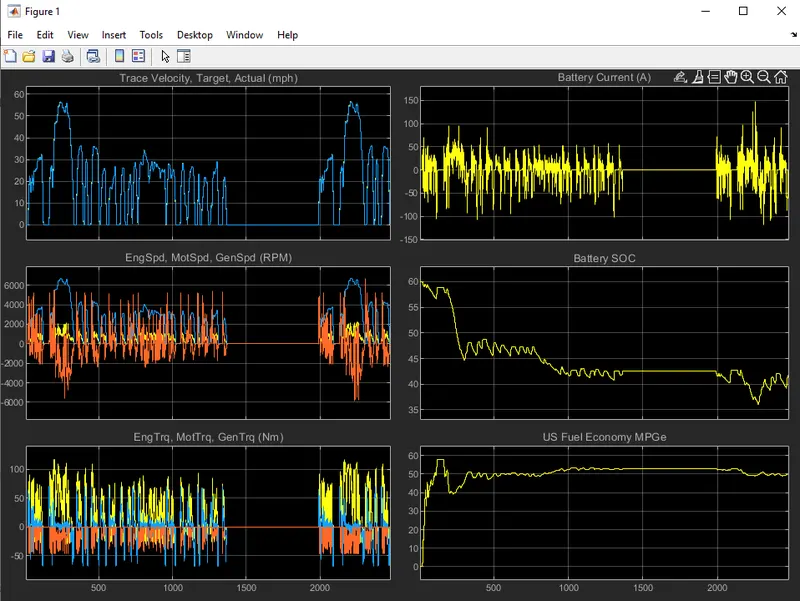
Hybrid Electric simuatiion Result:
| s.no | Description | HEV | PURE EV |
SI units |
| 1 | Drive cycle | FTP75 | FTP5 |
- |
| 2 | Fuel Economy | 50 |
175 |
MPG(milles per gallen) |
| 3 | Battery SOc | 60% to 40 % | 75% to 71% | Percentage |
| 4 | Battery current |
50 amps peak 25 amps average |
100 amps peak 50 amps average |
Amps |
|
5 |
Motor speed |
6000 peak 3500 average |
6000 peak 3000 average |
RPM |