Week-4 Challenge WOT Condition Part-2
1)What is the difference between mapped and dynamic model of engine, motor and generator? How can you change model type?
Ans:Mapped model of engine , motor and generator are withpredefined values in the form of lookup tables.
Dynamic model of engine , , motor and generator are having active components like inverter , motor , feedback controller etc. Here components inputs are altered or changed by user.
To get started with the Power train block set select models from the mathwork website shown below. Here we have considered: Full electric vehicle model and Hybrid electric vehicle multimode model.
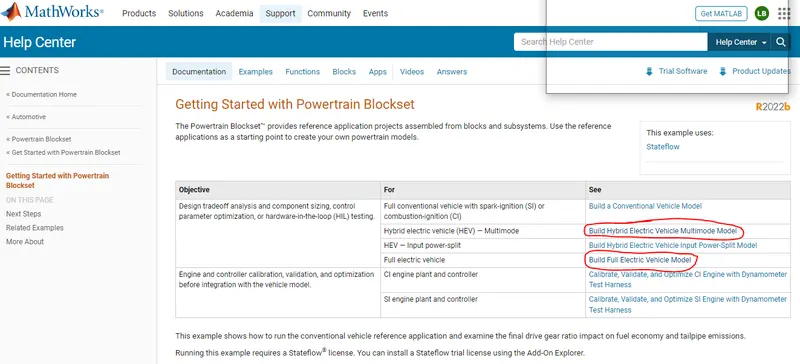
Mapped model can be opened by using below step.
1) Click on help section in matlab
2) Get started with powertrain blockset
3)Select EV vehicle
4)Then the below attached model will open in matlab.
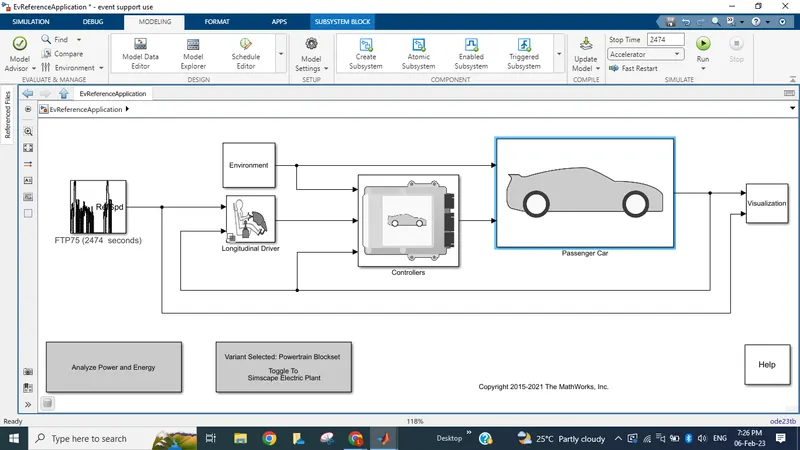
5)Click on passenger car block below --->Click on Electric plant block--->Then click on Powertrain blockset--->Then click on Motor. There are 2 types of Motor. a) MotGenEVmapped b) MotGenEVdynamic.
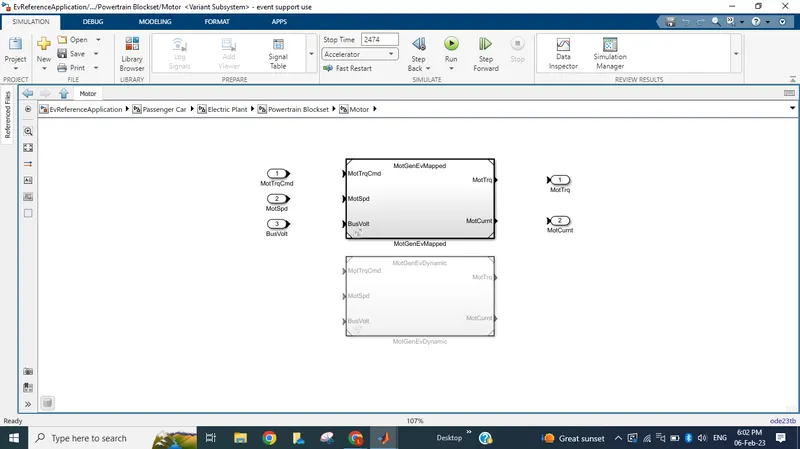
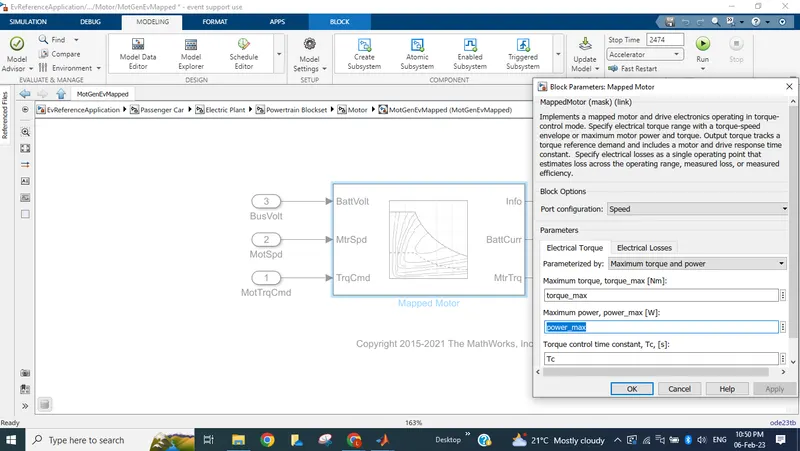
The parameteres for Mapped motor are:
Electrical torque. parameterised by max torque and max power. Also specify Electrical losses as a single operating point that estimates loss across the operating range , measured loss or measured efficiency.
For Dynamic motor model:Here the block shows an active components of PMSM controller and 3 phase inverter
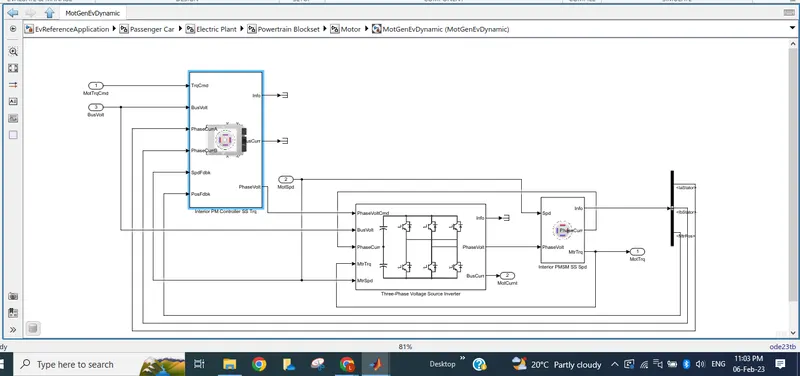
How to change the model type in EV power train blocks.
Select MotGenEVdynamic. Use a varient manager command in modelling tab . Right click on the model you want to activate ie MotgenEV dynamic and select set as Label mode active choice.Refer a below image
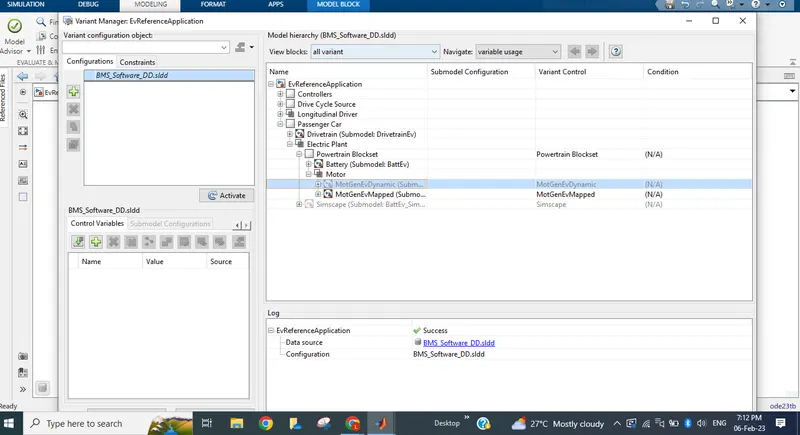
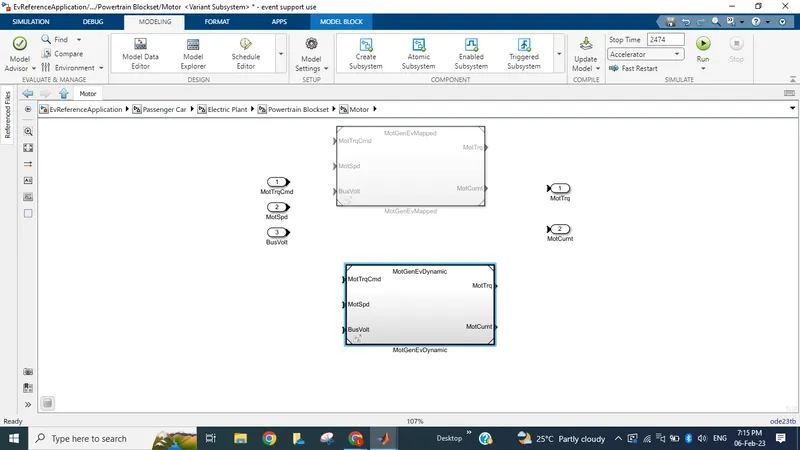
Then MotoGenEVDynamic is activated as shown below.
2) How does the model calculate miles per gallon? Which factors are considered to model fuel flow?
MPG(miles per gallon): is the distance measured in miles,that a car can travel per gallon of fuel. MPG is also the primary measurement of car's fuel efficiency. the higher a car's MPG, the more fuel-efficient it is.
To calculate the feul flow , vehicle speed and battery power are taken into consideration.
to calculate the MPG click on Visualisation block , then performance block will open which is shown below.
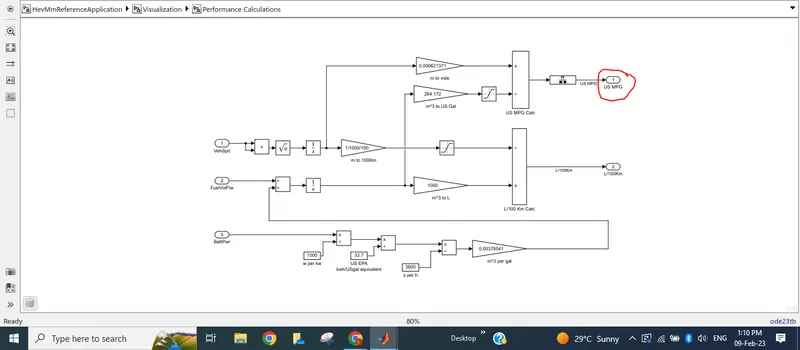
THis calculation is for HEV which means it contains both feul and battery energy.
- First we get battery power in watt which is converted into Kwatt & further converted into kw/h.
- Now Kw/h battery power is converted into US gallon equivalent energy by deviding it by the standard value 33.7. Then converted into US gallons per second.
- It is multiplied by standard value 0.00378541 to get volume in meter cube per gallon and is added to the fuel flow for total value as it is an HEV.
- Further meter cube is converted into US gallon.
On the other hand , the speed of the vehicle is integrated to get distance and the distance which is in the meter is converted into mile by multiplying the standard value 0.000621371.
The factors considered for fuel flow are:
a) Battery power b)Fuel flow c) Vehicle speed.
3)Run the HEV Reference Application with WOT drive cycle. Change the grade and wind velocity in the environment block. Comment on the results.
Ans: For HEV Reference model , now change the drive cycle source to WOT as shown below.
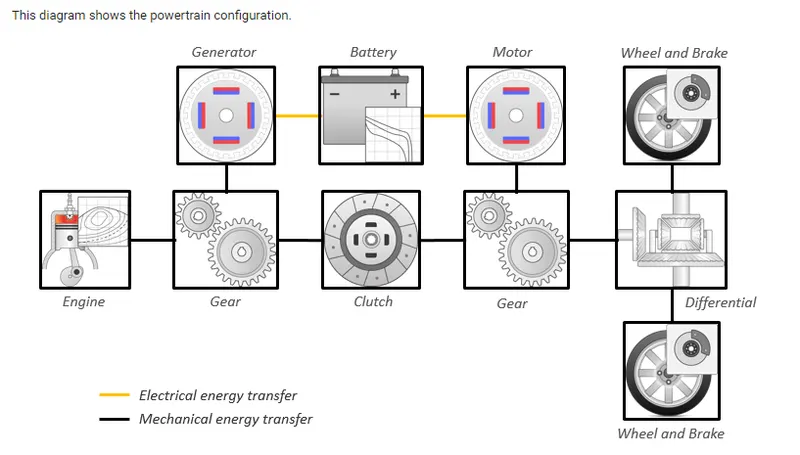
Powertrain configuration of Hybrid electric vehicle.
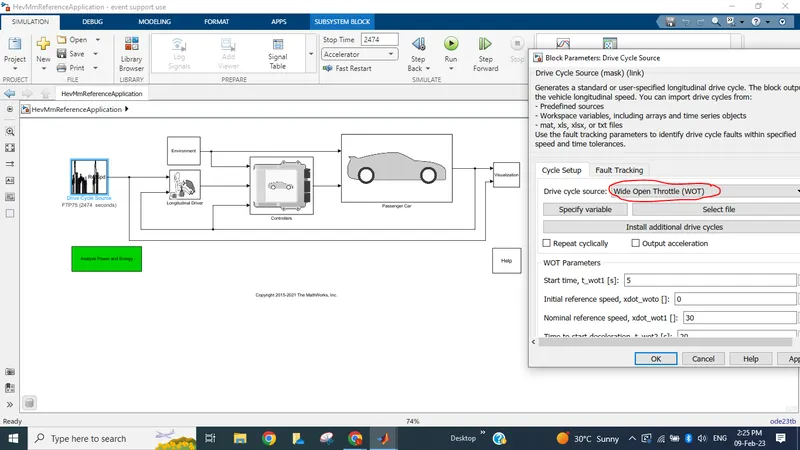
The drive cycle changes to WOT
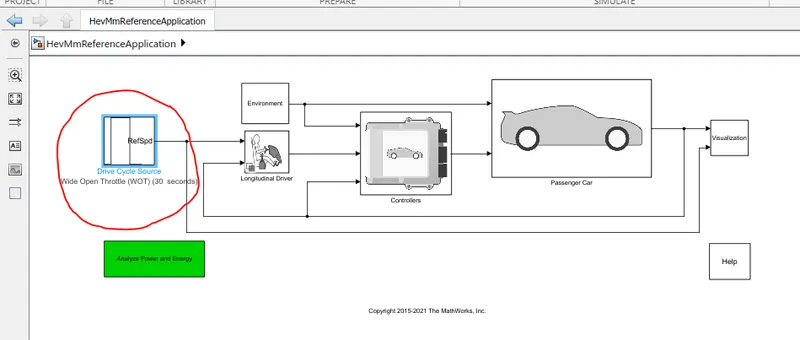
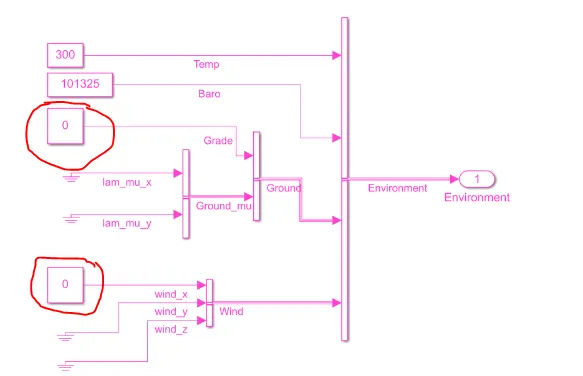
Click on the Environment block to change the Grade and wind velocity to check the effect of both the respective parameters .
Initially keep both the parameters to '0' then click on run button.We can change our simulation stop time , program execution type, on accelerator mode Now we will put grade value and wind in the x-direction in the environmental block to see a different result . Keep all the conditions default.
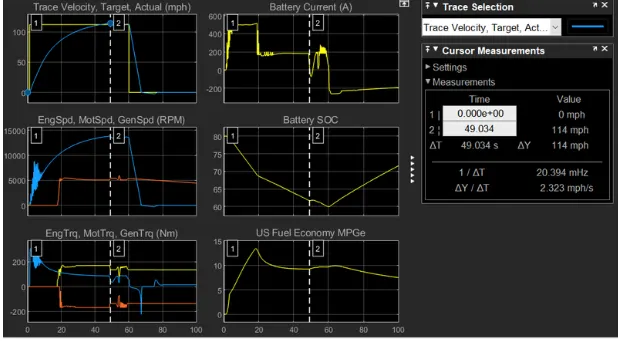
Keeping grade angle 0 and Wind velocity 0
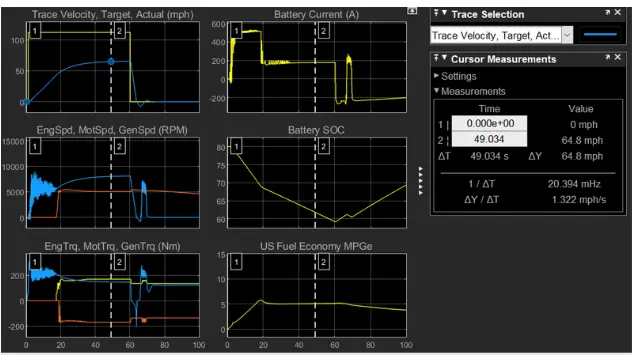
Keeping grade angle 10 and Wind velocity 0
Keeping grade angle 10 and Wind velocity 20
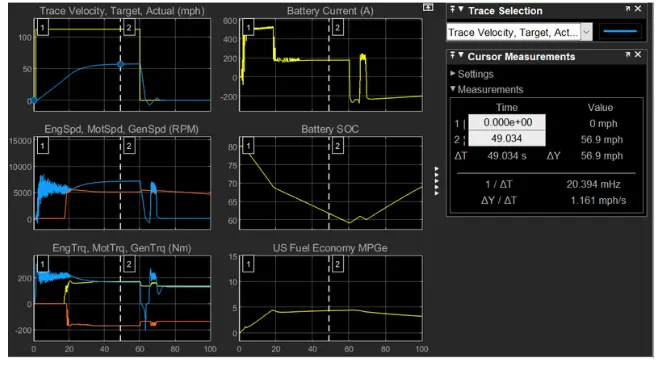
a) When the grade and wind velocity are kept 0, Acceleration time of 49 sec is observed and top speed of 114 mph is observed. When the grade is kept at 10 degrees, for the same acceleration time, top speed observed is 64.8 mph. When the grade is kept at 10 degrees and wind velocity is also applied equal to 20 m/s, top speed decreased to 56.9 mph. Hence top speed decreased with increase in grade and wind velocity.
b) Battery SOC remains same for all the cases.
c) With increase in grade and wind velocity, miles per gallon also decreased.
Qusn 4) Keeping all other parameters same, compare the simulated results of hybrid and pure electric powertrains.
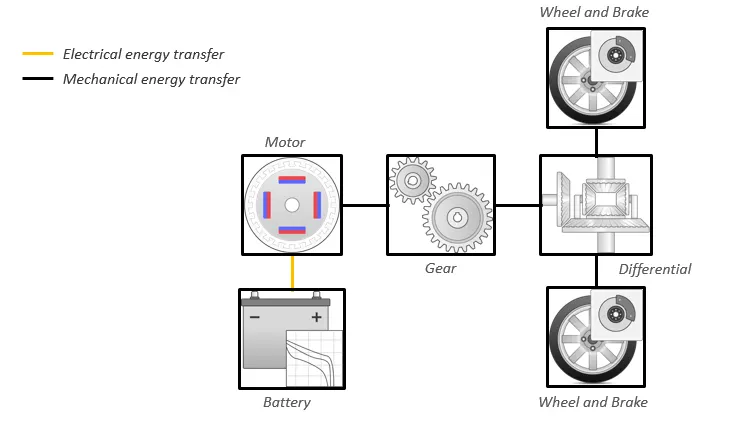
Powertrain configuration of electric vehicle.
a) When Grade and wind velocity =0
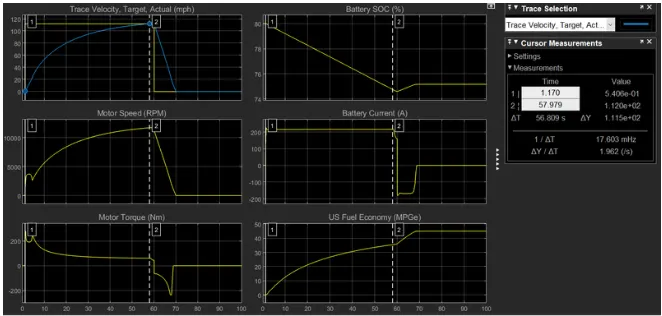
a) When Grade and wind velocity =0
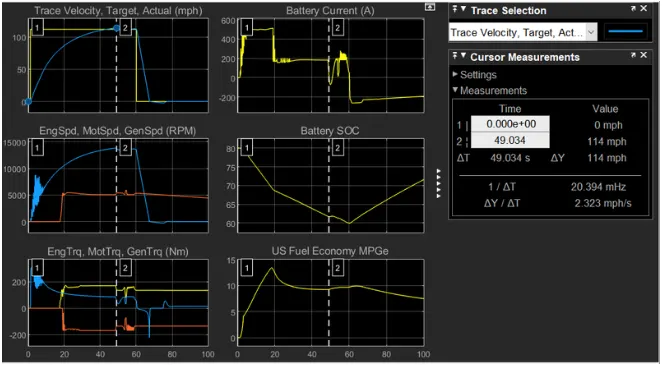
Conclusion:
- Better fuel economy is observed in case of EV for obvious reasons (It is fully working on Electric propulsion, whereas Hybris electric vehicle has fuel propulsion as well).
- Battery SOC decreased more for HEV case because of more weight of the vehicle (considering both HEV and EV working in electric propulsion domain).
- More top speed and less acceleration time is observed in HEV.