Week-4 Challenge WOT Condition Part-2
1. What is the difference between the mapped and dynamic model of the engine, motor, and generator? How can you change the model type?
Engine
Mapped: The mapped model of the engine represents the engine as a set of pre-determined performance characteristics, such as torque and power output at different operating points. The characteristics are typically determined through experimental testing and are stored in a look-up table
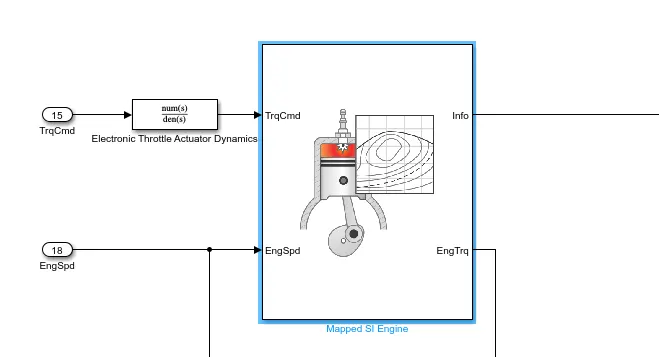
Dynamic: The Dynamic model of the engine represents the engine as a set of mathematical equations that describes the behavior over time. These equations take into account the factors such as engine speed, load, and temperature, and can be used to simulate the engine behavior in real time.
The Dynamic model is more accurate but also more complex and slower to execute than the mapped model.
Motor
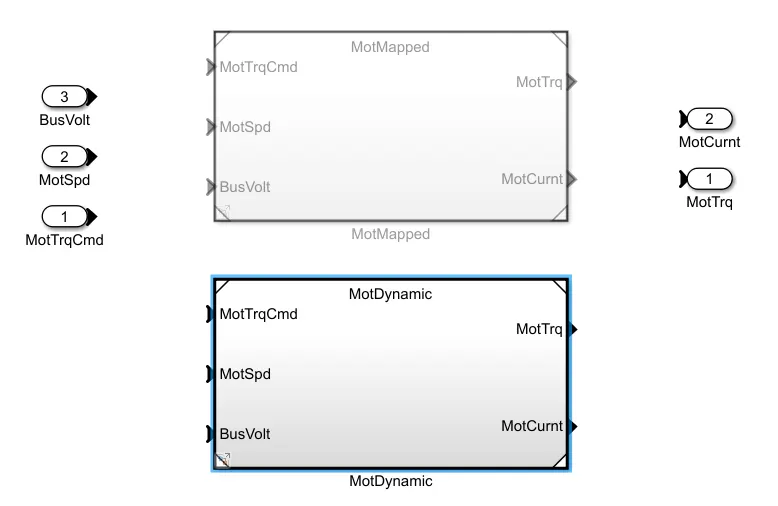
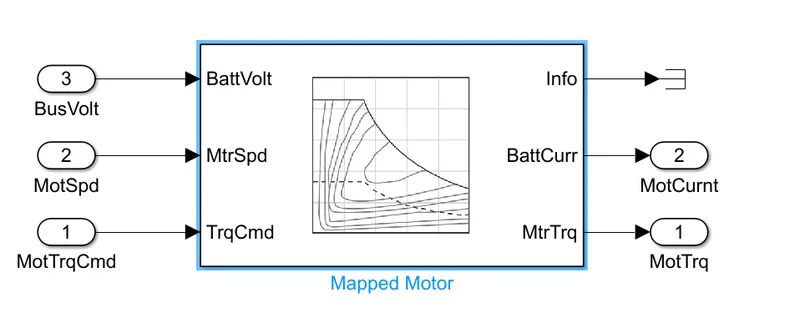
Mapped: The mapped model of the motor represents the motor as a set of pre-determined performance characteristics, such as torque and power output at different operating points. The characteristics are typically determined through experimental testing and are stored in a look-up table
Dynamic: The Dynamic model of the motor represents the motor as a set of mathematical equations that describes the behavior over time. These equations take into account the factors such as rotor speed, load, and temperature, and can be used to simulate the motor behavior in real-time.
The Dynamic model can include the dynamics of the motor such as the stator and rotor inductance, resistance and back emf constant, the rotor speed and torque, the electromagnetic torque, and the stator and rotor flux. This model can be used to simulate motor behavior under different load conditions and to optimize the control strategy of HEV.
Generator
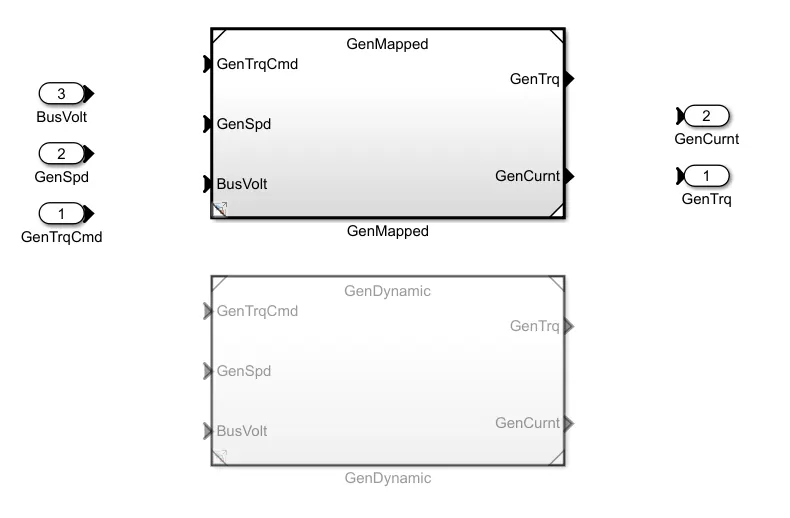
Mapped: The mapped model of the Generator represents the Generator as a set of pre-determined performance characteristics, such as voltage and current at different operating points. The characteristics are typically determined through experimental testing and are stored in a look-up table
Dynamic: The Dynamic model of the Generator represents the Generator as a set of mathematical equations that describes the behavior over time. These equations take into account the factors such as rotor speed, load, and temperature, and can be used to simulate the Generator behavior in real time.
Both models are used to approximate the real generator behavior and can be used for HEV modeling. The choice of which one to use depends on the level of complexity and accuracy required for the specific application. The mapped model is simpler but the dynamic model is more accurate and can provide more detailed information about generator behavior over time.
Switching between Mapped and Dynamic Models
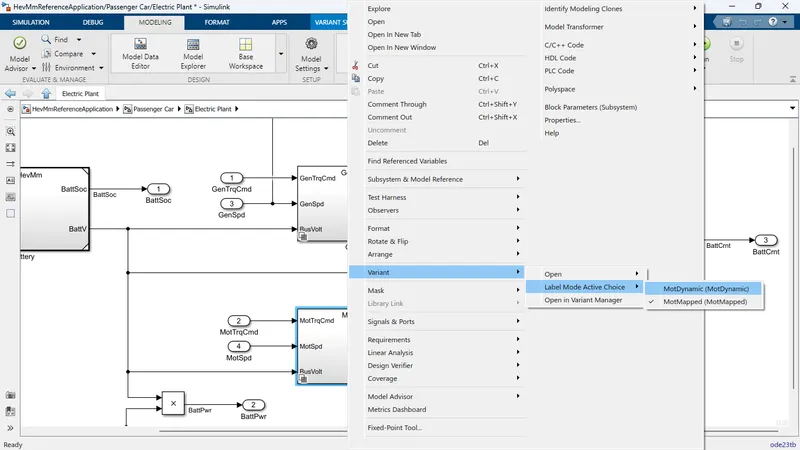
Normally the default model is the mapped one. To change the model from mapped to dynamic.
Step 1: Right-click the model which you want to change.
Step 2: From the drop-down menu select variant.
Step 3: Then select 'Lebel Model Active Choice'
Step 4: Double-click Dynamic Model.
The steps are shown in the screenshot shown below;
2. How does the model calculate miles per gallon? Which factors are considered to model fuel flow?
Miles per gallon (MPG) is a unit of measurement used to express the fuel efficiency of a vehicle. It represents the number of miles a vehicle can travel on one gallon of fuel. For example, a vehicle with an MPG of 30 can travel 30 miles on one gallon of fuel.
The HEV model calculates miles per gallon(MPG) or miles per gallon equivalent(MPGe) in the case of the pure electrical vehicle as follows
- The MPG calculation can be found in the performance calculation block in the visualization block.
- By double-clicking the performance calculation block we can see the following arrangements.
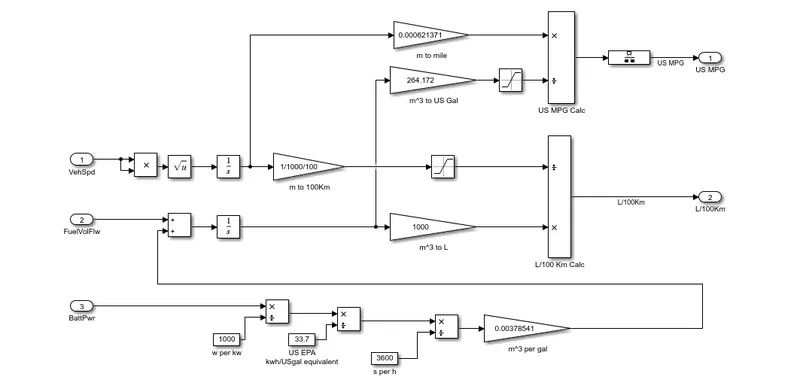
- From the above Diagram, we can conclude that the MPG calculation is done based on the Batter power output.
- The battery power is first converted from Watts to kilo-watts by dividing it by 1000.
- The EPA calculated that 33.7 kilowatt hours of electricity is equivalent to one gallon of gas.
- The vehicle speed input is in m/s which is converted into miles by multiplying with 0.000621371.
- The kilogram of fuel is converted into cubic meters by multiplying by 1/(1000*0.379), Cubic meters = kilograms / (density in kg/m^3)
- ,this cubic meter value is then converted into gallons by multiplying it by 264.172. The mile value and gallon value are used to find the mpg of the vehicle.
- The battery value is initially converted from watts to kwh by dividing by 1000 and then to gallon equivalent by again dividing it by 33.7(33.7 kwh=1 gallon)
- Then dividing the value by 3600 to get in per second and multiply by 0.00378541 to get the value in cubic meters per gallon.
MPGe (miles per gallon of gasoline equivalent) is a unit of measurement used to express the fuel efficiency of electric vehicles (EVs) and hybrid electric vehicles (HEVs). It represents the number of miles an EV or HEV can travel on the energy equivalent of one gallon of gasoline. It is used to compare the fuel efficiency of EVs and HEVs to that of traditional gasoline-powered vehicles.
3. Run the HEV ReferenceApplication with WOT drive cycle. Change the grade and wind velocity in the environment block. Comment on the results.
The model is loaded by running the 'autoblkHevStart' command in the command window.
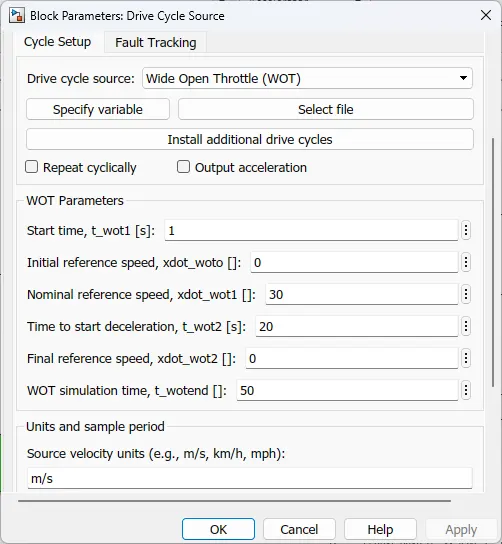
Drive Cycle
- The drive cycle is changed to Wide Open Throttle(WOT)
- With a Start time of 1 second, reference speed to 30 m/s.
- The deceleration time is 20 seconds.
- The WOT simulation time is set to 50 seconds.
The setting is shown below;
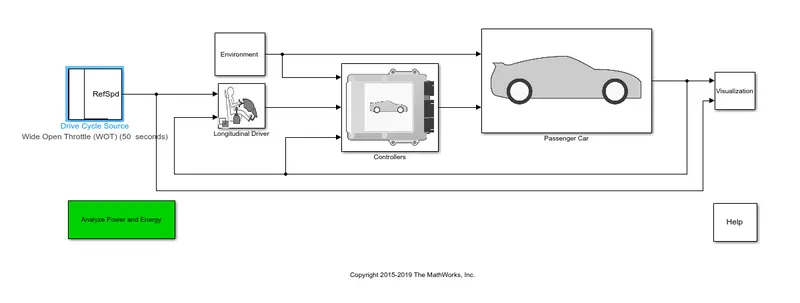
The HEV vehicle Model with WOT Drive cycle is shown below;
The Grade and Wind Velocity
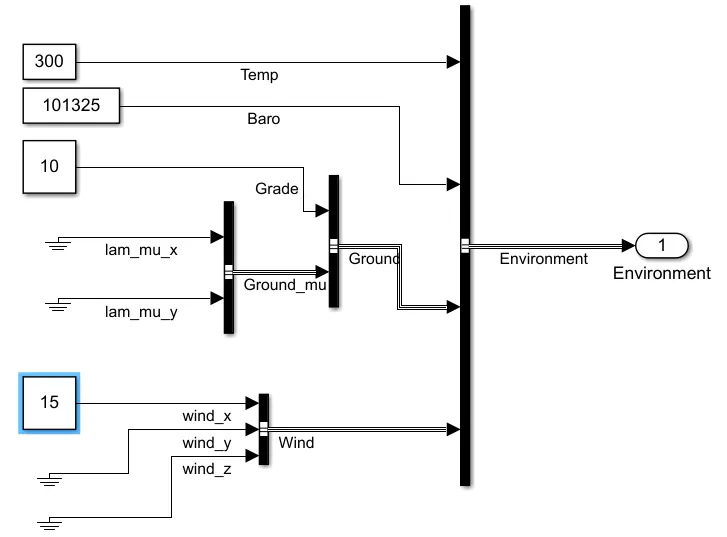
The wind velocity and Grade are changed within the environment block.
Wind velocity is set to 15 m/S, and the Grade is set to 10 Degrees.
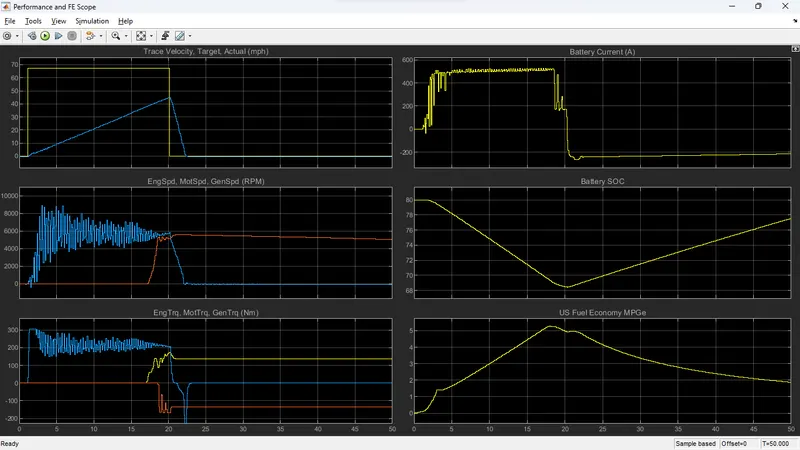
Simulated the Model and obtained the output as shown below;
Conclusion
Plot 1
trace velocity, target, actual:
top velocity achieved =45 mph.
time taken to accelerate = 20 sec.
time taken to deaccelerate = 2.5 sec.
Plot 2
motor&engine rpm:
top motor rpm=9000 rpm.
top engine rpm = 5800 rpm.
Plot 3
motor& engine torque:
maximum motor torque = 310 N-m.
maximum engine torque = 175 N-m.
Plot 4
battery current:
the battery supply current is at its maximum value of around 550 amperes when full throttle is applied by the user it reduces drastically to the value of negative 225 during the deceleration of the vehicle.
Plot 5
battery soc:
the battery soc will fall from 80% to 67 % during the acceleration of the vehicle and it increases to 67% to 78 % during deceleration due to regenerative braking.
Plot 6
fuel economy:
maximum fuel economy achieved = 5.3
4. Keeping all other parameters the same, compare the simulated results of hybrid and pure electric powertrains.
The model is loaded by running the 'autoblkEvStart' command in the command window.
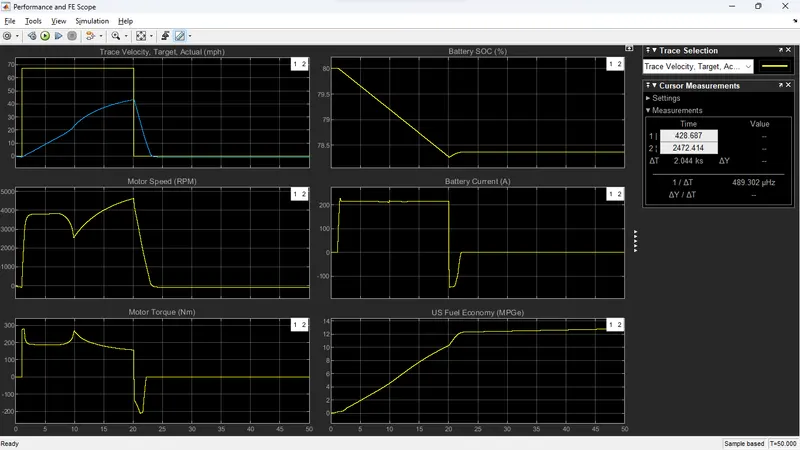
The simulated result for Pure EV is shown below;
Conclusion
- The top speed achieved by a hybrid electric vehicle is more than that of an EV.
- Higher fuel economy is achieved in the case of pure EVs.
CONCLUSION
- The difference between the mapped and dynamic models of the engine, motor, and generator are analyzed. And understand to change the model types.
- Analyzed How does the model calculate miles per gallon and understands what factors are considered to model fuel flow.
- Ran the HEV Reference Application with WOT drive cycle. Changed the grade and wind velocity in the environment block. And analyzed the results.
- By keeping all other parameters the same, compared the simulated results of hybrid and pure electric powertrains.