Project - Data Handling and Interpolation
Project
In a laboratory experiment, data on voltage and current has been recorded and the same is attached in an excel file. Read the excel file in the Matlab program and perform the interpolation in the range of (-17.3:0.1:0.9). Generate the interactive plot for the interpolated data and store them in a text file.
Steps
- Started a new programme named 'interpolation_proj.m'
- Loaded the given experiment data in the excel file to the Matlab workspace with a variable name 'data'.
- Extracted the Voltage and corresponding Current values to variables 'V' and 'I'
- Defined the interpolation range as given and stored in a vector 'Vi'.
- Performed interpolation of data in the given ranges linearly.
- Plotted the original and interpolated curves.
- Saved the interpolated values to a text file named 'interp_data.txt '(assigned a 'for' loop to continuously write the interpolated data to the text file over the range ).
Matlab Code
data = xlsread("VI.xlsx"); %loading voltage vs current data from the given excel file
V = data(:,1);             %assigning the values Voltage values to a vector V
I = data(:,2);             %assigning the values of Current values to a vector I

Vi = -17.3:0.1:0.9;        %defining interpolation range

V_interp1 = interp1(V, I, Vi, 'linear'); %interpolating

%plotting
plot(V,I,'b*',Vi,V_interp1,'r');
title('Voltage-Current Plot');
xlabel('Voltage (V)');
ylabel('Current (mA)');
legend('Original','Interpolated');
grid;

%storing the data in a text file interp_data.txt
fileID = fopen('interp_data.txt','w');
fprintf(fileID,'Voltage(V)\tCurrent(mA)\n');
for k = 1:length(Vi)
    fprintf(fileID,'%f\t%f\n',Vi(k),V_interp1(k));
end
fclose(fileID);
Output
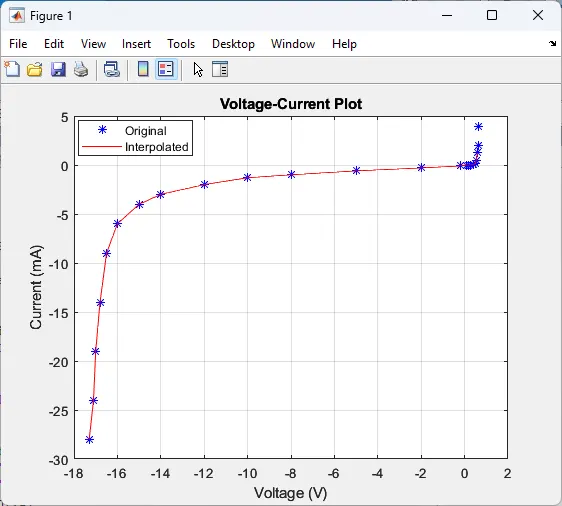
Output is obtained, the desired graph is plotted and the interpolated data is stored in a text file.