Wide Open Throttle Condition Part-2
Aims:
- To differentiate between mapped and dynamic motor, generator and engine. To suggest on how to change the model type from mapped to dynamic.
- To determine how the model calculated miles per gallon and to determine factors considered to model fuel flow.
- To simulate the HEV Simulink model with WOT drive cycle and to comment on results by changing grade and wind velocity.
- Keeping all other parameters same, compare the simulated results of hybrid and pure electric powertrains.
Theory:
Part 1: To differentiate between mapped and dynamic motor, generator, and engine. To suggest on how to change the model type from mapped to dynamic.
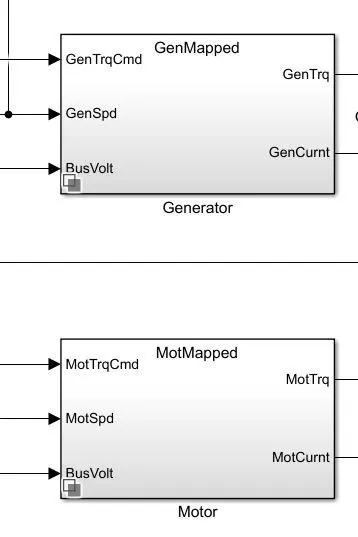
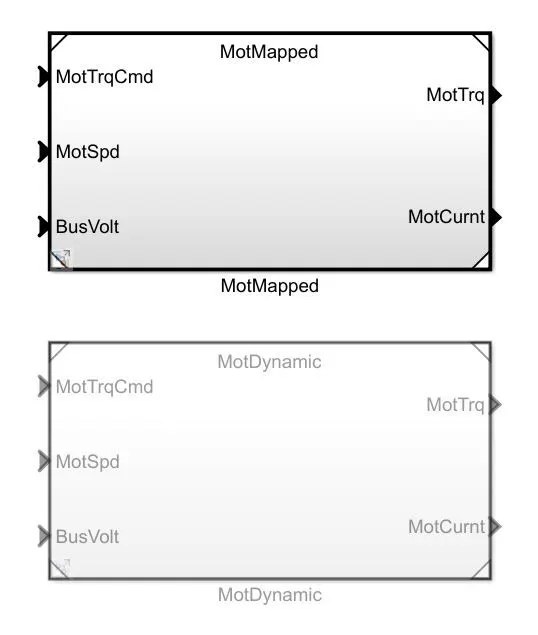
Difference in Mapped and Dynamic Motor: As shown above are the mapped and dynamic motors in the hybrid electric vehicle model of Simulink. The mapped motor uses the torque control mode, whereas in the dynamic motor uses the three phase permanent magnet synchronous motor. The mapped motor is used when the user requires the faster simulation and when the user do not have in-depth knowledge about the motor, whereas the dynamic motor is used when the user has the real time data of the motor to simulate or knows which parameters are to be used in a particular simulation. The dynamic motor is precise and more accurate compared to the mapped model.
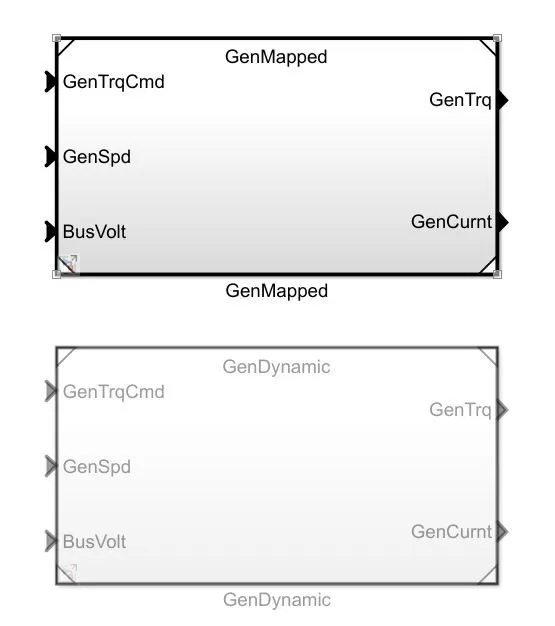
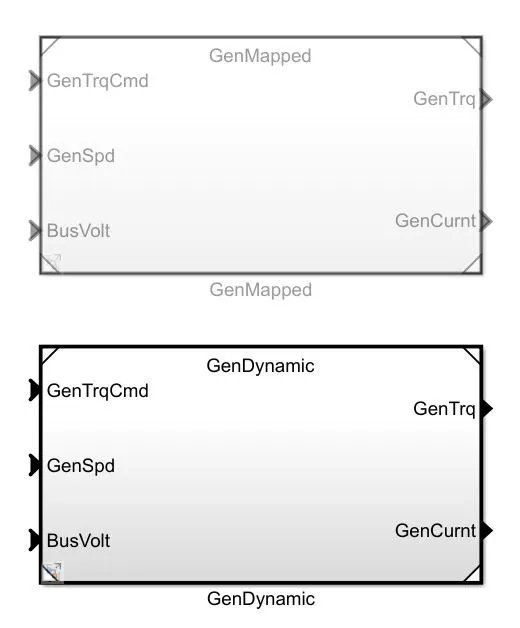
Difference between Mapped and Dynamic Generator: Shown above is the generator of the hybrid electric vehicle model. The block is similar to the motor, the mapped model uses the required data from the lookup tables corresponding to the given input parameters, whereas the dynamic model uses the manual input parameters to simulate the real time data given by the user. The simulation time used by mapped motor is less whereas the simulation time used by the dynamic model is more and the results from the dynamic model used for simulation are more accurate compared to the mapped model.

Difference in Mapped and Dynamic Engine: Shown above are the mapped and dynamic SI engines from the HEV model. Mapped model is the default selection in the HEV model for the simulation as it takes lesser time to simulation. The mapped model is the less accurate model which takes lesser time for simulation, whereas the dynamic model is more accurate based on the user inputs and takes more time to simulate, this type of model is used when subsystem data of a vehicle is required. There are also CI mapped and dynamic models available to simulate.
Steps to change the model from mapped to dynamic:
1) As seen below is the default view of the unchanged model of the mapped generator.
2) In the modelling tab of Simulink search for Variant Manager.
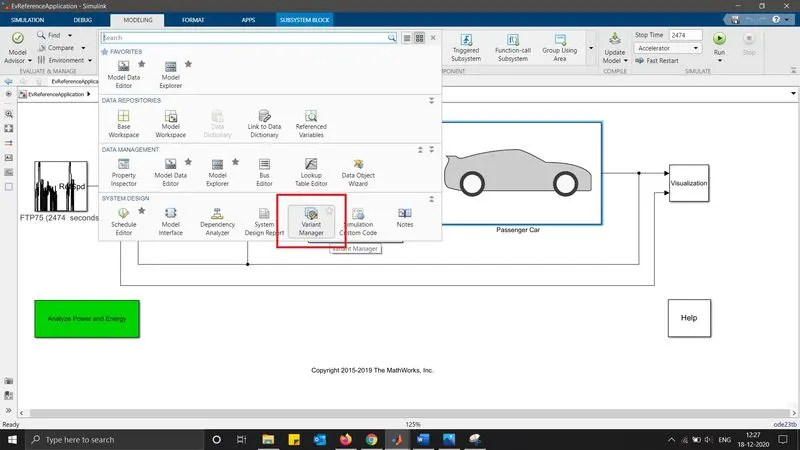
3) Thereafter, after selecting the variant manager, in the next screen search for the dynamic model of the motor, after going to the motor model.
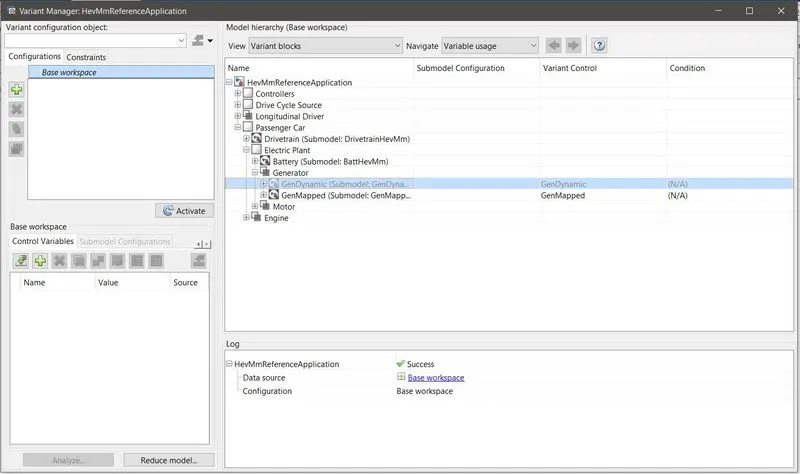
4) Right click on the model name and select “Set as Label Mode Active Choice” option of the model.
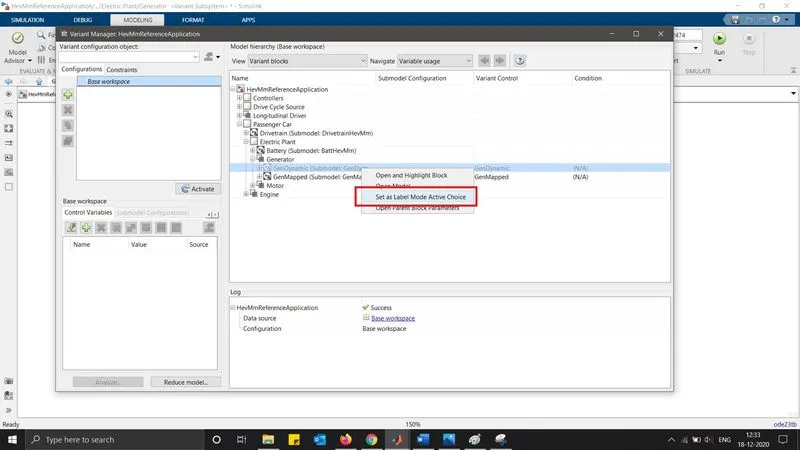
5) Once selected, the dynamic model becomes the model to be used in the simulation. As seen below is the model ready to be used for simulation
Part 2: To determine how the model calculated miles per gallon and to determine factors considered to model fuel flow.
Miles per gallon is the fuel economy rating which determines how far the vehicle can travel with one gallon of fuel in the vehicle. However, in this case we need to calculate the battery power and vehicle speed in miles per gallon are considered to compare the value with vehicle fuel consumption.
As seen on the Performance calculation block, there are two output ports which is US Fuel Economy MPGe and litre/100 km, wherein the litre/100km output is terminated. If required we can terminate the MPGe port and connect the litre/100km output to get the output scope in litre/100km. The MPGe standard stands for the Miles Per Gallon Equivalent which can be used to compare the gasoline efficiency to the BEVs, FCEVs and PHEVs. It was found that 1 gallon of the fuel has the same amount of energy as 33.7 kwh of electricity, this is used further in calculations to convert battery energy to fuel equivalent energy. Therefore, MPGe was formulated to compare the electric vehicle efficiency to the gasoline or diesel engine vehicles.
Below shown is the Visualization block which is found on the right hand side of the vehicle in the Simulink model. Inside the visualization block we can find the performance calculations block where the fuel economy is calculated for the vehicle. These can be found in both EV and HEV Simulink models.
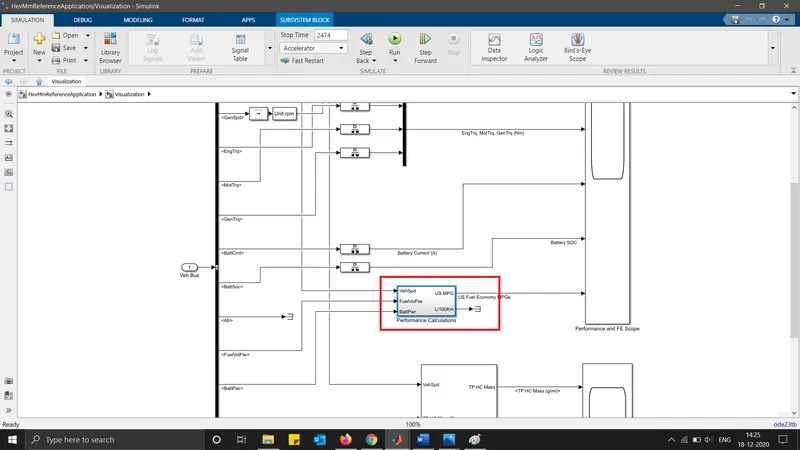
Inside the Performance Calculations block we can find the actual calculations done to calculate the fuel economy of the vehicle as shown below.
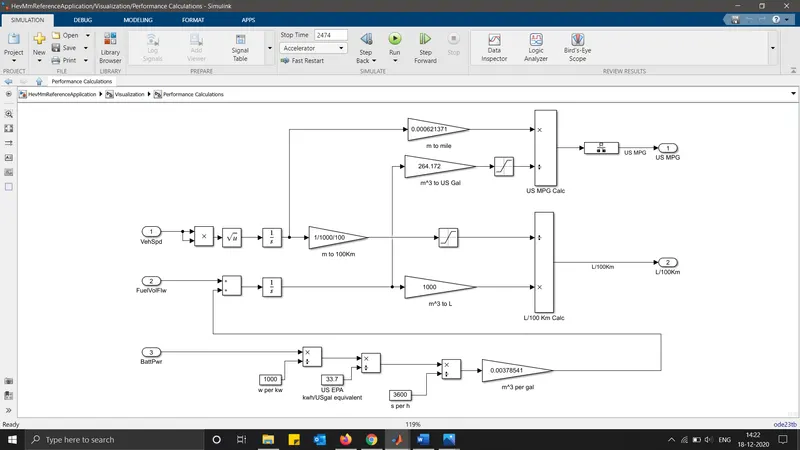
Here the inputs considered for the calculations are Vehicle Speed, Battery Power, and the Fuel Flow.
Here the vehicle speed is in m/s which is converted into miles by multiplying it with 0.000621371. Thereafter the fuel in cubic meter is converted to gallons by multiplying it with 264.172. The mile value and the gallon values are then considered to find the miles per gallon efficiency of the vehicle. Thereafter the battery is converted from watt to kwh by dividing it with 1000 and to gallon equivalent by dividing it with 33.7 as 33.7kwh is equal to 1 gallon of fuel. Thereafter dividing the value by 3600 to convert it to per seconds and then multiplying it by 0.00378541 to get the value in cubic meter per gallons.
Part 3: To simulate the HEV Simulink model with WOT drive cycle and to comment on results by changing grade and wind velocity.
Below shown is the HEV vehicle model of Simulink for which the simulation was carried out using WOT drive cycle for 100 seconds changing the grade and wind velocity values.
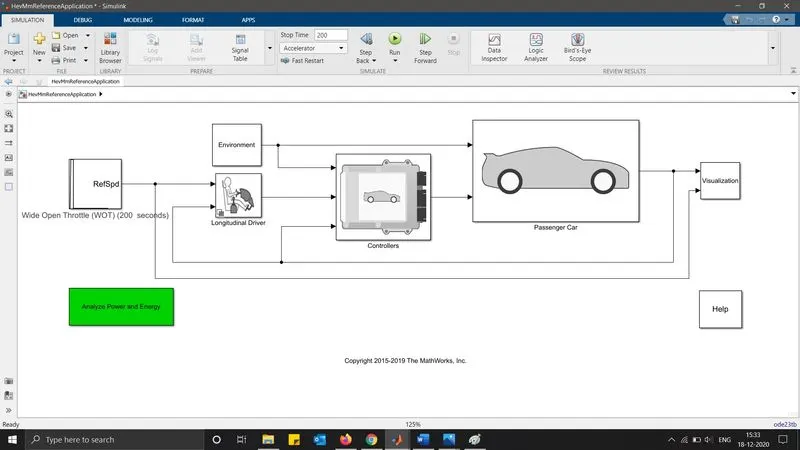
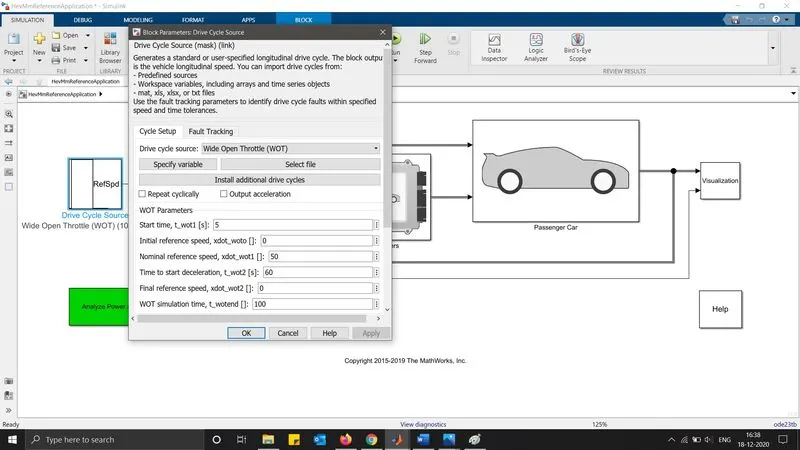
The drive cycle parameters are as shown below where the Nominal reference speed and Time to start deceleration were change as seen below.
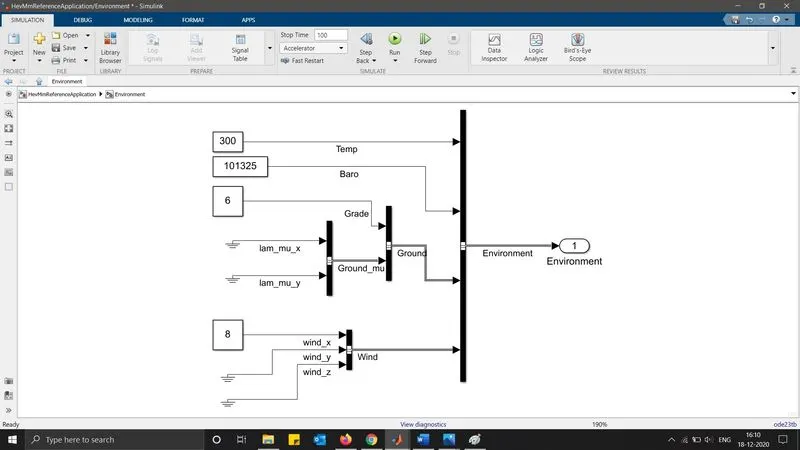
Thereafter, the grade and wind velocity were changed to 6 and 8 respectively.
The results scope of the simulation can be seen below.
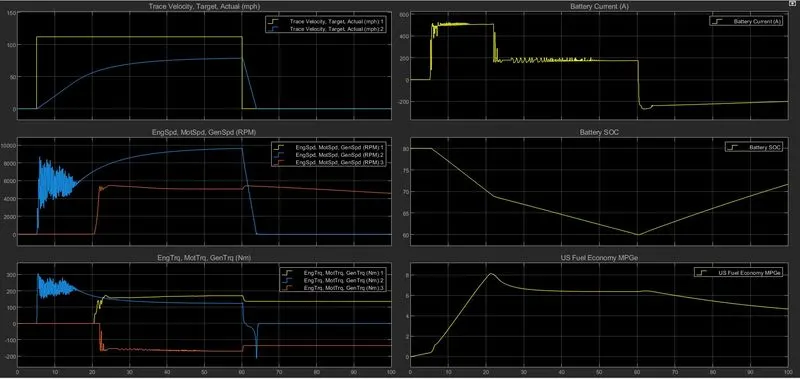
Graph 1: Trace Velocity, Target, Actual
Top Velocity achieved: 78.5 m/hr
Time Taken to Accelerate: 50 sec
Time taken to decelerate: 3.7 sec
The blue line and the yellow lines shows us the target and the desired paths, it can be said that the battery power isn’t enough to meet the requirements of the set environment parameters of the set grade and the wind velocity.
Graph 2: Motor, Engine and Generator RPM
Top motor RPM: 9652
Top Generator RPM: 5458
As seen in the graph the blue line which is the motor RPM that is increasing with the acceleration, as initially only motor is used to accelerate the vehicle hence having the higher RPM and torque. The yellow line must have been overlapped by the motor (blue line) plot. Later the red line representing generator kicks in to charge the battery when the SOC starts dropping.
Graph 3: Engine Torque and Motor Torque
Maximum Engine Torque: 170.2 Nm
Maximum Motor Torque: 306.9 Nm
Blue line indicating the motor torque is high initially. Thereafter the yellow line indicating the engine torque comes into the picture when the motor torque decreases a bit. Red line indicating the generator is negative throughout the time as it is charging the battery
Graph 4: Battery Current
The maximum battery current was observed to be 522.6 A during acceleration full throttle period and was observed to reduce to -267 A during deceleration period.
When it comes to accelerating the battery current is also increasing and during decelerating the battery current becomes negative, which means regenerative braking is happening in the vehicle. During the constant velocity the battery current requirement also becomes constant.
Graph 5: Battery SOC
The battery SOC was observed to fall from 80 to 60% during the full throttle period and was observed to rise from 60 to 71% during the deceleration, till the end of the simulation.
The SOC starts decreasing until the regenerative braking starts that is when decelerating starts which starts increasing the SOC.
Graph 6: US Fuel Economy MPGe
Max fuel economy achieved by the vehicle: 8.135 MPGe
Part 4: Keeping all other parameters same, compare the simulated results of hybrid and pure electric powertrains.
As shown below the parameters of EV model were changed as per previous WOT HEV simulation.
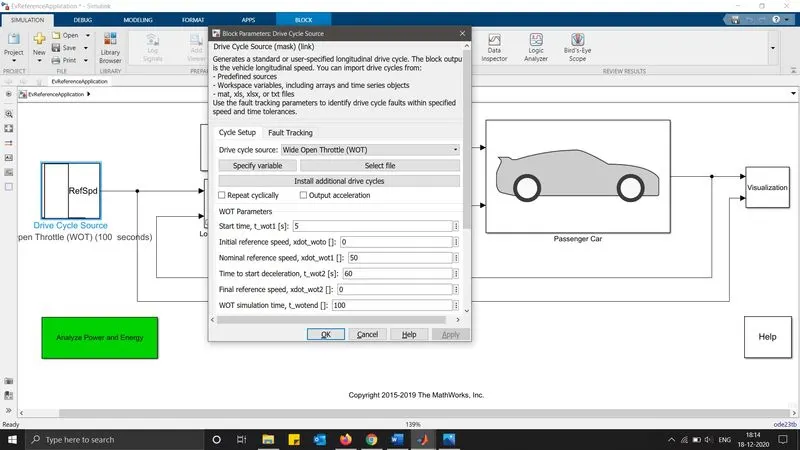
Drive cycle parameters of EV
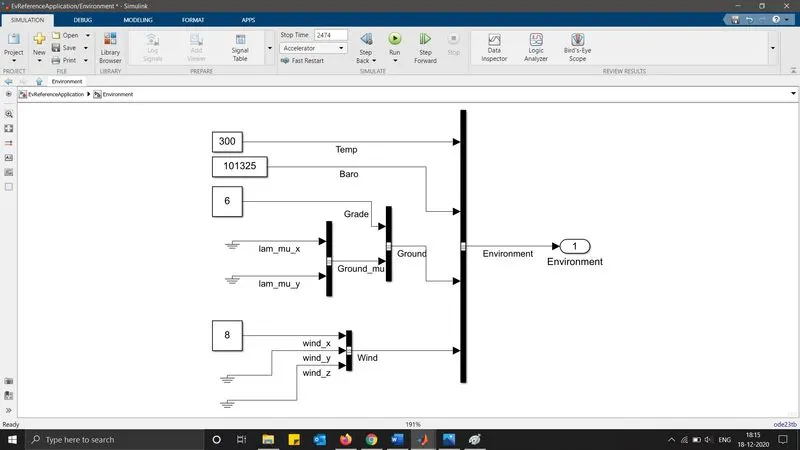
Environment parameters of EV.
Simulation results of EV:
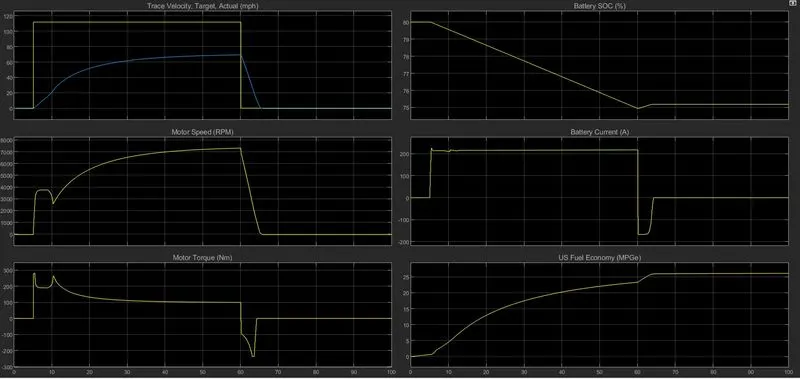
Graph 1: Trace Velocity, Target, Actual
Top Velocity achieved: 69 m/hr
Time Taken to Accelerate: 55 sec
Time taken to decelerate: 5 sec
Graph 2: Motor RPM
Top motor RPM: 7313
Graph 3: Motor Torque
Maximum Motor Torque: 280 Nm
Graph 4: Battery Current
The maximum battery current consumption was observed to be 225 A during acceleration full throttle period and was observed to reduce to -168 A during deceleration period.
Graph 5: Battery SOC
The battery SOC was observed to fall from 80 to 74.9% during the full throttle period and was observed to rise from 74.9 to 75.185 during the deceleration, till the end of the simulation.
Graph 6: US Fuel Economy MPGe
Max fuel economy achieved by the vehicle: 26 MPGe
Comparison Table:
|
EV |
HEV |
|
|
Parameters |
||
|
Grade |
6 |
6 |
|
Wind Velocity |
8 |
8 |
|
Simulation Time |
100 |
100 |
|
Results |
||
|
Top Velocity achieved (m/hr) |
69 |
78 |
|
Maximum Motor Speed (RPM) |
7313 |
9652 |
|
Time Taken to Accelerate |
55 |
50 |
|
Deceleration Time (Sec) |
5 |
3.7 |
|
Motor Torque |
280 |
306.9 |
|
Max Battery Current (A) |
225 |
522.6 |
|
Battery SOC (%) |
80-75% |
80-71% |
|
Fuel Economy MPGe |
26 |
8.135 |
Comparing the results:
- Top velocity achieved was by HEV, whereas time taken to reach top speed by EV was more than compared to HEV.
- Maximum battery current was drawn by HEV compared to EV during acceleration.
- Discharging rate in EV is lower compared to HEV.
- The SOC is higher in EV compared to HEV.
- Motor torque was observed higher in HEV compared to EV.
- Fuel economy of EV was observed higher compared to HEV.
Conclusions:
- The differentiation between mapped and dynamic motor, generator, and engine was done successfully.
- The calculation of fuel economy in miles per gallon and model fuel flow were explained successfully.
- WOT simulation of HEV was carried out successfully and the results were noted and explained.
- The comparison of WOT simulation of EV and HEV was done successfully.