Week-4 Challenge WOT Condition Part-2
HEV WEEK4 CHALLENGE
HEV REFERENCE APPICATION MODEL ANALYZES
MODEL:
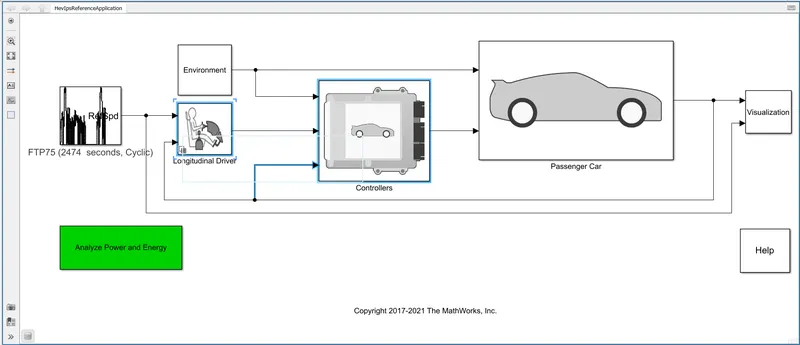
- Open MATLAB and enter the command autoblkHevpsStart
- The below model will open
-
QUESTION1:
DIFFERENCE BETWEEN MAPPED AND DYNAMIC MODEL OF ENGINE,MOTOR AND GENERATOR:
- Opening the Passenger Car block,will get into engine ,motor and generator powertrains
Mapped Engine Block:
- The Mapped engine block is shown below
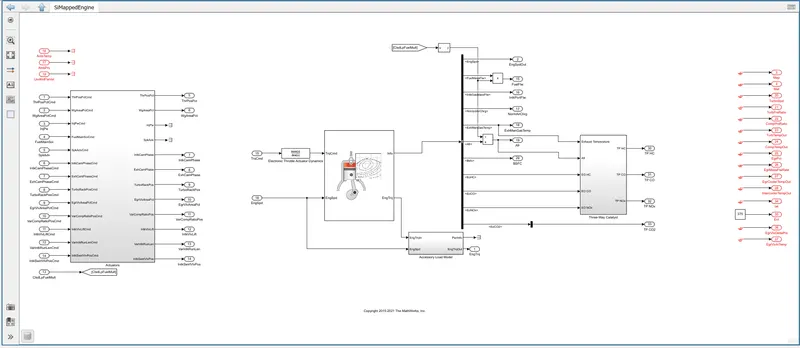
- When you open the mapped engine block ,A dialog box appears as shown below
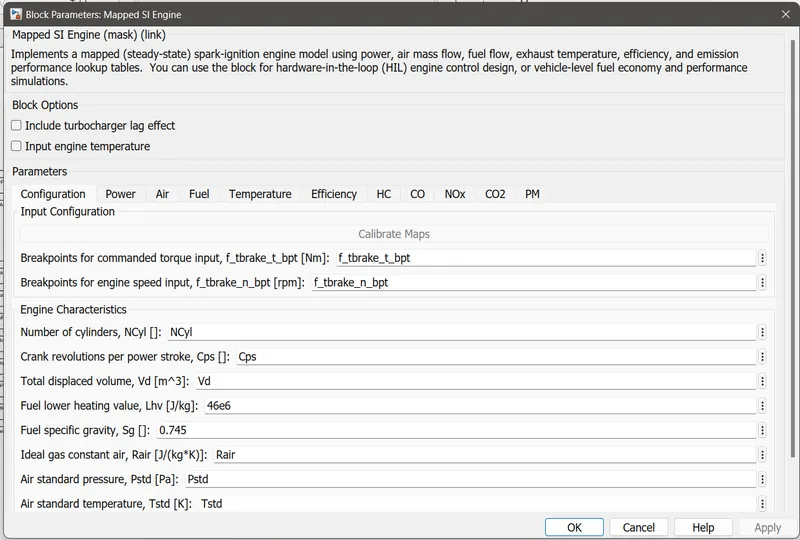
- As mentioned in this dialog box ,it implements the SI mapped engine by input parameters Lookup tables
Dynamic Engine Block:
- The Dynamic engine block is shown below
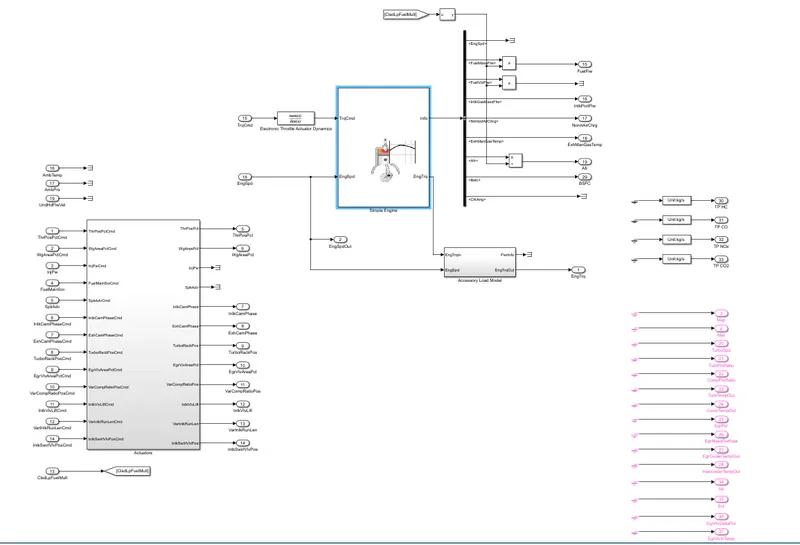
- In this model of dynamic engine ,it implented using torque,speed characteristics.And also the fuel and efficiency.
Mapped Motor block:
- The mapped motor block is shown below
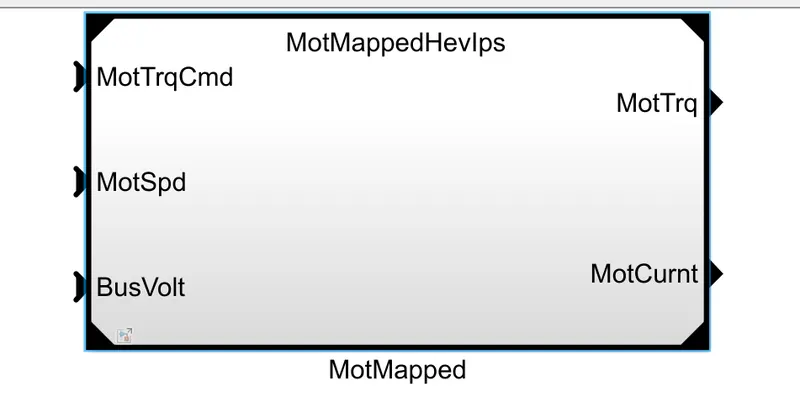
- When you open the block ,The lookup table block will appear
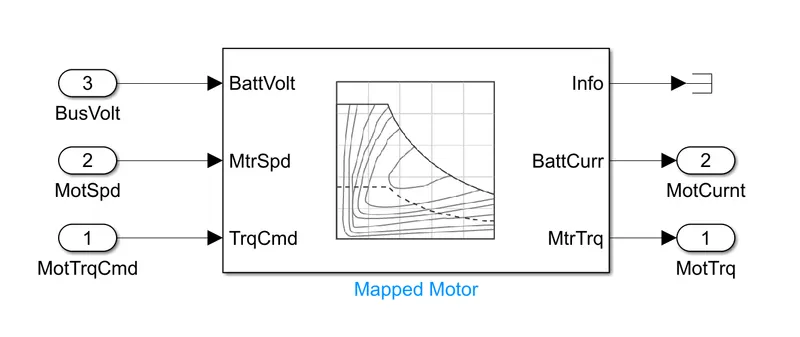
- In this lookup table, we can enter the values of torque,speed and power
Dynamic Motor:
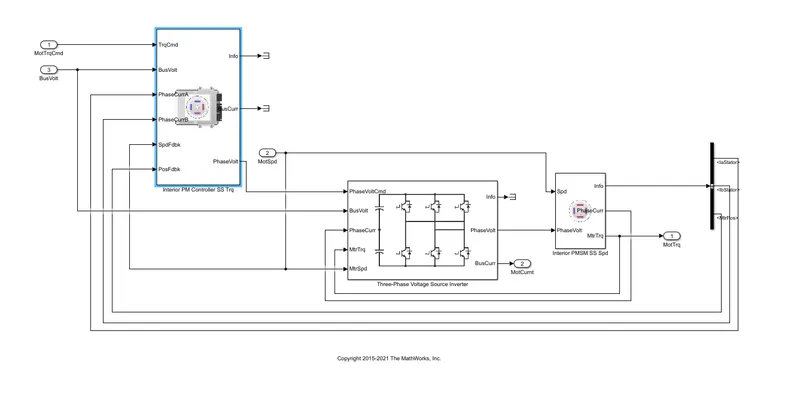
- The dynamic motor designed with including all actual parameters into considering with an optional speed controller
Mapped Generator:
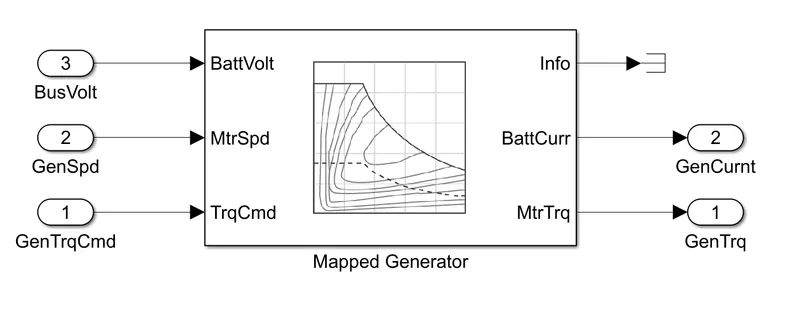
- The mapped generator block is shown below
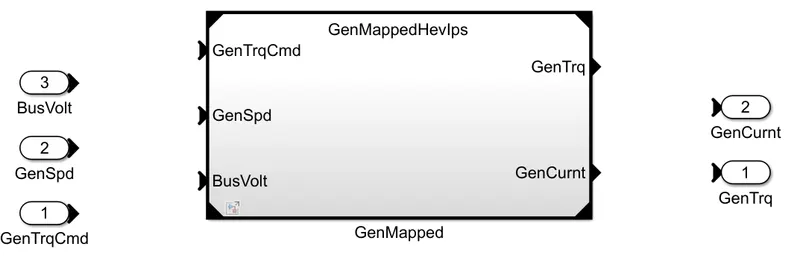
- Opening this block ,get you into the lookup tables of the input parameters of generator
Dynamic Generator:
- Dynamic generator block is shown below
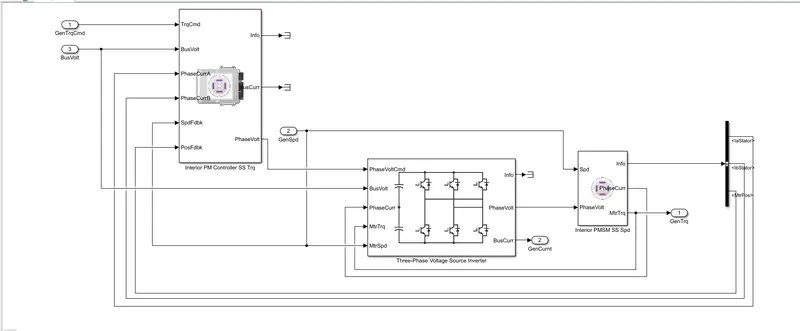
- This block designed using the actual input parameters of a generator
Toggling Between Mapped and Dynamic:
- Go to model settings option and select variant manager option,a dialog box appears as shown below
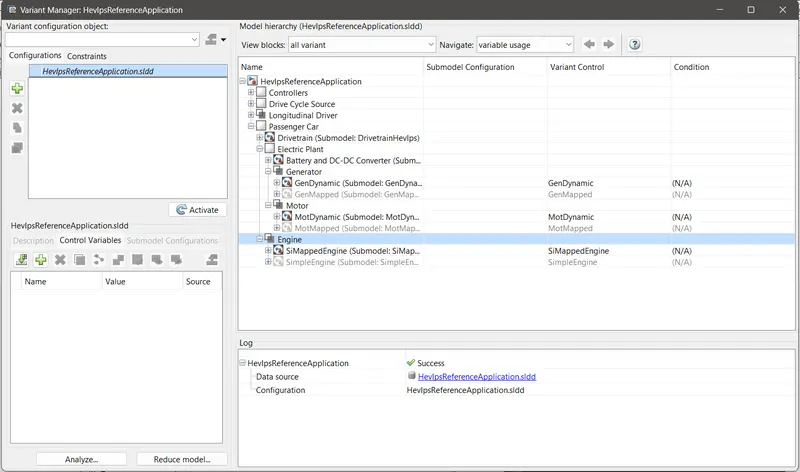
- In this dialog box you can see the tree structure of the components in this model
- We can select the desired block by Right click on it and Set as label mode active choice option
- Or you can directly go to respective model ,right click on the outside area
- And selecting variant ->Label mode active choice->and select the desired one
CONCLUSION:
- By analyzing the mapped and dynamic blocks of engine,motor and generator,its concluded that
- Mapped Blocks:As shown in the above images ,its clear that Mapped model implemented using the lookup table of input parameters of the system.So the execution will be faster,because accessing time of the records is lesser than the blocks .
- Dynamic Blocks: As shown in the above analyses ,its clear that the dynamic model uses actual components that represents the system.As the accessing time of the block is high ,the execution will be slower compared to mapped model.
QUESTION2:
CALCULATION OF MILES PER GALLON IN THE MODEL:
- Miles per gallon(MPG) is defined as ,the distance a car can travel in miles with one gallon of fuel
- The gallon is a unit of volume in imperial units
- In a hybrid Vehice model ,battery power also considered along with the fuel in the calculation of miles per gallon
- Under Visualization subsystem,we can find performance calculation block
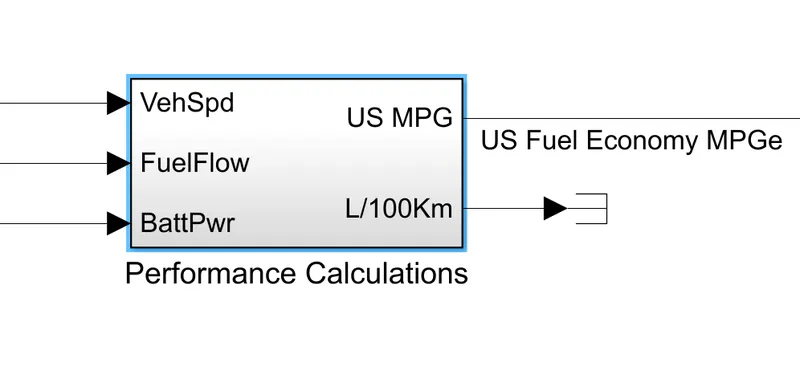
- Opening this block will get you into another blocksets ,where the calculation made
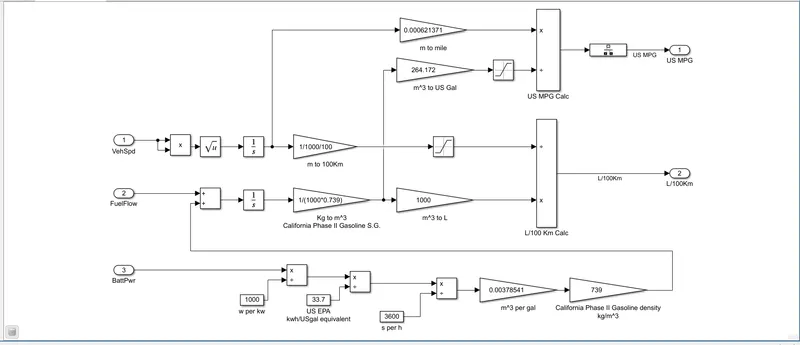
- As we considering Hybrid vehicle,the miler per gallon calculaion carried out by battery power
- The battery power input in watts converted to kilo watts
- Then the kilowatt power converted to the equivalent gallon/second value by dividing it by 33.7
- Then it converted to gallon /hour value
- This value multiplied by a gain to obtain m^3/gallon value
- And converting the m^3/gallon value to the m^3 US equivalent value
- The distance car travelled is converted to miles
- Dividing the distance in miles by the Gallon value will get you the MPG value
CONCLUSION:
- The calculation method of miles per gallon is discussed
- From the block diagram its concluded that ,to design the Fuel flow in the system, vehicle speed and battery power is considerd
QUESTION3:
HEV REFERENCE APPLICATION ANALYZES WITH WOT DRIVE CYCLE:
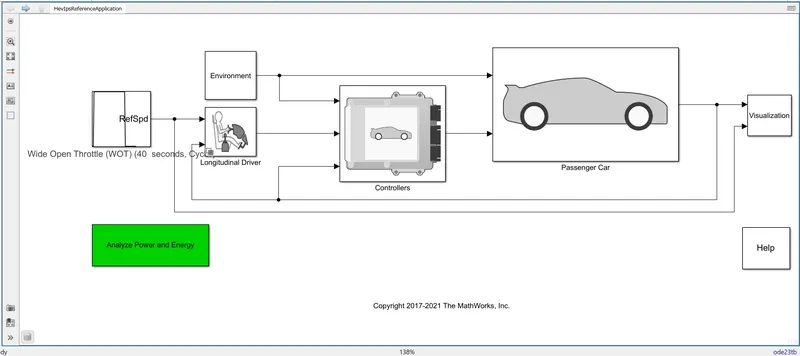
- The hybrid car model analysing using a WOT drive cycle,for that drive cycle block is changed to WOT drive cycle
- Wide Open Throttle (WOT) is a conditon where you fully accelerate to reach the maximum speed of the engine/motor
- The hybrid reference model with WOT driving cycle is shown below
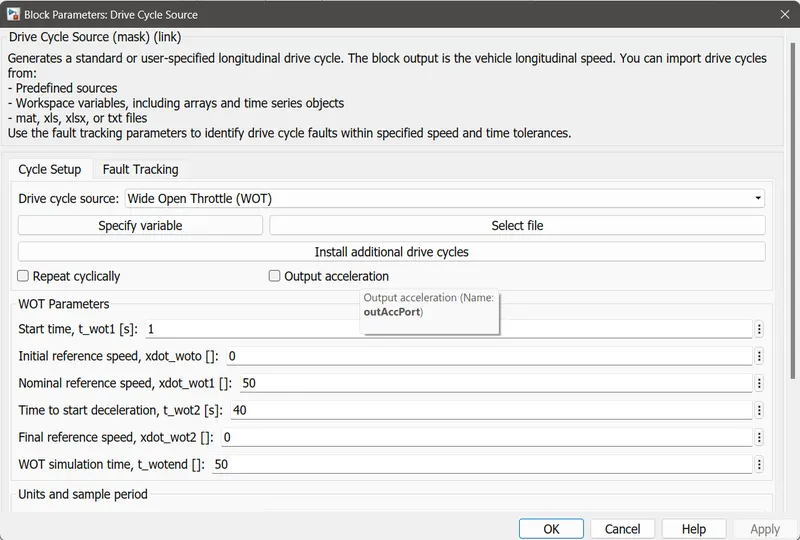
- The WOT drive cycle parameters values assigned as shown below
- Running the model
RESULTS:
- The results of the hybrid model subjected to a WOT driving cycle is shown below
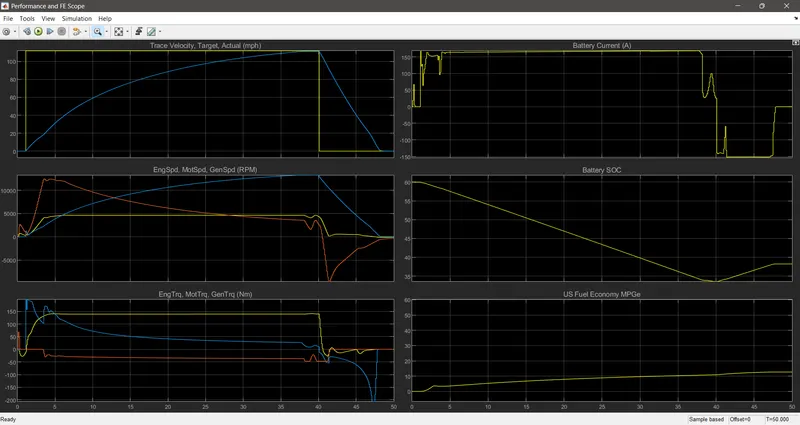
- Graph1: It represents the WOT driving cycle and the actual vehicle accelration,its clear that the actual acceleration taking more time to reach the targeted values
- Graph2:It represents the speed of engine ,motor ,generator with respect to the given WOT condition.
- Graph3: It represents torque values of engine ,motor and genertor for this WOT drive cycle
- Graph4: It reprents the Battery current,battery current is reach the maximum level to provide rquired to power to the motor,and its keeps provoding the power during the acceleration.The batterry current when below zero (lower level)when decceleration happens.And we can see a change in the battery current due to regenerative braking action.
- Graph5:It represents the state of charge of the battery.Its clear that there is steady decreasing in the SOC because of the acceleration.During decceleration,the SOC almost flat and again increasing due to regenerative braking action
- Graph6:It represents the fuel economy(Miles per gallon ) of the hybrid vehicle in this WOT drive condition
Changing Grade and Wind Velocity and Analysing the Same Results:
- Under environment block we can change the values of grade and wind velocity
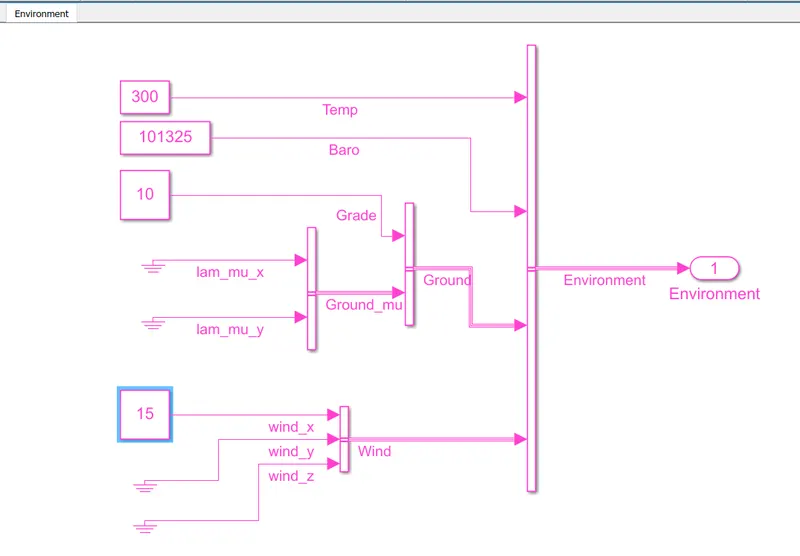
- After updating the value ,the results of the hybrid electric vehicle with WOT condition is shown below
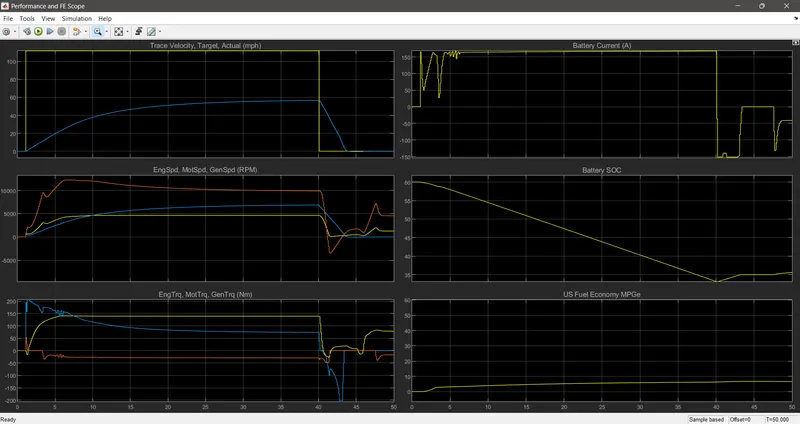
CONCLUSION:
- In the first condition,when grade and wind velocity is 0,the vehicle gradually accelerated to attain the targeted speed
- From the above the graph ,because the vehice have a hill climbing and wind velocity condition,it couldn't reach the targeted speed in WOT condition.Its travels in a much lesser speed.But the torque increased during hill climbing condition.
QUESTION4:
COMPARISON OF HYBRID AND PURE ELECTRIC POWERTRAINS:
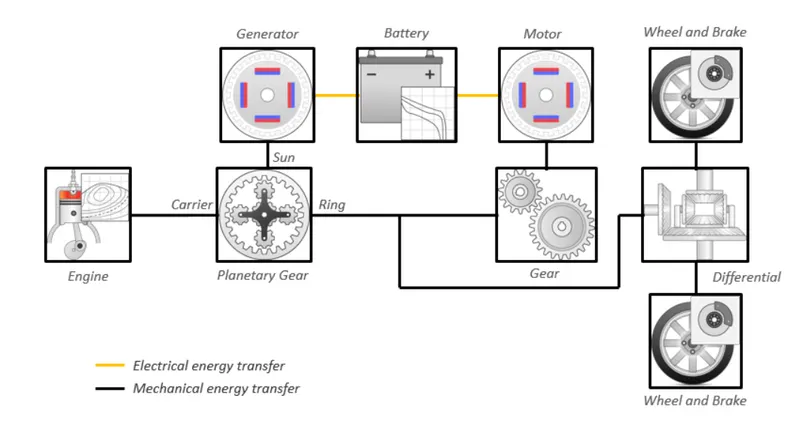
HEV POWERTRAIN DIAGRAM:
- The hybrid reference model powertrain diagram is shown below
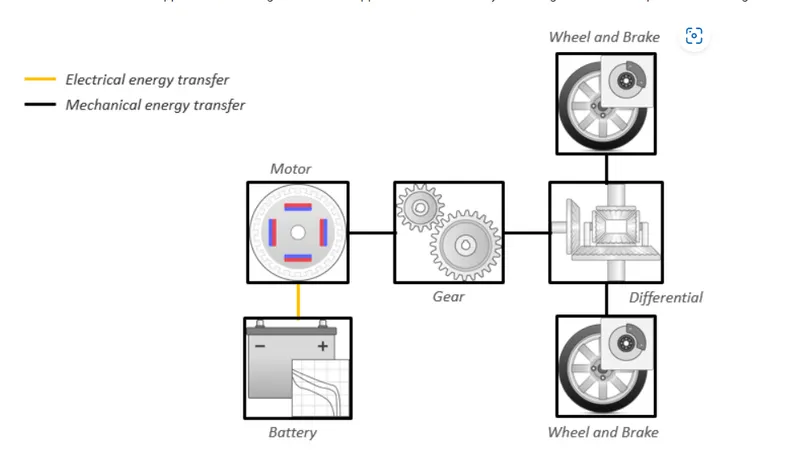
EV POWERTRAIN DIAGRAM:
- The powertrain configuration of a elctric vehicle is shown below
MODEL:
- The EV reference model used for this comparison is shown below
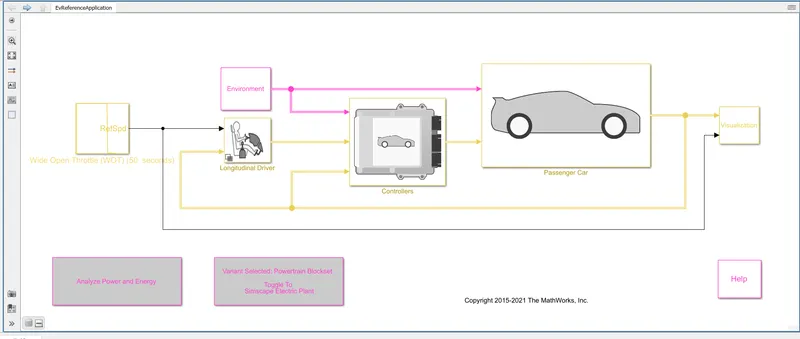
- Running the model of pure electric vehicle in the same WOT condition
RESULT:
- The results of a electric vehicle model is shown below
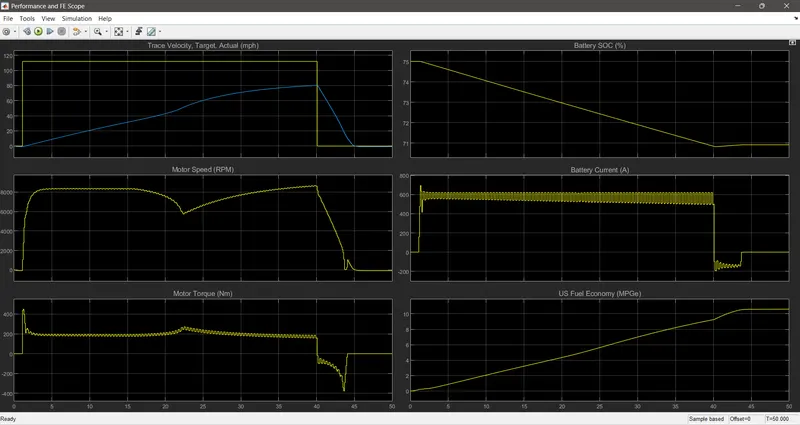
- Graph1: It represents the WOT driving cycle and the actual vehicle accelration
- Graph2:It represents the speed of motor with respect to the given WOT condition.
- Graph3: It represents torque of motor for this WOT drive cycle
- Graph4:It represents the state of charge of the battery.Its clear that there is steady decreasing in the SOC because of the acceleration.During decceleration,the SOC almost flat and again increasing due to regenerative braking action
- Graph5: It reprents the Battery current,battery current is reach the maximum level to provide rquired to power to the motor,and its keeps provoding the power during the acceleration.The batterry current when below zero (lower level)when decceleration happens.And we can see a change in the battery current due to regenerative braking action.
- Graph6:It represents the equivalent fuel economy(Miles per gallon ) of the electric vehicle in this WOT drive condition
CONCLUSION:
- By comparing hybrid and electric vehicle its concluded that
- For the given WOT drive cycle ,considering hill climbing and wind velocity.
- The electric vehicle achieved more speed compared to the hybrid vehicle
- But the battery current is high compared to hybrid because thats only source provides to EV
- In hybrid vehicle with presence of engine and generator ,the battery gets charged by a generator and feeding the required power to electric motor
- In pure electric vehicle ,the battery gets charged externally and also when the regenerative braking happens.
- In the State of charge graph,its shown the EV uses less battery power to achieve the same condition,where in the Hybrid model,there is a steady decrease in the battery power.
- From above analyzes ,EV provides more efficient performance than the Hybrid vehicle