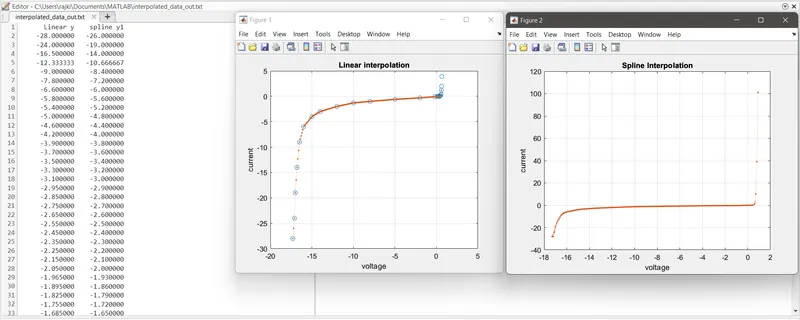
Project - Data Handling and Interpolation
MATLAB PROJECT
MATLAB CODE
%Generating a plot for interpolated data
vi=xlsread('VI.xlsx');%calling the excel file VI using xlsread function
v=vi(:,1);%assigning first column of excel file to v variable
i=vi(:,2);%assigning second column of excel file to i variable
x=[-17.3:0.1:0.9];%specifying given range to perform interpolation
y=interp1(v,i,x,'linear');%performing linear interpolation for the given data
y1=interp1(v,i,x,'spline');%performing spline interpolation for the given data
figure(1);%creating a figure 1
plot(v,i,'o',x,y,':.');%plotting the linear interpolated data
grid;%laying out the grid on plot
xlabel('voltage');ylabel('current');%labeling the axis
title('Linear interpolation');%title of the plot
figure(2);%creating a figure2
plot(v,i,'r',x,y1,':.');%ploting the spline intepolated data
grid;%laying out the grid on plot
xlabel('voltage');ylabel('current');%labeling the axis
title('Spline Interpolation');%title of the plot
fid=fopen('interpolated_data_out.txt','w');%creating a text file to store the interpolated data
X=[y y1];%arranging the data in matrix X
fprintf(fid,'%12s %12srn','Linear y','spline y1');%printing the header text
fprintf(fid,'%12f %12frn',X);%printing the the interpolated data on the text file
fclose(fid);%closing the file
ANSWER