Week-4 Challenge WOT Condition Part-2
1. Mapped and Dynamic model of Engine, Motor and Generator
Mapped Model
- The mapped model runs on data from the lookup table (it runs quicker) (Give available input).
- Simulating a mapped model requires less time.
- Because it does not involve real-time outputs from the subsystems, mapped model simulation is also known as static model simulation.
Dynamic Model
- The dynamic model is chosen to run the simulation with the actual model.
- The real component is represented by the dynamic model.
- Because it takes into account all subsystems, the accuracy of this model is higher than that of the mapped model simulation.
- The dynamic model simulation takes longer to run than the mapped model simulation.
Changing Model Type
HEV Reference model is opened as an example as shown in below to show the change of model type. In the below shown image, in the subsystem-Engine, Si Mapped Engine is highlighted.

Open Variant Manager from Design of Simulink Model as shown below.

Si Mapped Engine is active right now. Right click on other subsystem. For example Ci Mapped Engine. Then click on "Set as Label Mode Active Choice".

In the below subsystem of Engine we can see that Ci Mapped Engine is higlighted right now.

2. Miles per Gallon
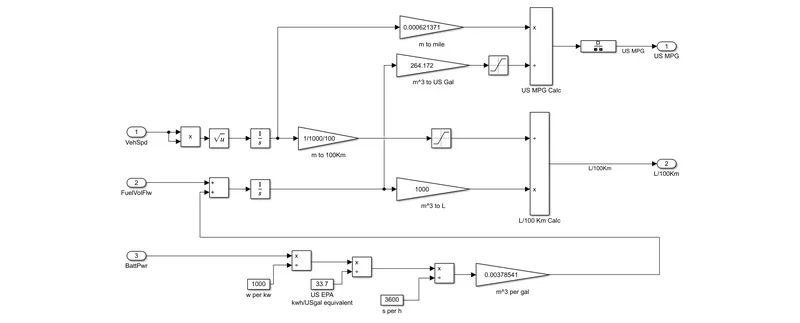
Miles per gallon for HEV is calculated using the below shown subsystem. The input parameters are Vehicle speed, Fuel Flow rate and Battery Power. Mileage is calculated computing the amount of fuel consumed and the battery power used for a particular km of riding. Battery power is converted to equivalent fuel in gallon.
Calculating Distance
- Vehicle speed on each point of time is integrated together for a period of time or till the journey ends. Square of the speed is taken and its squareroot is calculated. This is similar to the modulus function in order to provide positive values only. This might be done make reverse speed or distance.
- Integrating speed in m/s to a period of time will get the distance covered in metres.
- Distance in meter is converted to miles by multiplying with 0.000621371 (1m = 0.000621371miles)
Calculating fuel used for covering distance
- Battery power supplied in each point of time is converted to equivalent of gasoline in cubic meters.
- Battery power in watts converted to kilowatts by dividing it with 1000.
- Battery power in kW is converted to kWh by dividing it with 3600 (1hr = 3600 seconds)
- Battery energy delivered in kWh is converted to equivalent of USgallon by dividing it with 33.7 (1 gallon of gasoline = 33.7kWh of electricity)
- Gallon is converted to cubic meters by multiplying it with 0.003785 (1 gallon = 0.003785 m^3)
- Gasoline in cubic meters is added with battery power equivalent to Gasoline in cubic meters.
- Value in cubic meter is converted to gallon by multiplying it with 264.17 (1 gallon = 264.17 cubic meters)
Calculating Miles per Gallon
- Distance covered in miles is divided with fuel supplied (Gasoline and Battery power equivalent to Gasoline in cubic meters) to get miles per US Gallon.
3. HEV Reference Application with WOT drive cycle, gradeability and wind speed
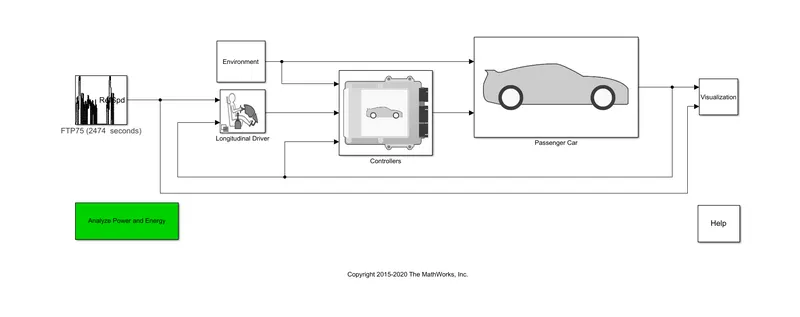
HEV Multimode Reference Application Model Opened as shown below
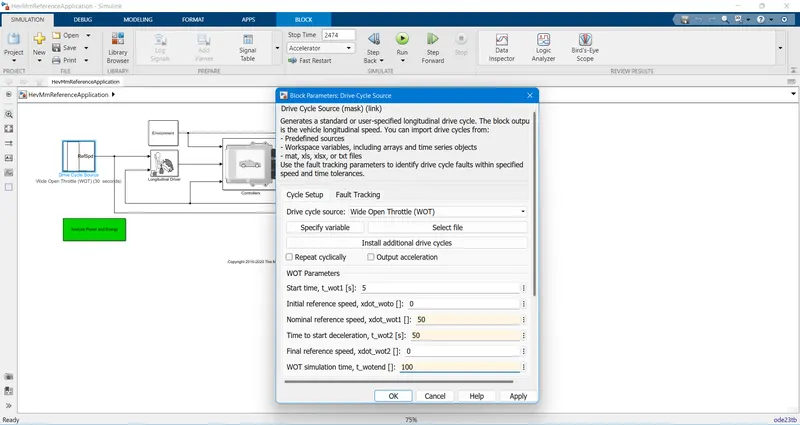
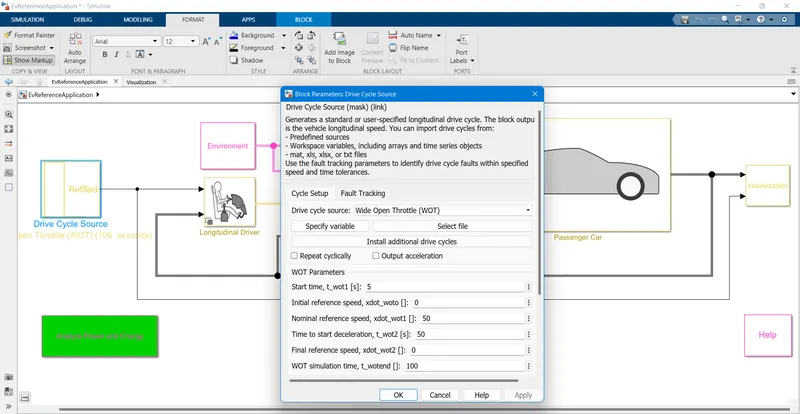
Drive Cycle changed to Wide Open Throttle as Shown Below
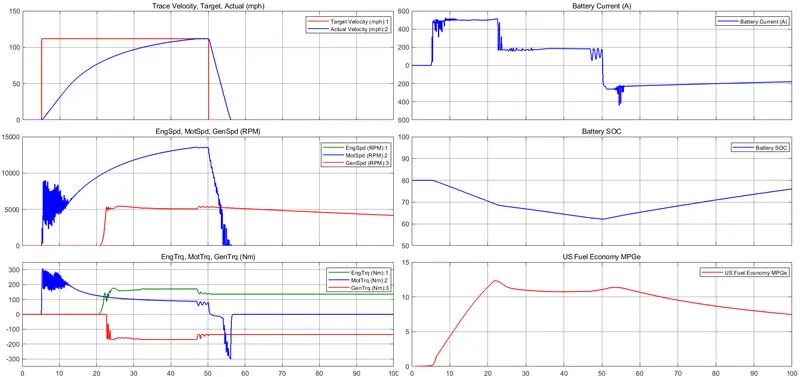
- Time changed to 100 seconds and Run the simulation. Result obtained is shown below.
- Acceleration starts at 5 second and deceleration after 50 seconds.
- During the initial acceleration, motor power is used. Battery current is high. Thus, State of Charge decreases from 80% to 62% till 50 seconds
- After 50 seconds, Regeneration happens. Battery current changes to negative and Battery SoC increased from 62% to 75%.
- In the Environment Subsystem, Grade changed to 10 and Wind speed changed to 5 as shown below
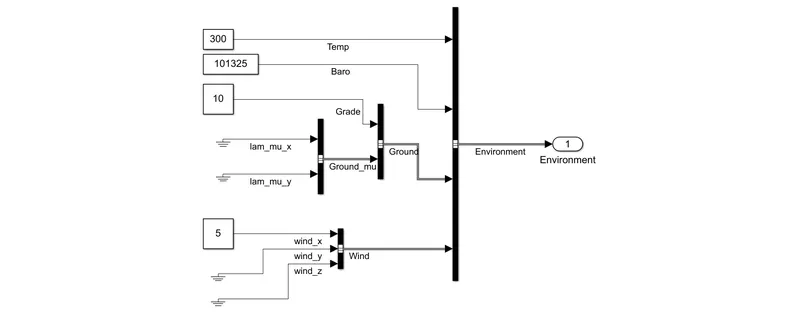
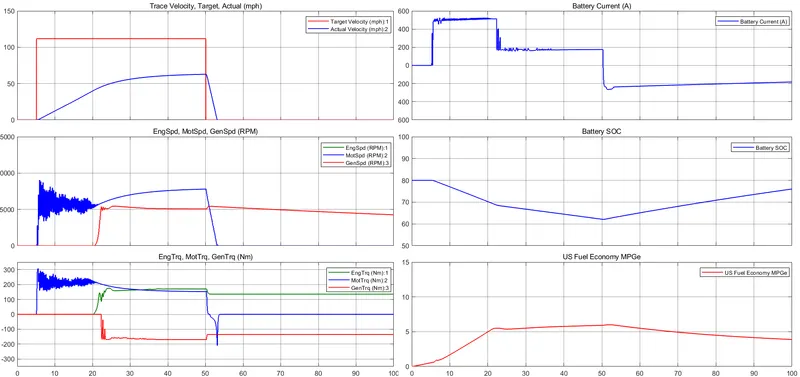
- Time was already set to 100 seconds and run the simulation. Result obtained is shown below.
- Performance is almost similar. Since, there is a resistance because of gradeability and wind speed, more motor power required and the speed of car as well as the motor rpm reduced.
- Top speed reduced from 110mph to 60mph.
- Miles per gallon reuced from 12 to 5.
4. Hybrid and Pure electric powertrains
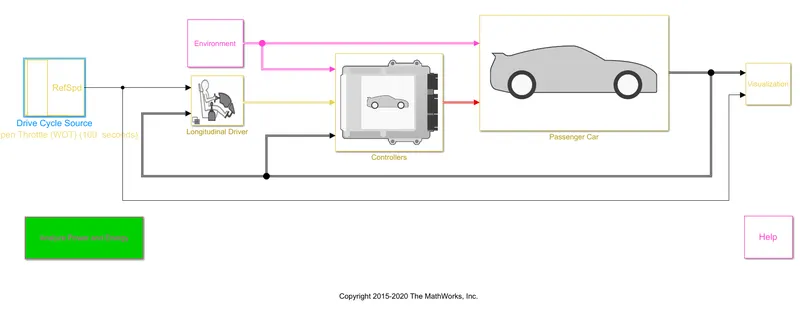
WOT drive cycle, windspeed as 5 and Grade as 10 set to an EV Reference application model as shown below.
Result obtained from simulation of Pure EV is shown below.
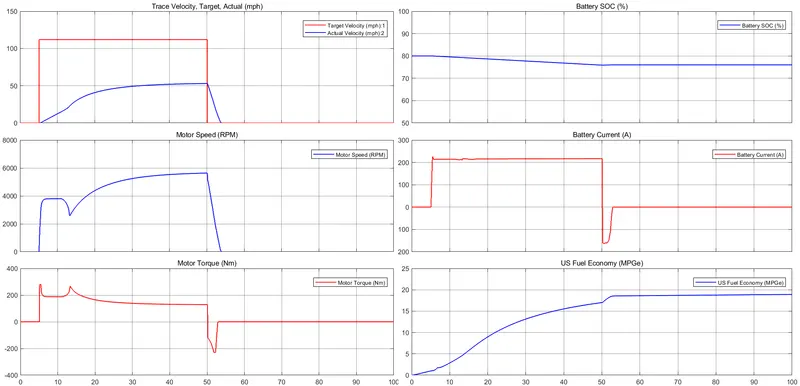
When compared to HEV,
- Speed of the vehicle is almost similar
- Motor rpm as well as Motor Torque is reduced since the weight of EV might be less than HEV
- Only small change in Battery SoC from 80% to 76% since the battery capacity is higher in pure EV than HEV
- Battery current is also less since the battery bank voltage will be higher in EV compared to HEV
- Fuel economy in EV is 18 which is higher than HEV having 5.