Week - 4
1. Control Logic of a “Washing Machine”
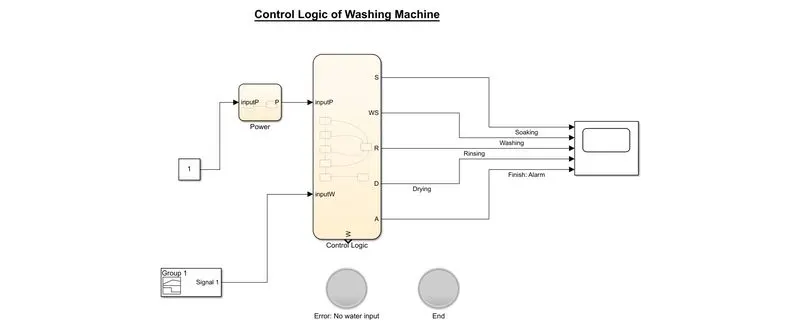
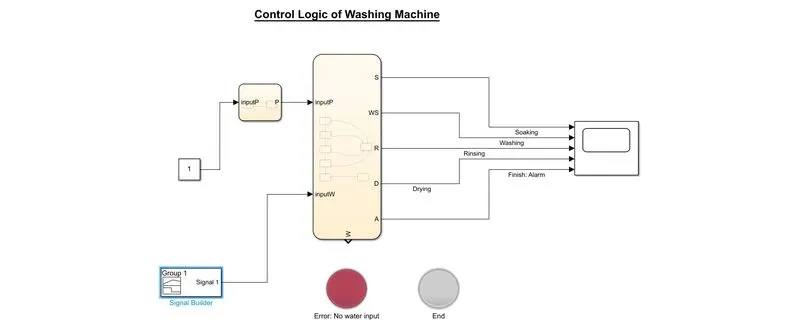
- The control of the washing machine will be activated only if there is power.
- For that, a separate chart for power and another chart for control is modelled as shown below
 .
.
- If the output of Power chart is high, then only Control Logic chart will be executed.
- Constant value given to Power Chart. '0' indicates no power '1' means there is power.
- Control Logic of the washing is modelled as per the control logic chart shown below.
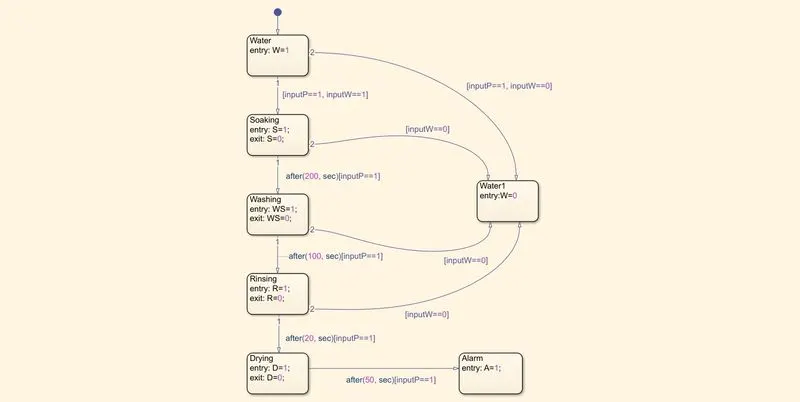
- In order to start washing process, power input as well as water to be feeded.
- Water input is given as signal from signal builder.
- If there is power input and water, Soaking will start. It will continue for 200 seconds (S=1 during this time). After 200 seconds, soaking will be stopped (S=0) and starts Washing.
- Washing will continue for 100 seconds (D=1). After 100 seconds, Washing will be stopped (D=0) and Rinsing will start.
- Rinsing will continue for 20 seconds (R=1). After 20 seconds, Rinsing will be stopped (R=0) and Drying will start.
- Drying will continue for 50 seconds (D=1). After 50 seconds, Drying will be stopped (D=0) and the process finished with alarm signal/ light (A=1).
- During Soaking, Washing and Rinsing, if there is no water output (W=0), then the process will stop with RED LED light.
- With power input and water entire process for a period of 450 seconds simulated is shown below.
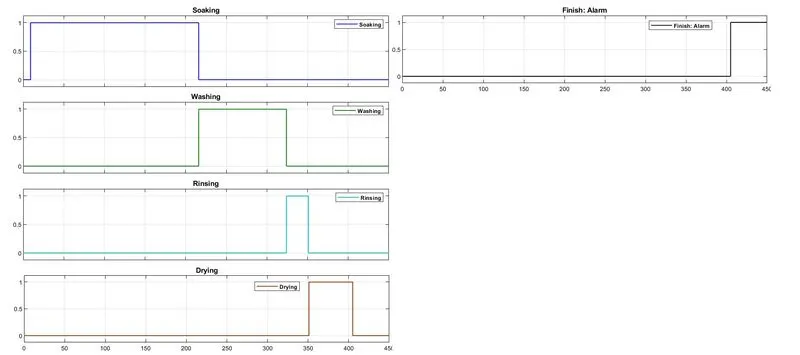
- Soaking started at 5th second.
- After 200seconds, soaking ends and Washing started
- Thereafter 100 seconds washing ends and Rinsing started
- Thereafter 20seconds Rinsing ends and Drying started
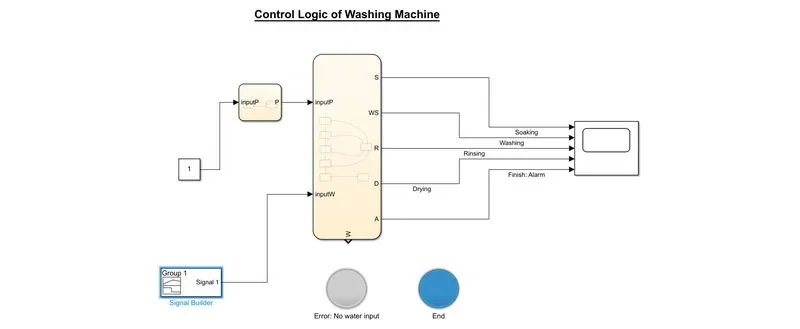
- Thereafter Drying ends, the process ends with alarm signal which lit the blue LED indicating the process finished as shown below.
Stop supply of water
- If there is no water available, process stops and LED indicates red light.
- For simulating the condition of water stops while processing; the foloowing condition used
- Water input stops at 325sec. Signal of water input is shown below.
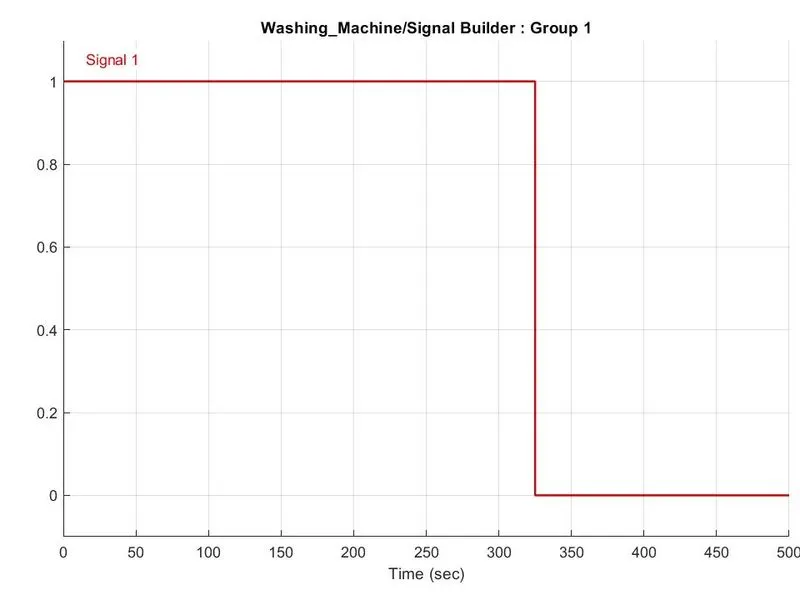
- There is no water input at 325sec. W=0 and RED LED will lit during this condition.
- At 325 sec, process stopped during rinsing as shown below.
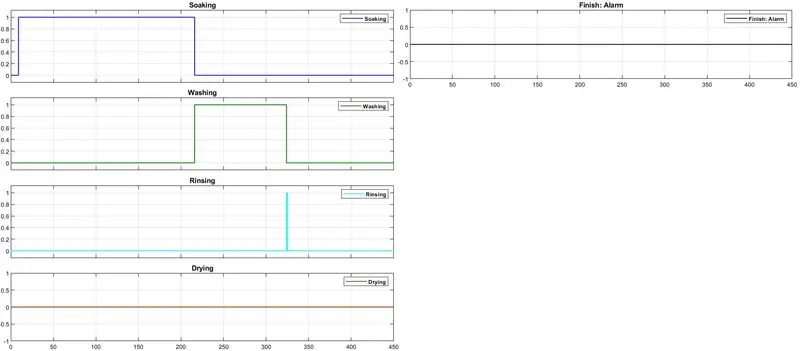
- It can be seen from graphs that Rinsing and Drying not completed.
- Saoking & Washing completed and when rinsing started, water stopped and the process stopped with LED indication as shown below.
2. “Gear Shift” logic
- For creating the stateflow of Gear Shift, assuming that the engine is ON.
- Hence, speed is given as input to the logic chart.
- The process executed simply with the speed of vehicle.
- The below model is created as the stateflow of gear shift
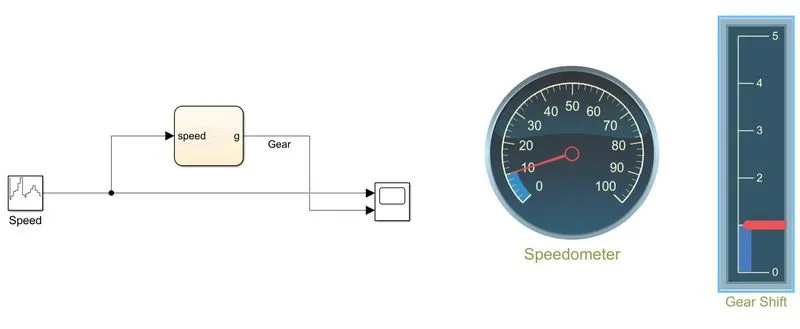
- Speed input is given using random signal source with speed as [10 22 38 42 70 90 28 20 29 36 48 62 45 36 23] for a period of 150 seconds.
- Speed changes during every 10 seconds.
- The control logic for gear shifting is shown below.
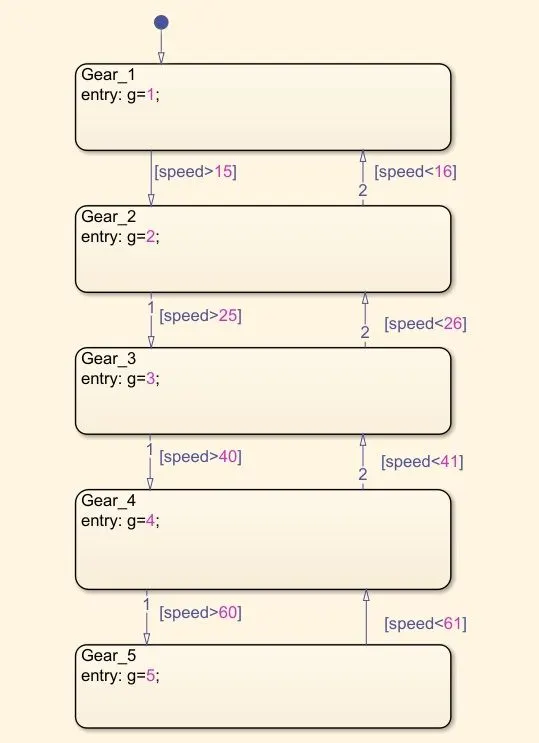
- 'g' is the output of chart indicating gear.
- When the speed is greater than 0 and less than 16, g=1 (1st gear).
- When the speed is greater than 15 and less than 26, g=2 (2nd gear).
- When the speed is greater than 25 and less than 41, g=3 (3rd gear).
- When the speed is greater than 40 and less than 61, g=4 (4th gear).
- When the speed is greater than 60, g=5 (5th gear).
- Here there are 5 levels of states. Each represents each gear.
- During simulation, speed indicates using a round gauge and gear shift/ gear number indicates using a vertical gauge.
- The simulated result of gear shifting is shown below.
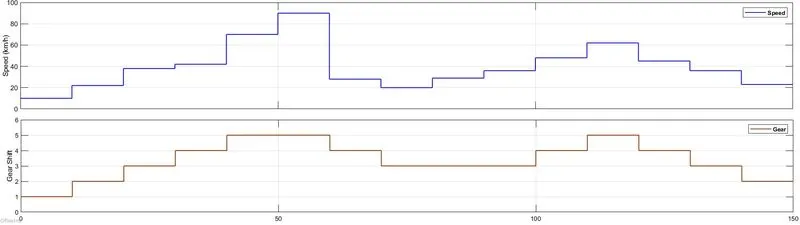
- First plot indicates the speed and second plot shows the gear position.
- Gear up and down will only be in steps.