Week-4 Challenge WOT Condition Part-2
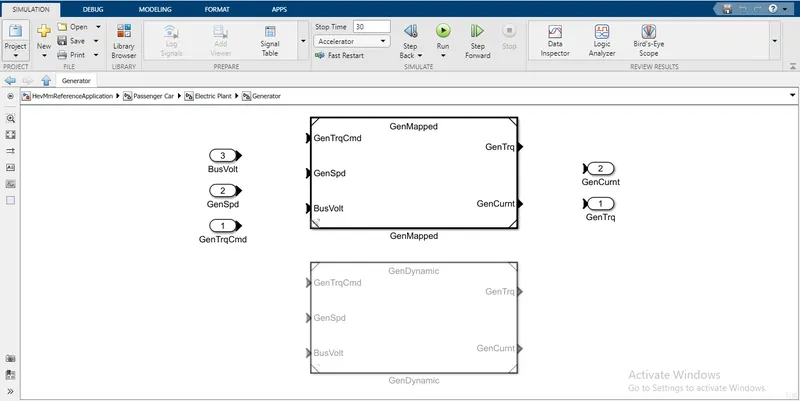
1.Difference between mapped and dynamic system:
Dynamic :
- It represents the actual model.
- It generates the data by itself and can run the it.
Mapped :
- Input datas should be feeded for mapping.
- Run based on data even in the lookup table.
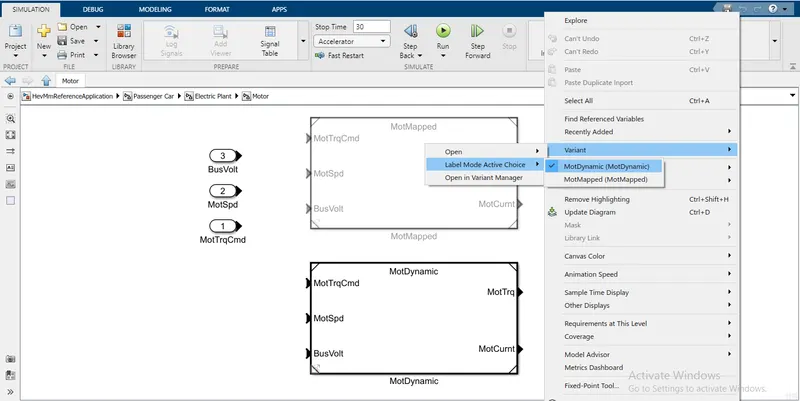
FOR EV
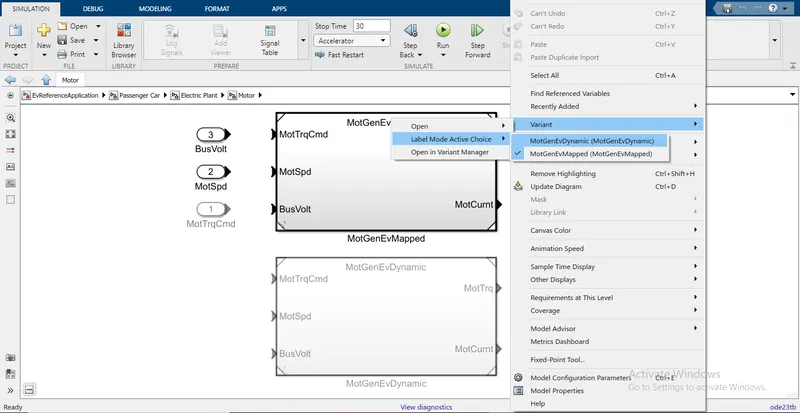
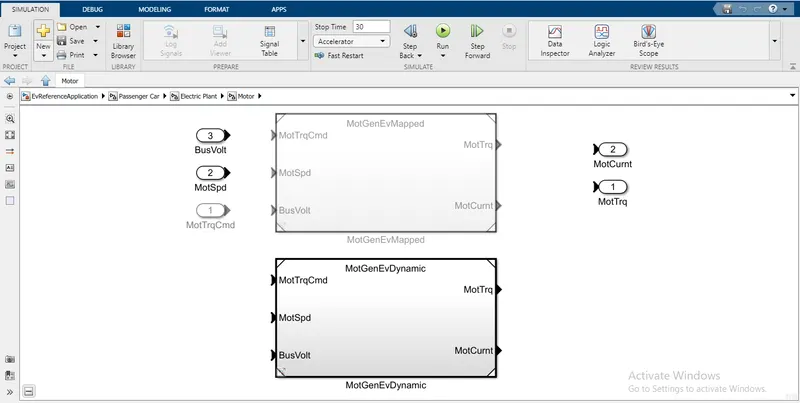
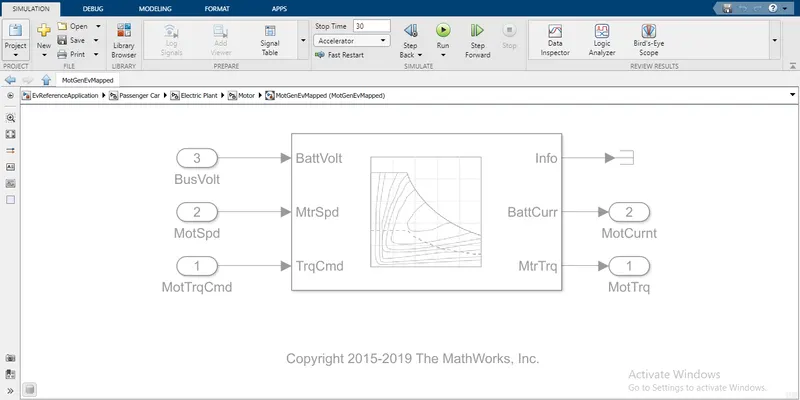
- Input datas should be feeded for mapping.
- Electrical torque range should be specified in motor torque or motor command.
- Battery current is get connected with the motor current.
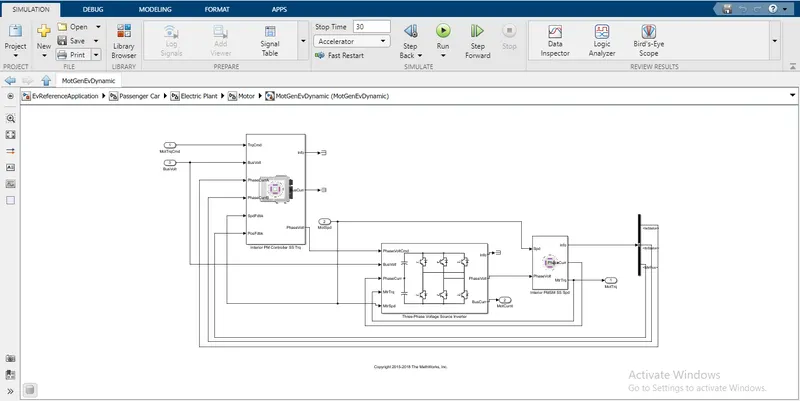
- It represents the actual model.
- It generates the data by itself and can run the it.
- Interior PM Controller SS Trq is fixed in motgen dynamic.
- Three-Phase Voltage Source Inverte is fixed in the dynamic to generate natural voltage command for balanced three-phasew load.
- Interior PMSM SS Spd is fixed in the dynamic,to model the sinusoidal back emf in three-Phase Voltage Source.
FOR HEV
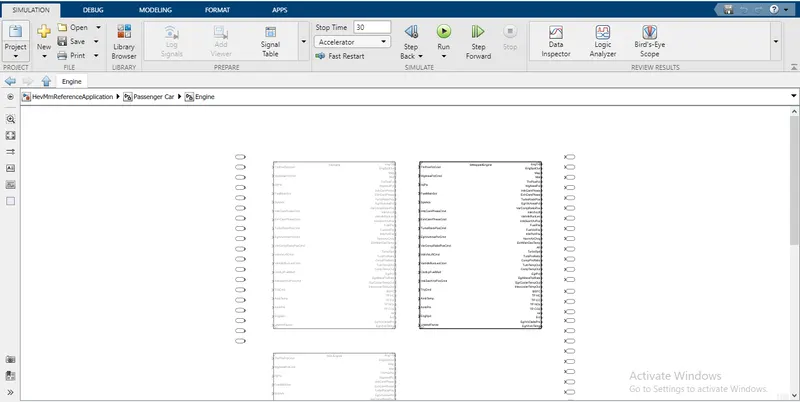
SI & CI engine of HEV:
2.Model calculate of Miles Per Gallon:
- Visualization:
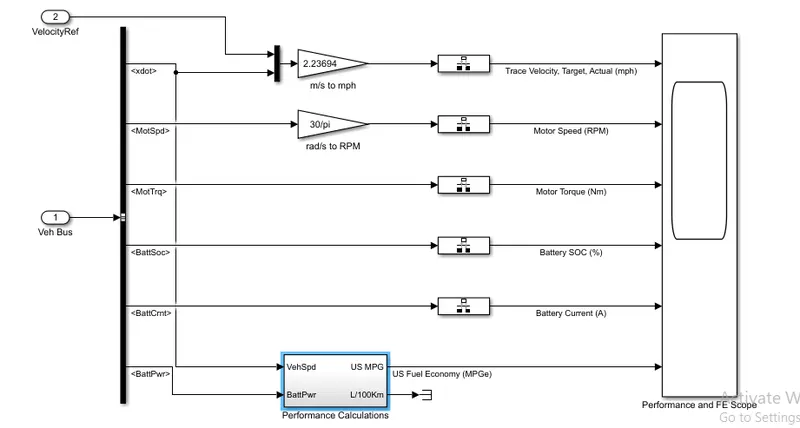
- Performance calculation:
- EV
- HEV
WORKING PRINCIPLE:
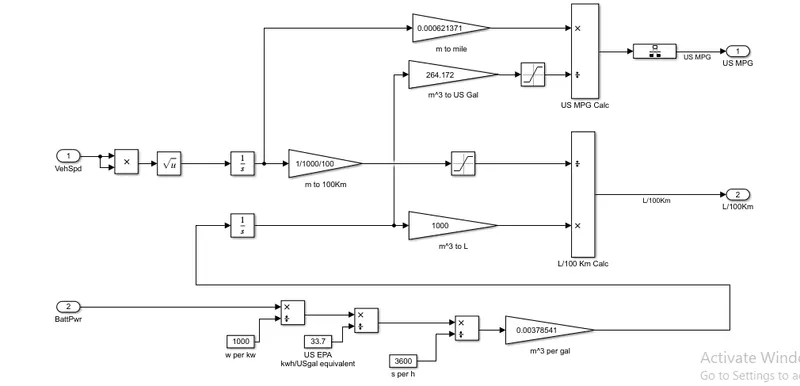
- In miles per gallon the are two inputs ,which is vehicle speed and battery power.
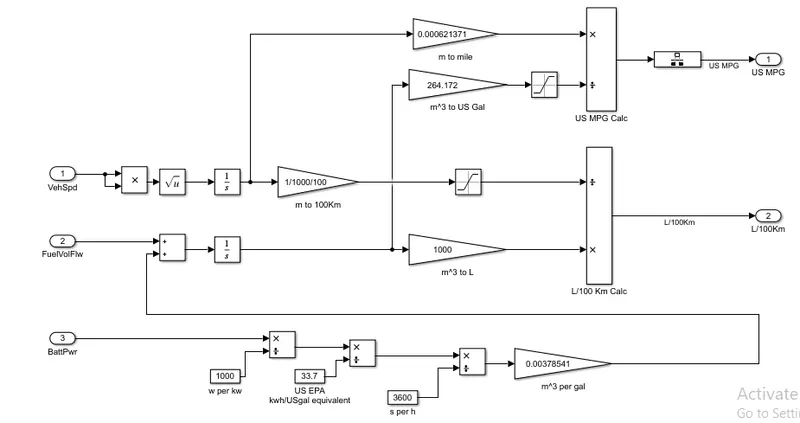
- Vehicle spped is taken square root and it is integrated and we can assume the value as the displacement.
- The battery power is divided by 1000 which is W per KW.
- KW power is divided by 33.7 kilowatt hours of electricity is equivalent to one gallon of gasoline (kwh/USgal equivalent).
- Gallon value is divided by 3600 which converts s per h.
- The value is converted ta m^3 per gal which the gal is converted to cubic meter.
- Now the cubic value is integrated and we can assume it as velocity.
- Vehicle speed is integrated and it is converted by m to 100km by 1/1000/100.
- Integrated value of vehicle speed is converted by m to miles by 0.000621371.
- Battery power which is integrated is converted by m^3 to L by 1000.
- Again integrated battery power is converted by m^3 to USgal by 264.172.
- Value which is converted by m^3 to USgal is saturated by the saturation block.
- Value which is converted by m to 100km is also saturated by saturation block.
- M to mile is divided by the saturation and we get the final output of USgal.
- m^3 to L is divided by saturation and we get the final output of L/100km.
- In HEV fuel flow block is added with gallon and integrated.
3.Run the HEV ReferenceApplication with WOT drive cycle. Change the grade and wind velocity in the environment block. Comment on the results.
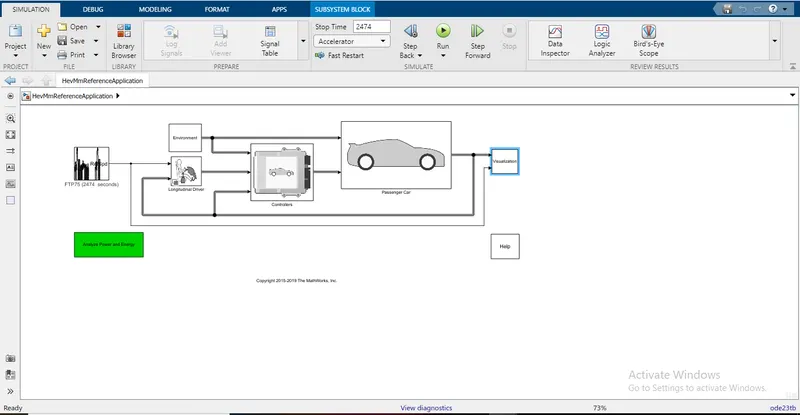
HEV application with default parameters.
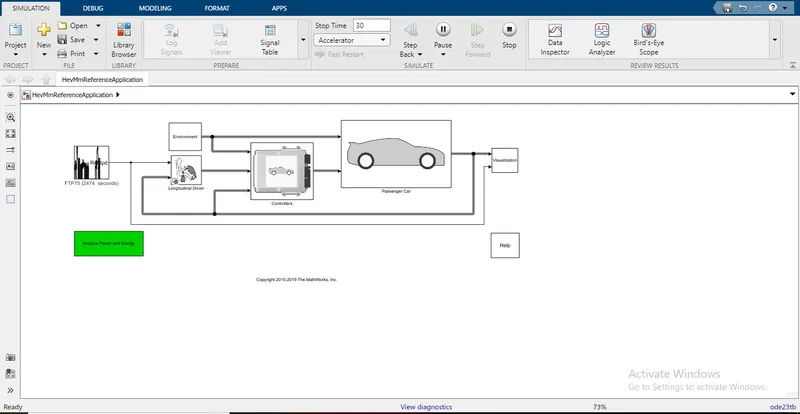
- Block diagram of Hybrid Electric Vehicle (HEV)
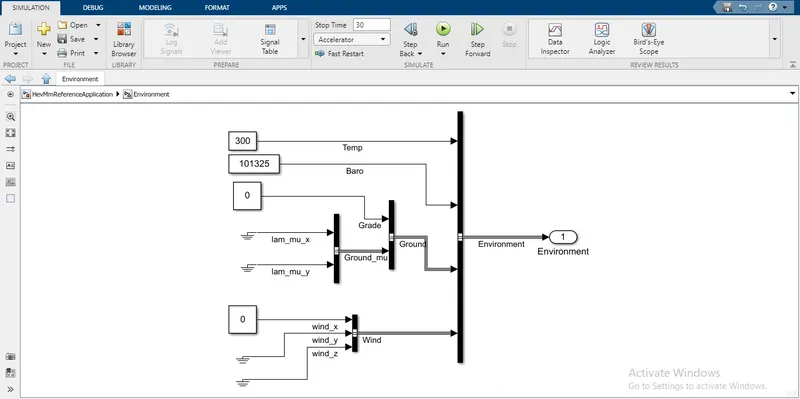
Environment block without changing Gradeability & Wind velocity:
Graph:
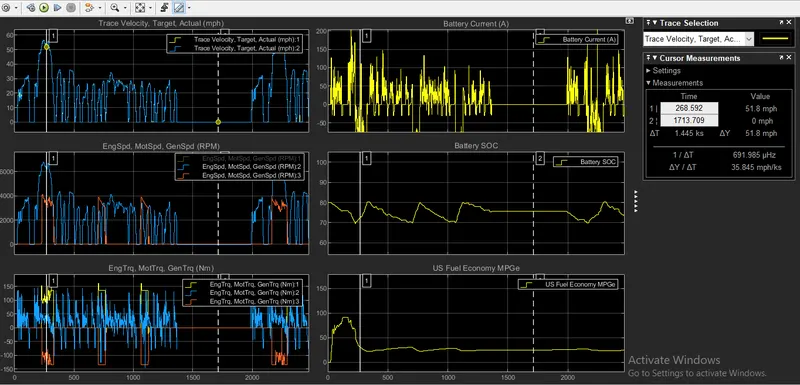
- At initial stage velocity is at 0 stage and it increases by its velocity in the drive cycle.
- The start point is at 0 and it raise to the value till 33 and again it comes to its initial stage and remains constant for some time.
- Again it starts to raise and reaches the high value of 65 then again it reaches the initial stage,this cycle is repeating again and again,so it ends at the final time second.
- Now the second graph represents the speed.
- There are 2 sine waves which is RPM 2 & RPM 3.
- Rpm is at 0 in the initial condition,then it reaches around 4000 rpm & it remains contant for some time and again it reaches the around 7000rpm.
- This cycle is repeating till the end of the stpe time.
- Third graph represents the torque of the vehicle.
- There 3 sine waves ,they are Trq 1,Trq 2 &Trq 3.
- Trq 1 rise the wave form around 125 from its initial condition and also it goes to the negative form till -150.
- Trq 2 raises the wave form around 170 from its initial condition and there is no negative form.
- And in trq 3 there is no positive wave form and the wave drops down around -140 and the cycle continues.
- Next graph represents the battery power.
- Battery power varies by the vehicle power were the wave form reaches upto 200 and reaches the negative value of -50.
- Next graph represents the Battery SOC.
- State of charge increase and decrease with in the 70 to 80.
- Next graph represents the Fuel economy MPG.
- Fuel economy raises upto 90 miles.
- Changing the Drive cycle,Gradeability & Wind veloicity in HEV application:
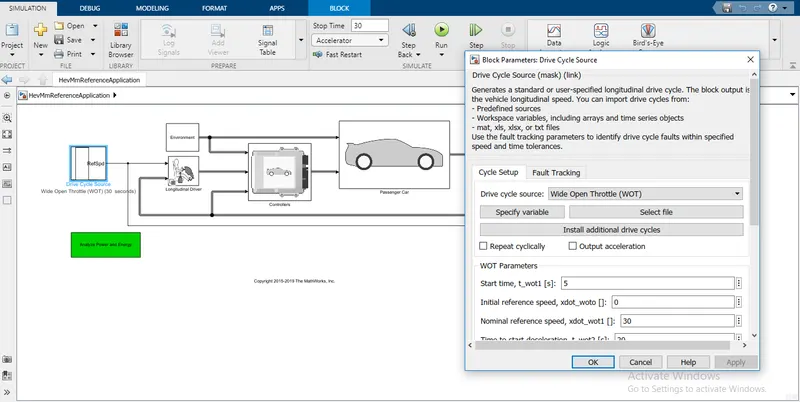
Changing to WOT drive cycle:
Changing the gradeability and wind velocity:
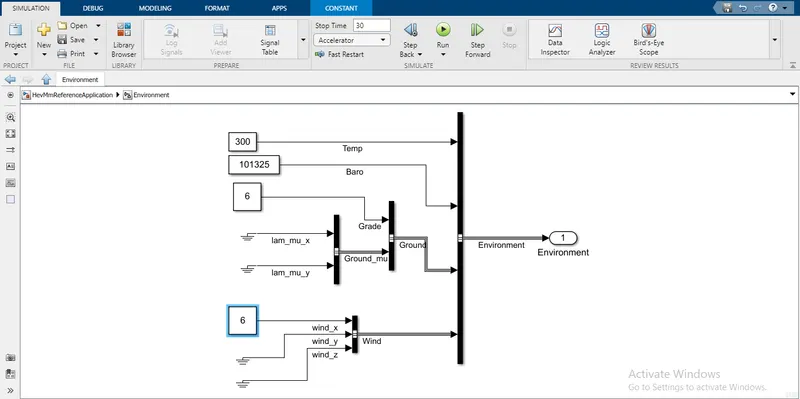
- Gradeability has changed to 6.
- And wind velocity is changed to 6.
Graph:
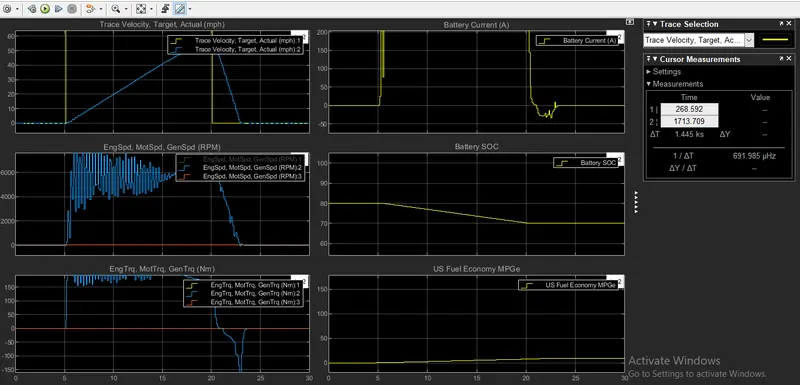
- Step time of this drive cycle is upto 30 seconds.
- First graph represents the velocity of the vehicle.
- There are 2 wave forms which is velocity 1 and velocity 2.
- First wave remains constant at the initial condition upto 5 seconds & raises around 70 reamins constant upto 20 seconds then it reaches its initial condition.
- Second wave remains constant at the initial condition upto 5 seconds & raises at the slope form till 60 to 20 seconds .
- Next graph represents the speed of the vehicle.
- There are 2 wave forms which is speed 2 and speed 3.
- Second wave form reaches the top speed at 6 seconds by 8000rpm.
- Third wave is at the initial stage till the end of the step time.
- Next graph represents the torque of the vehicle.
- First wave reaches the maximum torque at 200Nm at 5.5 sec.
- Second wave is at the initial stage till the end of the step time.
- Next graph represents the battery current of the vehicle.
- Battery reaches its highest state at 6 second and it gets discharge at 23rd second then it remains constant till 30th second.
- Next graph represents the battery SOC of the vehicle.
- State of charge increase and decrease with in the 70 to 80.
- Next graph represents the fuel economy of the vehicle.
4.HEV application
Graph:
- HEV vehicle has engine power and battery power to run the vehicle.
- FTP75 drive cycle is feeded to the HEV drive cycle.
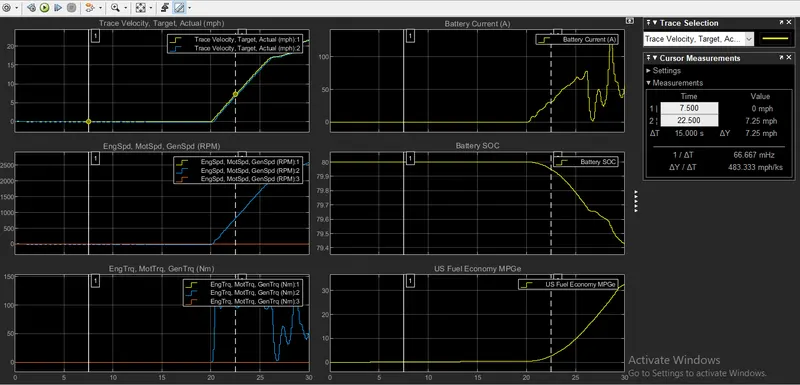
- First graph represents the velocity of the vehicle.
- There are 2 wave forms which is velocity 1 and velocity 2.
- Both the wave form remains constant till 20 seconds at the initial condition.
- After 20 seconds it increases to velocity of 22 by 30 seconds.
- And both the wave form are increaseing paralel to each other.
- Next graph represents the speed of the vehicle.
- There are 3 wave forms which is speed 1, speed 2 and speed 3.
- Wave 2 remains constant still 20 seconds and it raises suddenly to the 2600 rpm at 30 seconds.
- Wave 3 remains constant at the initial condition till the end of the strep condition.
- Next graph represents the torque of the vehicle.
- Wave remains constant upto 20 secs in the initial condition & raises around 150 Nm.
- Another wave form remains constant at the initial condition till the end of the step time.
- Next graph represents the battery current of the vehicle.
- Wave remains constant upto 20 secs in the initial condition & it raises gradually around 75A & decrease,so the wave form continues till the end of step time.
- Next graph represents the battery SOC of the vehicle.
- State of charge remains constant upto 20 secs in the 80% & decrease to 79.4%at the end of the step time.
- Next graph represents the fuel economy of the vehicle.
- Wave remains constant upto 20 secs in the initial condition & raises above 30 at the end of the step time.
For EV
Graph:
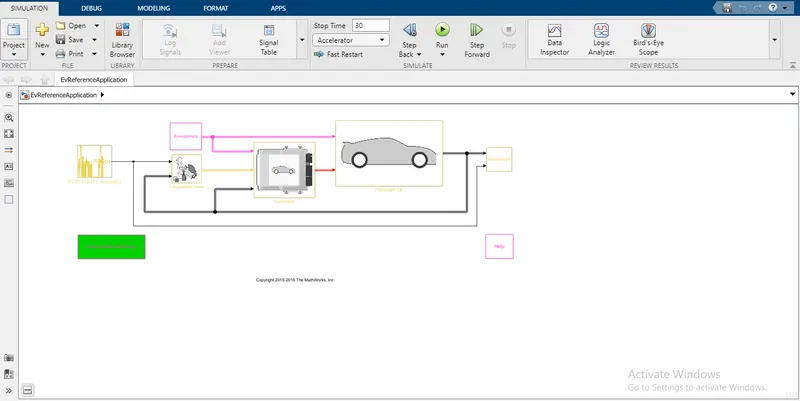
- Electrical vehicles (EV) are running by battery.
- These vehicles do not produce emissions.
- FTP75 drive cycle is feeded to the EV drive cycle.
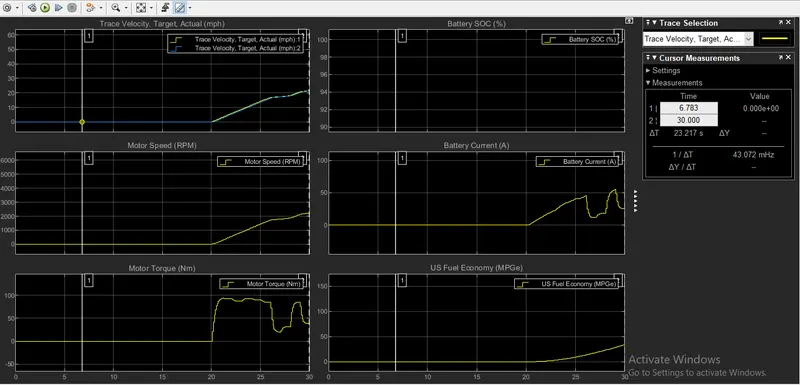
- First graph represents the velocity of the vehicle.
- There are 2 wave forms which is velocity 1 and velocity 2.
- Both the wave form remains constant till 20 seconds at the initial condition.
- After 20 seconds it increases to velocity of 22 by 30 seconds.
- And both the wave form are increaseing paralel to each other.
- Next graph represents the speed of the vehicle.
- Wave remains constant still 20 seconds and it raises suddenly to the 2200 rpm at 30 seconds.
- Next graph represents the torque of the vehicle.
- Wave remains constant upto 20 secs in the initial condition & raises around 95 Nm of torque at 21 secs.
- Next graph represents the battery current of the vehicle.
- Wave remains constant upto 20 secs in the initial condition.
- Battery current raises by 20 secs and reaches the highest amp of 55 at 29 secs.
- Next graph represents the fuel economy of the vehicle.
- Wave remains constant upto 20 secs in the initial condition & raises above 30 at the end of the step time.