Wide open throttle drive cycle for HEV & EV
AIM:
# To model and write the given systems of powertrain blockset.
Objective:
# To write the difference between the mapped and dynamic model of engine, motor, and generator
# To model calculate the miles per gallon
# To run the HEV ReferenceApplication with WOT drive cycle
# To compare the simulated results of hybrid and pure electric powertrains
Problem 1: Write the difference between the mapped and dynamic model of engine, motor, and generator
Mapped Engine: Mapped Engine is the default settings in the powertrain blocks. It is used to measure the performance parameters of the vehicle by using standard lookup tables that are preferred to the system. This type of modeling is less accurate. The lookup tables value are based on the values of brake torque, commanded torque, and engine speed. If any other parameter like Input engine temperature is selected then lookup table values are also a function of the temperature parameter. The data extracted from lookup tables are air mass flow, fuel flow, emission data, exhaust temperature, and efficiency. This data is used to find out other parameters that are needed by the end-user.
Dynamic Engine: This type of model uses real-time data fed by the user at run time for modeling. This model is more accurate than the mapped engine model. This type of model is used when the data of subsystems of a vehicle is required. We can calculate Brake torque, fuel flow, port gas mass flow, exhaust temperature, exhaust mass flow rate, and exhaust emissions.
Mapped Motor: The mapped motor works in torque control mode. This type of motor is used when the user requires a faster simulation and doesn't have the knowledge of motor parameters. The output torque and reference torque are compared and changes are made. Input torque or speed can be specified, electrical losses and maximum motor power and torque can be defined.
Dynamic Motor: In the dynamic motor a three-phase interior permanent magnet synchronous motor (PMSM) is used. The block uses three-phase input voltages to regulate the individual phase currents, allowing control of the motor torque or speed. This block is used when the user knows what parameters are to be used in that particular simulation. This motor is more accurate.
Mapped Generator: The mapped generator block is also similar to other blocks. Most of the data required is taken from the lookup tables corresponding to the given input parameters. Its simulation time is less.
Dynamic Generator: The dynamic generator involves users entering the parameters manually during the run time for their particular applications. The results take time and are more accurate.
How to change the model type?
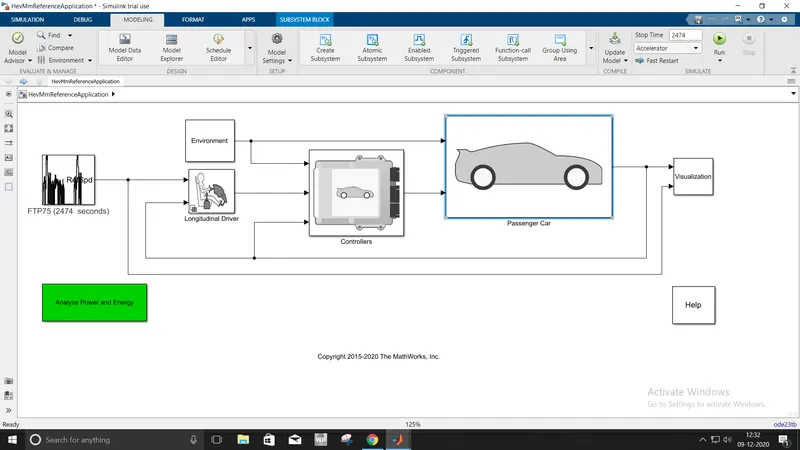
First, the hybrid model is selected from the powertrain blockset page
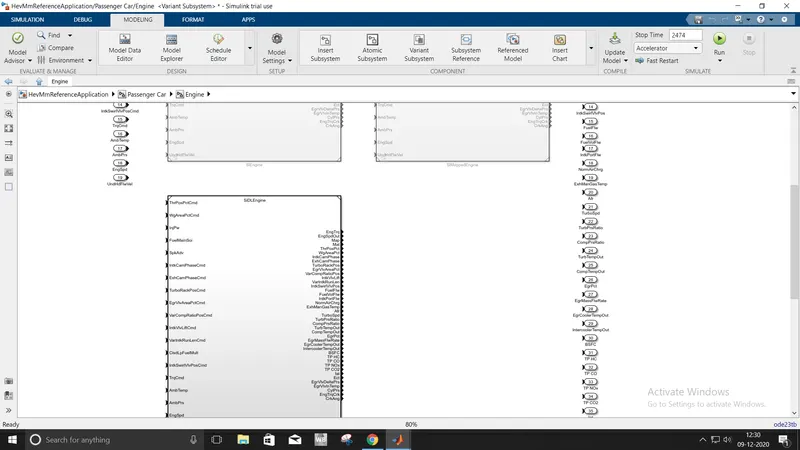
The passenger block is opened where we will find the engine block. By opening it we will find the enabled engines and disabled mapped engines
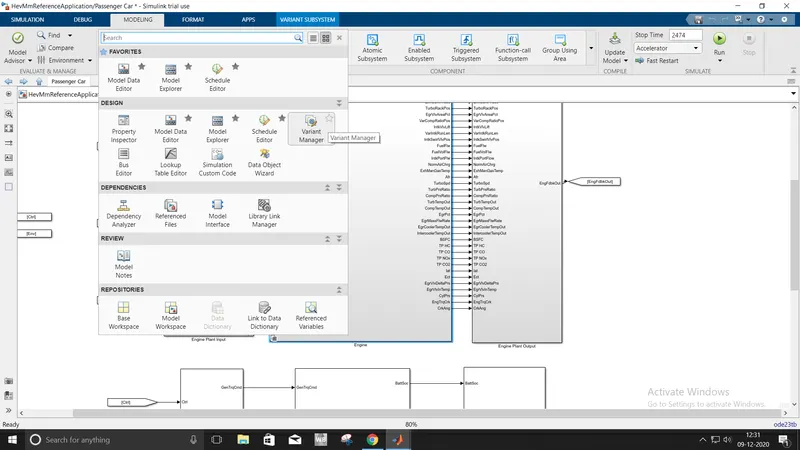
On top of the menubar, we will find the modeling tab under that variant manager is clicked and the engine tab is set to active.
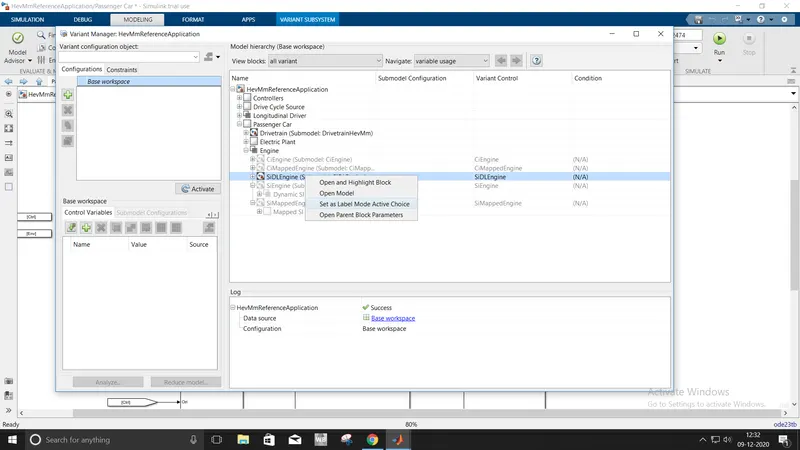
The model type is changed and set active in hybrid engine vehicles.
Problem 2: To model calculate the miles per gallon
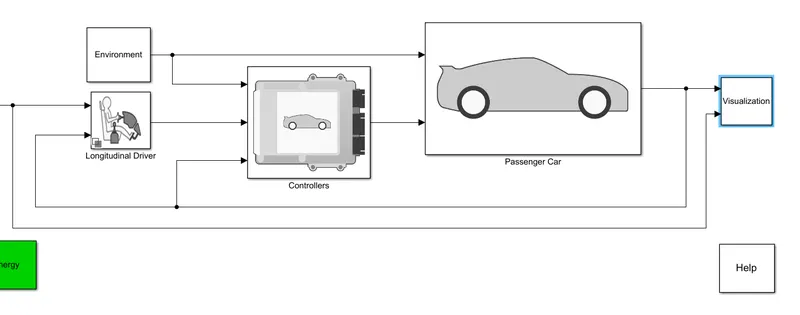
The hybrid model is used here to find the miles per gallon. The visualization block is clicked for checking the performance calculation.
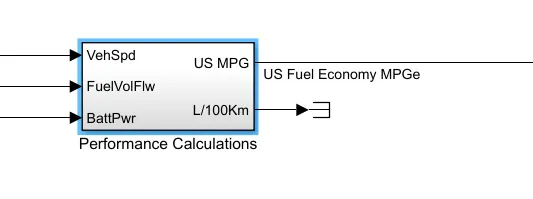
The above block is a performance calculation block where it consists of vehicle speed, fuel flow, battery power is considered for calculating the miles per gallon.
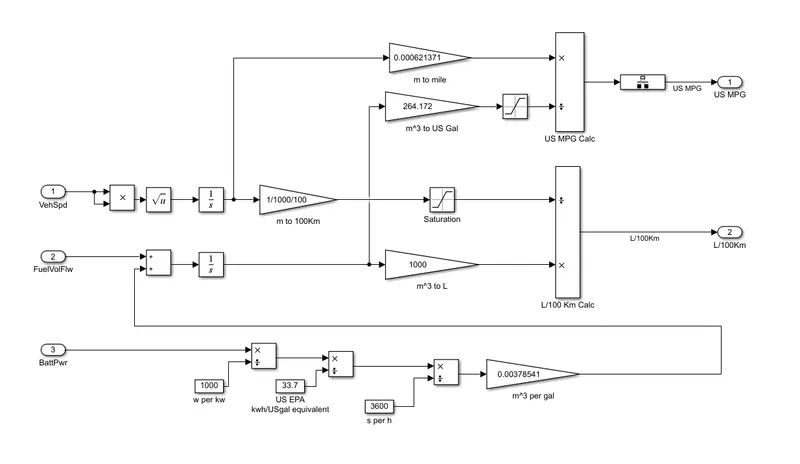
From the vehicle speed input the velocity is integrated and changed into displacement which the input values are converted from 'm' to miles for gallon calculation. Then the fuel flow values are integrated which the velocity is calculated the volume is converted into the gallon. The fuel flow and speed values are processed into US gallon calculation to find the miles per gallon. Where the saturation block is used for finding the average value and the calculation is processed. 1 gallon of gas = 33.7kwh of electricity
1MPGe = 1 mi/(33.70kw-h)
Factors considered modeling fuel flow:
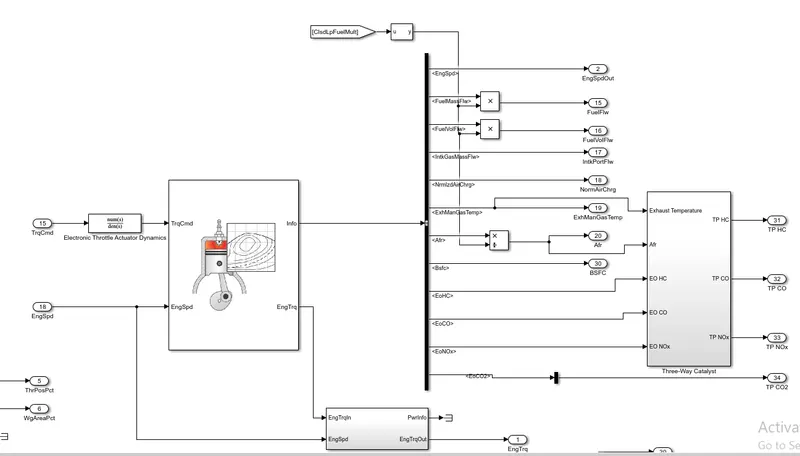
The above sub-block is under the passenger block which shows the fuel flow is considered from the torque command and engine speed from si mapped engine block. The si mapped engine block is under the engine block.

From the controller block, the fuel flow factors are considered they are closed-loop fuel multi. This operation is found inside the subblock of the si controller where it is found inside the si engine controller block under the engine control module.
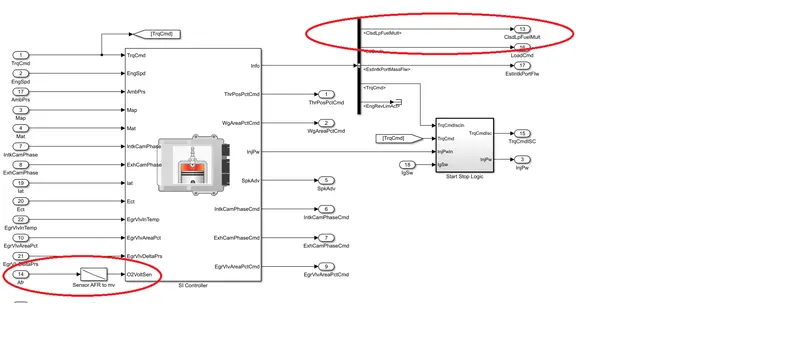
The closed-loop fuel multi and air-fuel ratio sensor are other factors from the controller unit that helps to consider the fuel flow in the model.
Problem 3: To run the HEV ReferenceApplication with WOT drive cycle
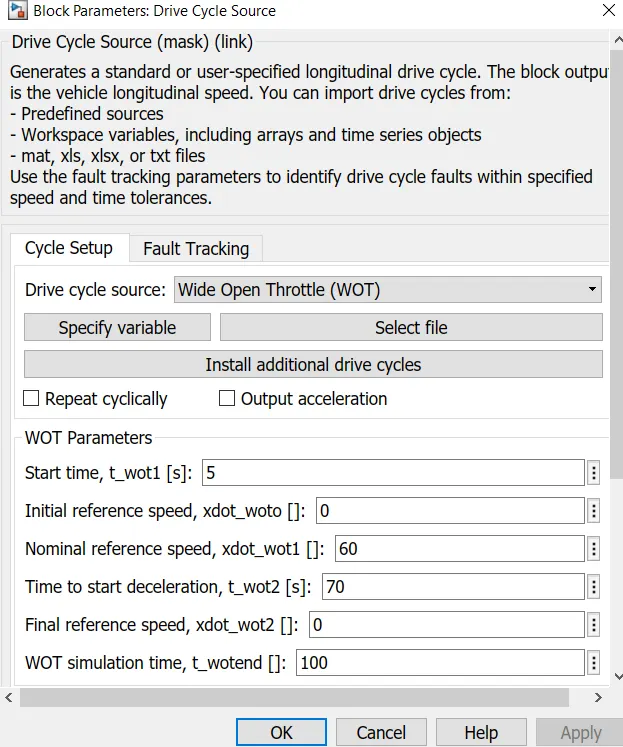
Hev model is selected where the drive cycle is changed to wide-open throttle. Start time is changed to 5secs. Initial reference speed is given as 0, Nominal reference speed is given as 60mph, time to start deceleration is 70mph is given and final reference and WOT simulation speed is given as 0 & 100.
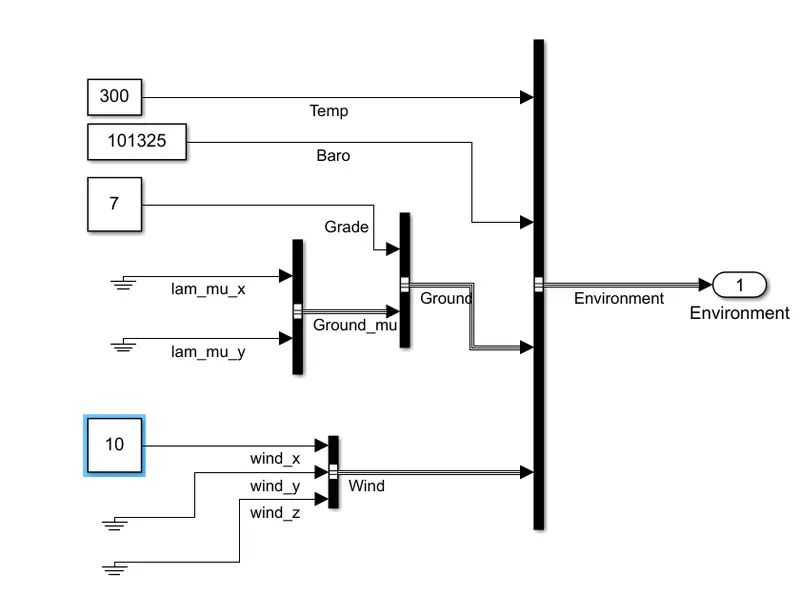
In environment block the grade and wind velocity is given as input. The values are 7deg is the grade and 10m/s are the inputs given.
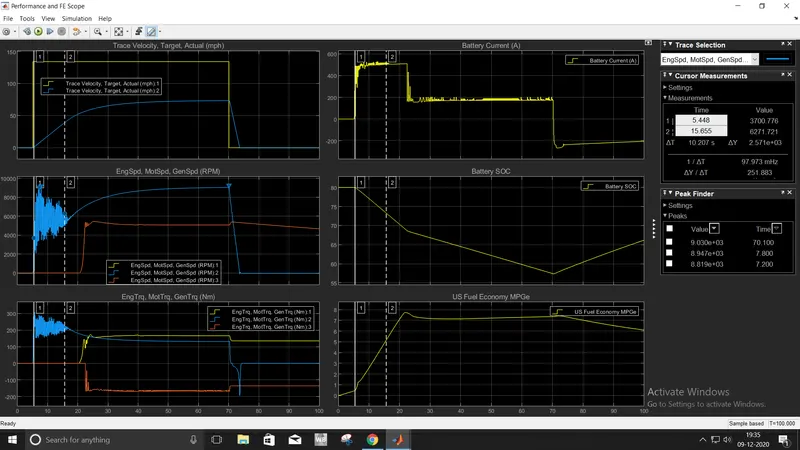
The above graphs show the result of HEV with a grade of 7deg and wind speed of 10m/s
From the above graph results, the values obtained by the vehicle are
# The actual velocity of the vehicle when the deceleration starts from 70mph to 0mph is 3.72sec, the peak acceleration of the vehicle is 73.4mph
# In graph 2 the motor peak rpm is 9000 and for engine and generator, the peak is 5440rpm is the same for both engine speed and generator speed. Where the motor starts at 5sec, engine and generator start at 20sec.
# In battery current the vehicle decelerates at 70secs the battery current is at 170amps but after 70sec it suddenly drops to negative.
# In battery soc at 70sec the deceleration starts where the soc is 55 it increases gradually to 100sec where the soc is 66. At 5sec soc is 80 it reduces gradually and at 20sec there is some drop off charge.
Problem 4: To compare the simulated results of hybrid and pure electric powertrains
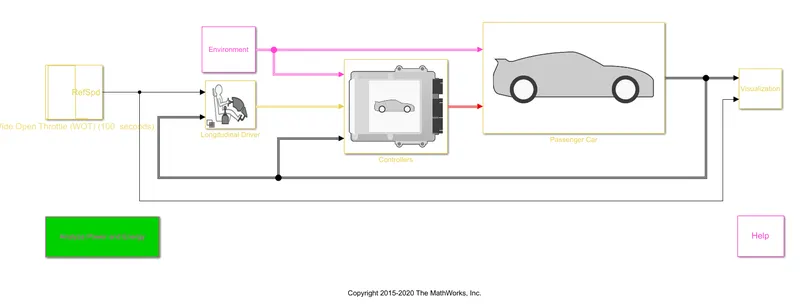
The electric powertrain model is opened and the drive cycle is changed to wide-open throttle.
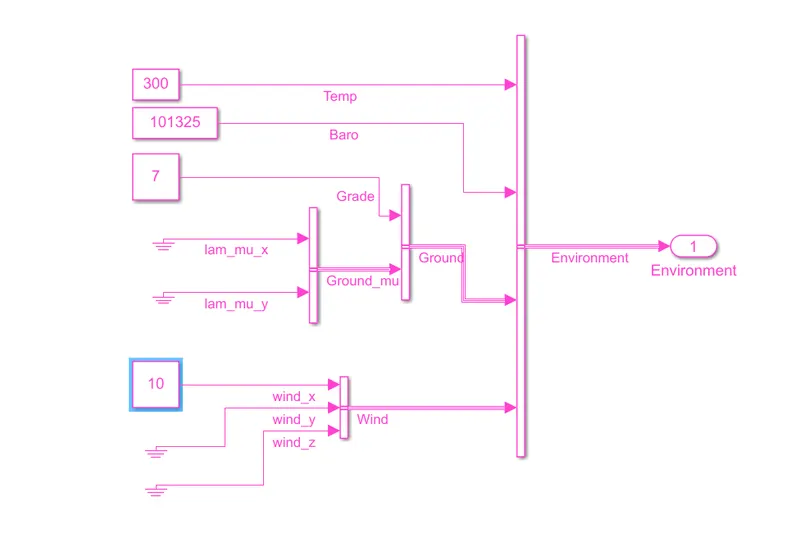
The same grade and wind speed is given for the electric model
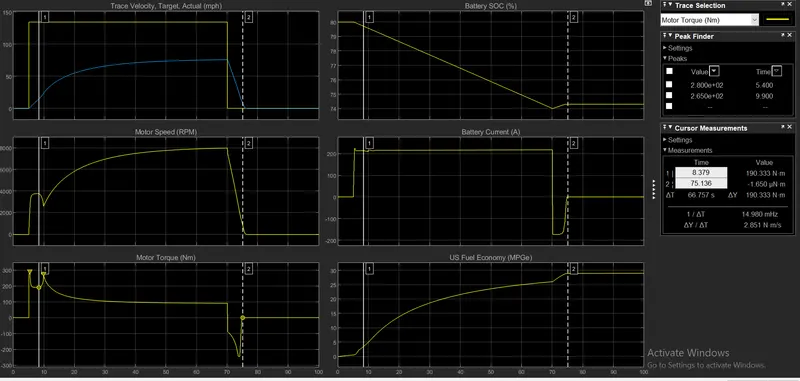
The results of the electric vehicle are generated in the above graph:
# The actual velocity from 70mph to 0mph is 5.73sec the difference between HEV and EV is 2.01sec. The peak acceleration in EV is 75.6mph which is 2.2mph greater than HEV
# The motor peak speed is 7974rpm while comparing HEV motor rpm the difference is 1026rpm. EV motor achieves lesser RPM than HEV motor. The EV motor rpm suddenly drops at 7.7sec from 3700rpm to 2658rpm.
# The battery soc at 70sec the state of charge is 74% and later it increases and maintain a constant value of 75%
# Battery current where the deceleration at 70sec the current goes from 217amps to -173amps. The EV battery soc takes 4.9sec to reach 0amps to negative. 225amps is the peak battery current achieved by EV.
# Motor peak torque achieved by EV is 280Nm.