Week-4 Challenge WOT Condition Part-2
TASK I
MAPPED MODEL
The performance of each component is represented by a collection of steady-state lookup tables in this model.The tables provide general qualities or features to evaluate how well certain parts, including engines, motors, and generators, work.We need all the real-time data and values needed to provide the Engine, Motor, and Generator with input in order to develop the lookup tables.
DYANAMIC MODEL
This model breaks down the behaviour of its constituent parts into a variety of traits or qualities, which are then divided into lower-level constituents. The models incorporate the dynamic effects by merging the components in this manner.These models are used to examine how different component elements affect performance as a whole.For this kind of model, no real-time data values are necessary as input.Only very basic information, such as the specs of the Engine, Motor, and Generator, is needed; the components themselves operate based on the circumstances of the operation.
1.Engine
The behaviour of the macroengine is described by a mapped model of the engine using a series of steady state lookup tables. The table lists the general engine specs, such as actual torque, fuel flow rate, exhaust pollutants, and fuel consumption. For simulations of quasi-steady states, it is employed.
A dynamic engine model breaks down engine behaviour into characteristics that are then divided into lower level components. The model captures the dynamic effects by mixing the components in this manner. It employs to evaluate how various engine parts affect overall performance.
2.Motor
The motor's mapped model includes a drive electronics system that operates in torque control mode and determines the toque range and torque speed envelope. In addition to a motor and drive reaction time constant, output torque monitors a torque reference demand. Electrical losses are described as a single operating point that encompasses loss estimation for the entire operating range, measured loss, or measured efficiency. The user provides data inputs to the motor's dynamic model. To control individual phase current, three phases of input voltage are required.
3.Generator
The mapped generator is comparable to the preceding building blocks. Additionally, it uses lookup tables as input parameters. In the case of a dynamic generator, user input is required. As a result, it will take longer to simulate and is more accurate than the mapping system.
HOW TO CHANGE THE MODEL TYPE
1.Steps for selecting the model type
- We must first choose the type of car in the powertrain blockset module, whether it is a hybrid, completely electric, or full engine vehicle.
- The Simulink model eventually appears by showing the model's work flow blocks.
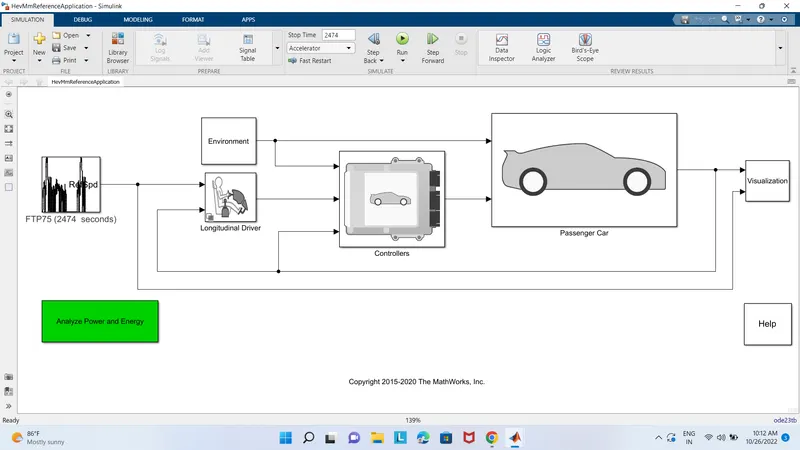
- Open Passenger car block and open the electric plant , we get the window is shown below
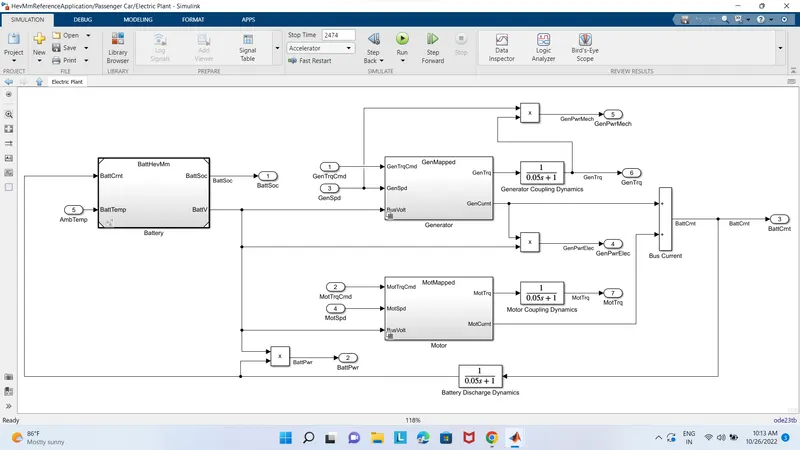
- Simply right-click motor or generator block and select Variance Label mode Active, then select either MotorGenEV Mapped or Dyanamic.
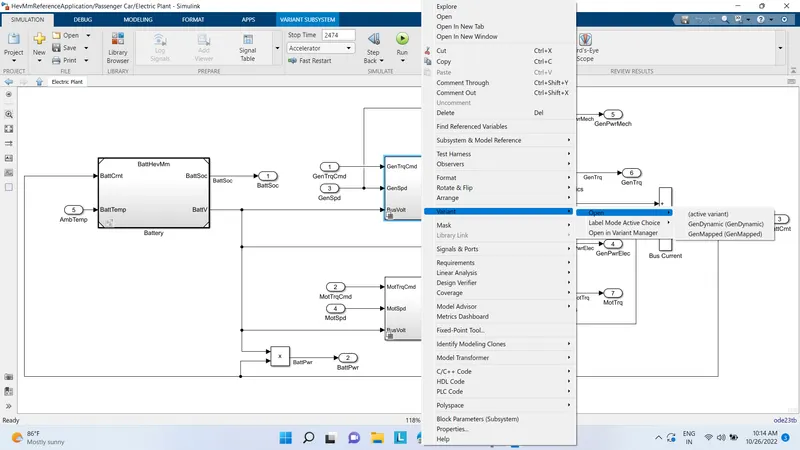
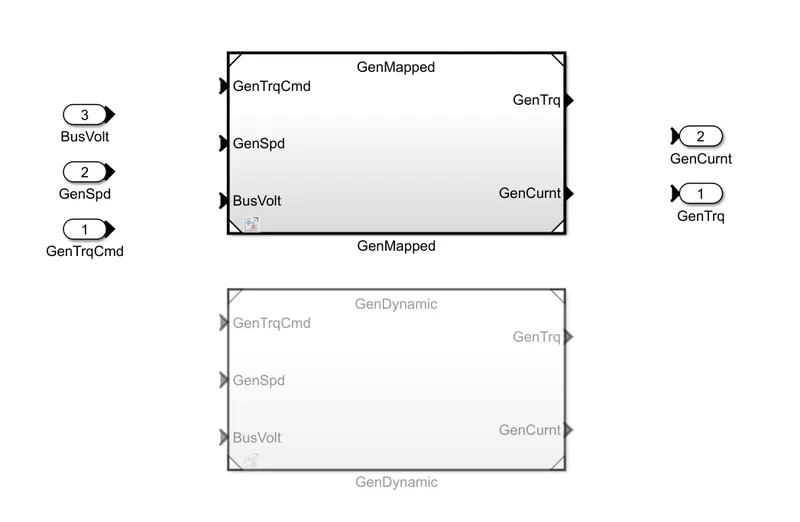
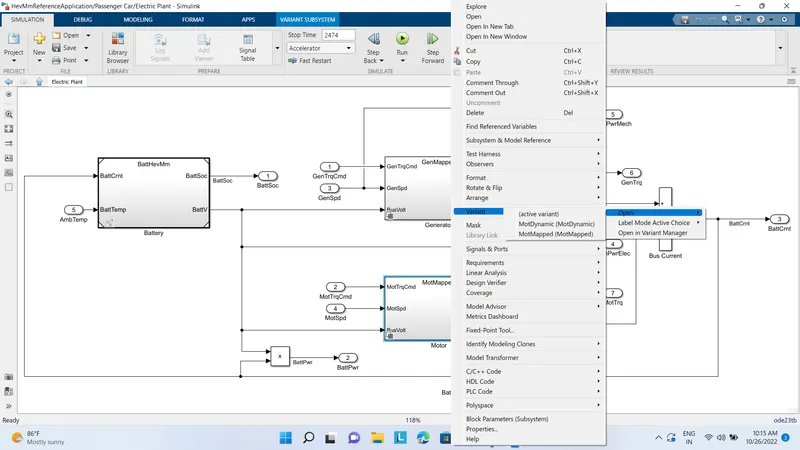
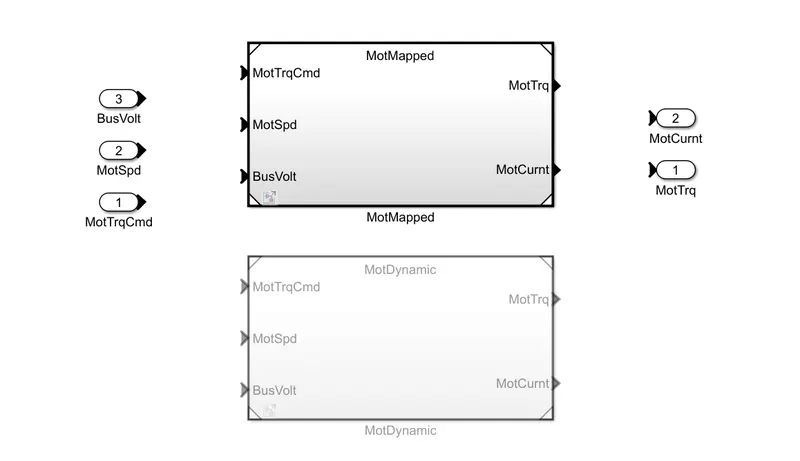
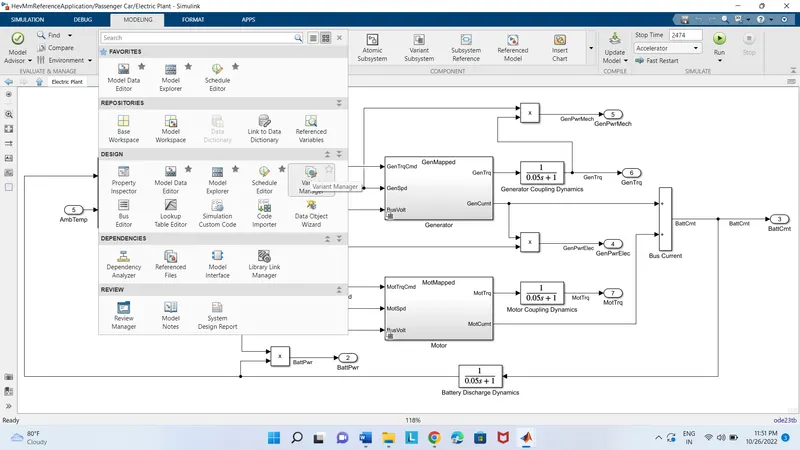
There is an another method to change the model type,
Open the electric plant,Click the modelling menu and choose and select the variant manager
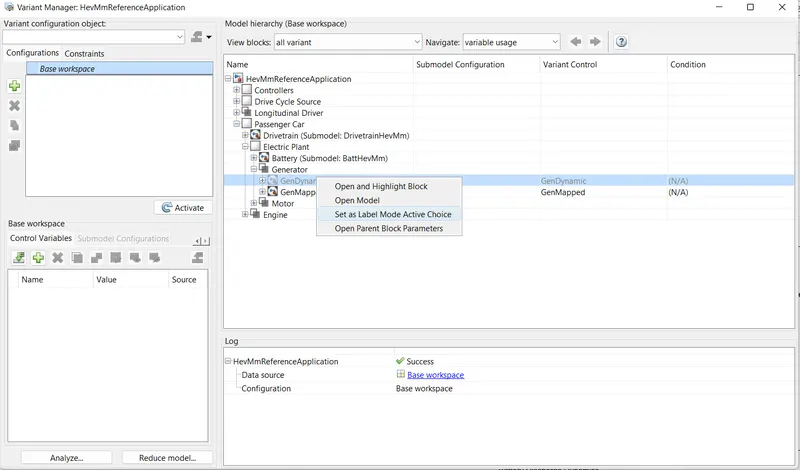
Imagine that we want to switch the generator block from being mapped to dynamic. Right-click on GenDynamic and then choose "Set as Label Model Active Choice." Then click double on "GenDynamic."
TASK II
Calculation of miles per gallon
The unit used to determine a car's fuel efficiency is miles per gallon (MPG). Miles per gallon equivalent is used in place of it in electric vehicles (MPGe). 33.7 kilowatt hours of electricity are contained in one gallon of gasoline.
The reference car powertrain blockset's 'Visualization' block contains the MPG calculation.
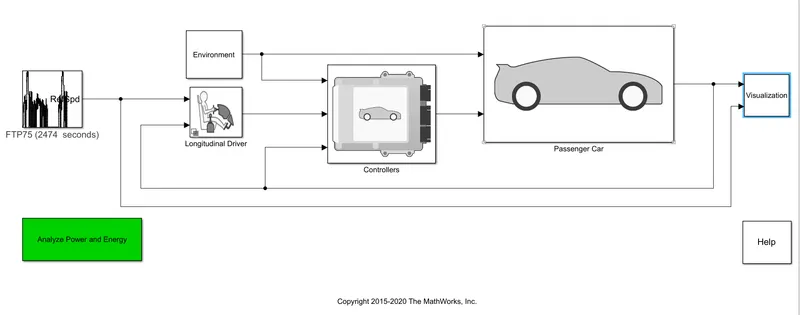
The Performance Calculation block, which is located in Visualization, is where the conversion to MPG is performed.
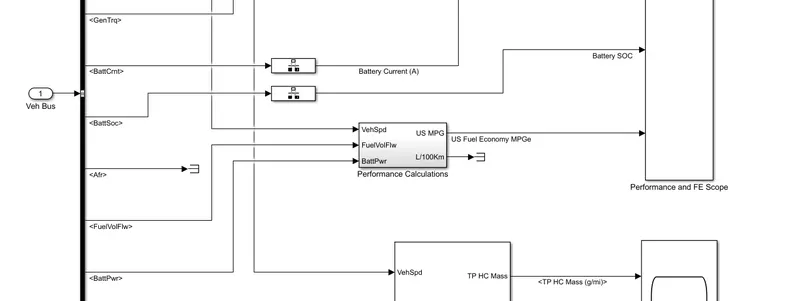
After opening the performance calculations block,we reach an another window which clearly gives the MPG calculations
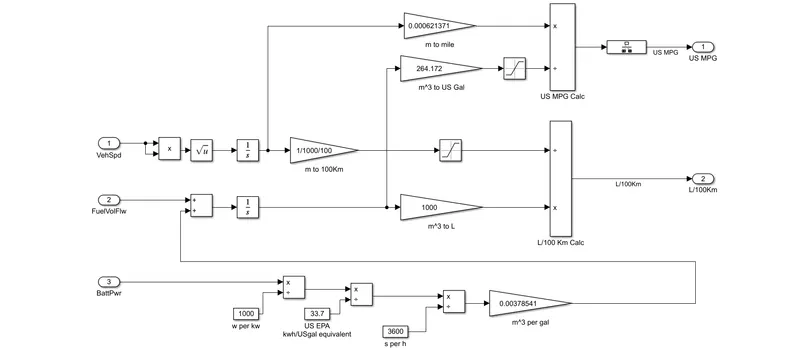
To convert into MPG three factors are required
- Vehicle speed
- Fuel Volume flow
- Battery power
Vehicle speed is used to compute the distance travelled, which is then converted from metres to miles.1 metre is equal to 0.000621371 miles in the metre to mile conversion.Following that, the total fuel volume is determined in cubic metres by adding the battery power and fuel volume flow.
Fuel conversion results in 33.70 KWH of energy per gallon of gasoline for batteries.
Using the conversion factor 1 cubic metre = 264.172 US Gallons, the entire fuel volume is then converted to gallons.The fuel economy in miles per gallon is then calculated by dividing this fuel volume by the miles travelled (MPG).
TASK III
We may find information about "Getting Started with Powertrain Blockset" in the MATLAB help area.
By clicking on the provided link to "Explore the Hybrid Electric Vehicle Multimode Reference Application," we can choose the "Hybrid Electric Vehicle (HEV) - Multimode" from the list of reference models.
Click the 'autoblkHevStart' link inside of it to launch the simulation and reference model.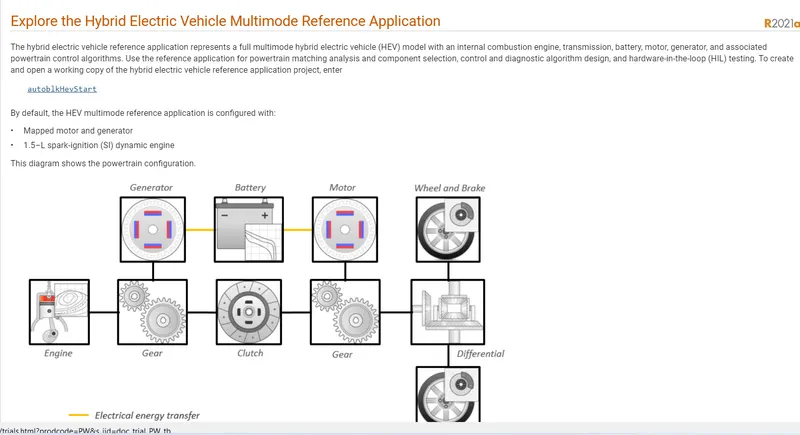
The model is displayed below and we may load it from the mat lab documentation.
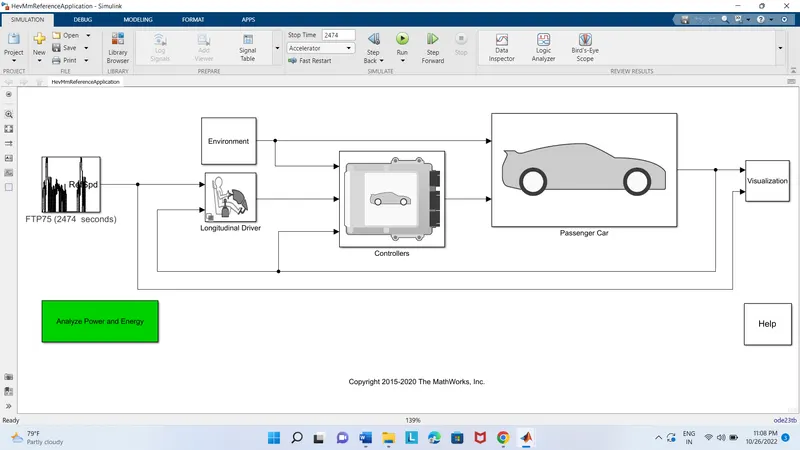
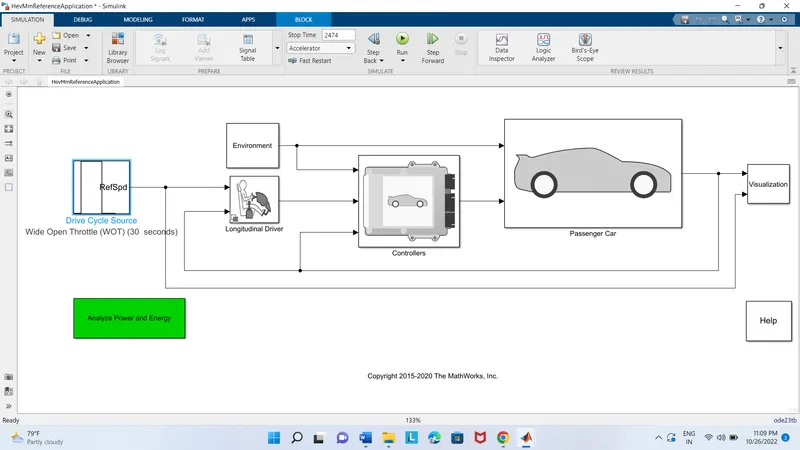
Here, a drive cycle is generated using the drive cycle source block, and the input is a wide open throttle (WOT) drive cycle. Below is a diagram showing how to change the parameters.
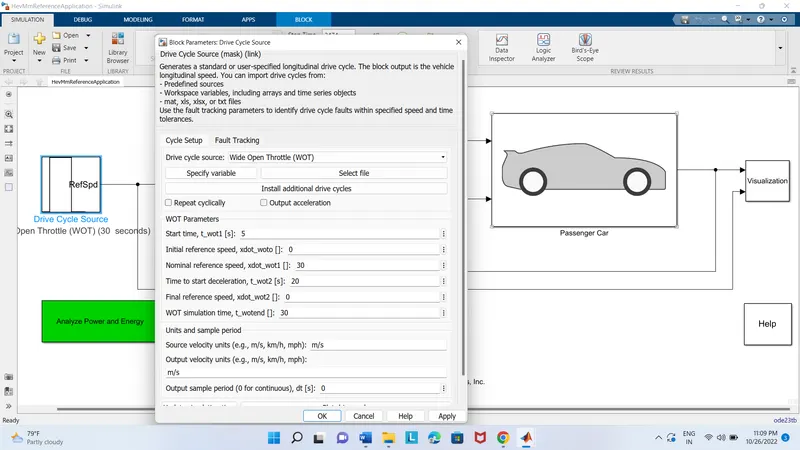
Open the drive cycle source block and change the drive cycle source to Wide Open Throttle mode.
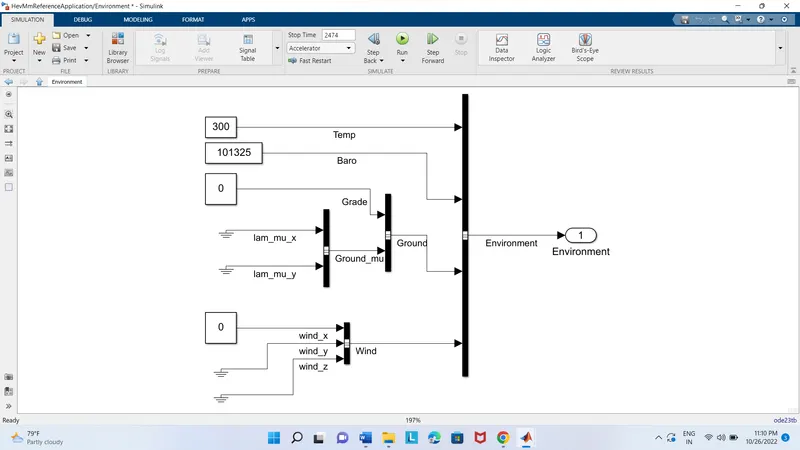
Environment variables are created by the environment subsystem. Both wind speed and gradient are included.
Drive Cycle = Wide Open Throttle (WOT)
Grade = 0%
Wind = 0 m/s
Result
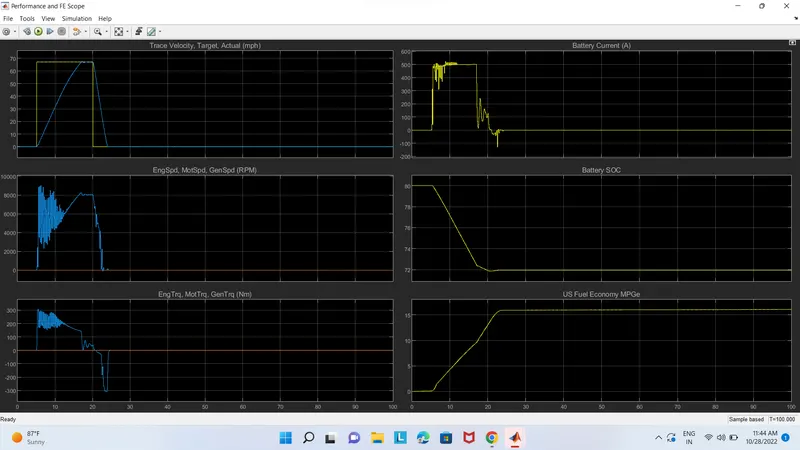
After altering the drive cycle, the simulation is run, and the results are displayed in the visualisation subsystem. Below is an illustration of it.
Drive Cycle = Wide Open Throttle (WOT)
Grade = 10%
Wind = 10 m/s
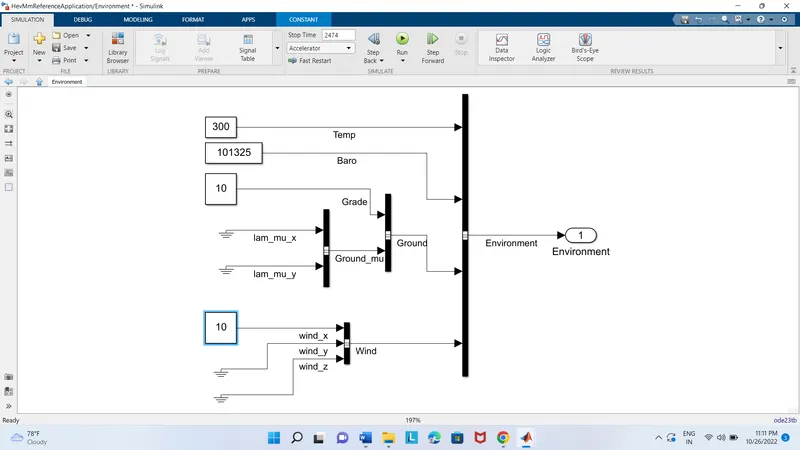
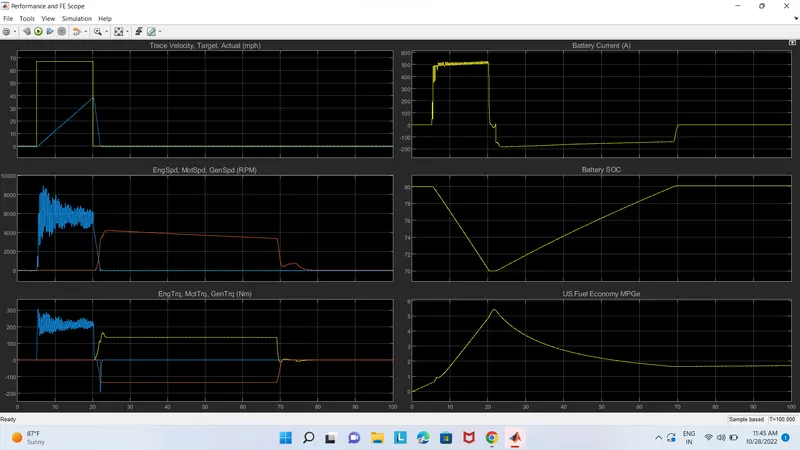
Result
Conclusions
It is clear that the existence of gradient and wind velocity significantly affects the actual velocity. Due to the presence of road elevation and opposing wind velocity in the X direction, significant changes in motor speed and, consequently, in motor torque are seen. The battery charge changes are observable as being of lesser magnitude yet concentrated in particular places. However, when gradient and wind speed are taken into account, there are far fewer and more even changes in battery charge.
In both situations, the relationships between engine speed and torque and generator speed and torque are essentially unchanged. Despite the fact that the values have changed in both instances, the changes are not very substantial. Both examples have insignificantly low minimum SOC levels. However, compared to the second example, the first scenario has a higher fuel economy. In both situations, the motor initially reaches its maximum speed before the engine helps it by supplying more energy later on depending on the drive cycle condition. The generator's negative value may signify that the charge is being renewed. The negative charge value represents regenerative braking and potential recharge.
The vehicle cannot reach its top speed as it did when there was no gradient and no wind because of the slope and wind speed conditions.It cannot reach the initial top speed in the absence of a slope or wind because more force is needed to overcome the resistance caused by the slope and wind.Additionally, we can see that fuel efficiency declines in a windy and graded environment.
TASK IV
Comparison with EV Reference Application
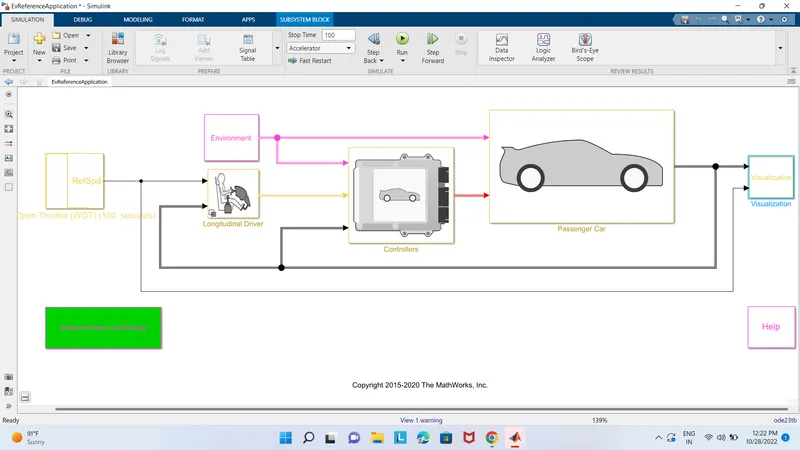
The electric vehicle (EV) reference application simulates a completely electric car with a motor, generator, battery, direct drive gearbox, and related power train control algorithms. An mapped motor and battery are installed in the EV. The power train arrangement is shown in this diagram.
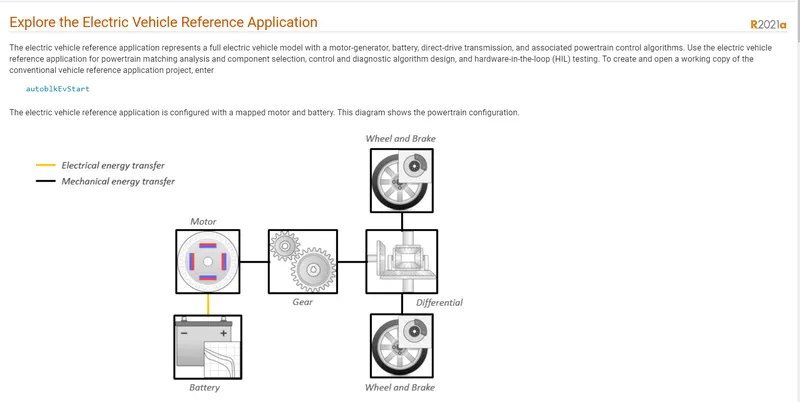
Below is a representation of this, which is also loaded from the documentation files.
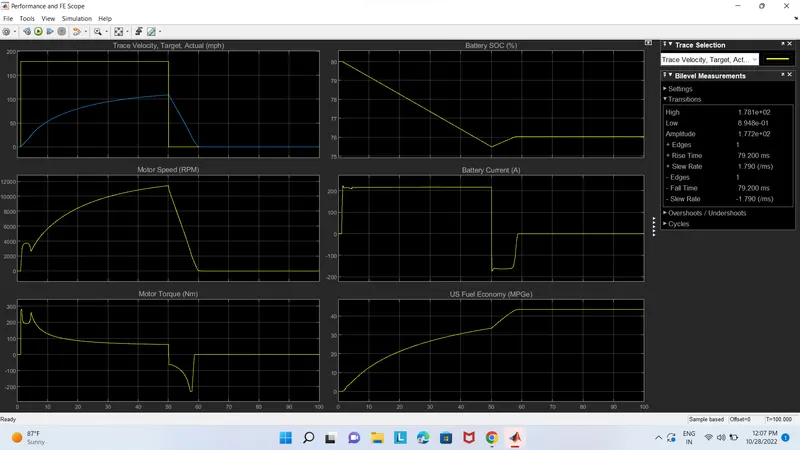
Gradeability and wind velocity are zero
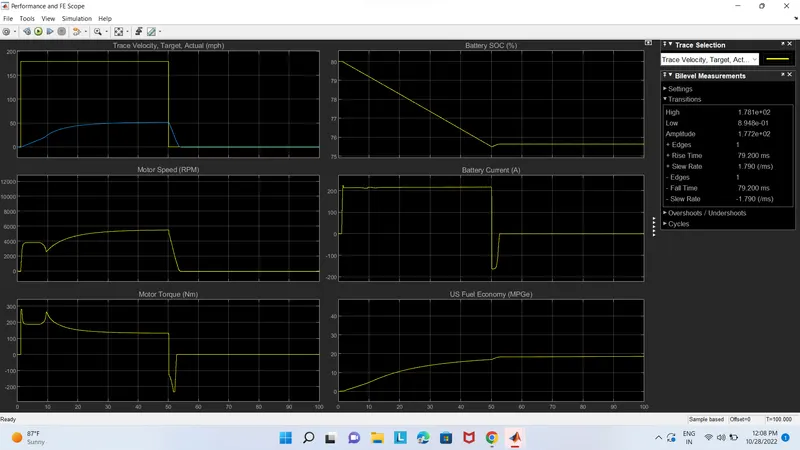
Gradeability-10% and Wind velocity -10m/s
Conclusions
With the same driving cycle and environmental conditions, an electric car achieves a lower top speed than a hybrid electric vehicle. When a hybrid car uses both its motor and engine, the torque it produces is more than that of an electric vehicle, which produces more motor speed and torque than a hybrid vehicle using just its motor. Due to this, the hybrid car is able to reach a higher top speed than a pure electric vehicle.The miles per gallon figures for each of these cars show that the electric car is more efficient than the hybrid.When compared to hybrid vehicles, electric vehicles emit no pollutants whereas hybrids do.
The power train block set was the subject of a study, and simulations were run. We examine the capabilities of hybrid and all-electric vehicles in simulation..
Refferences
- https://in.mathworks.com/products/powertrain.html
- https://in.mathworks.com/help/autoblks/ref/mappedmotor.html?s_tid=srchtitle
- https://in.mathworks.com/help/autoblks/ug/explore-the-hybrid-electric-vehicle-multimode-reference-application.html
- https://in.mathworks.com/help/autoblks/ug/explore-the-electric-vehicle-reference-application.html