Week-3 Challenge: ADVISOR Tool
Aim
Using ADVISOR tool for simulation
Objectives
- For EV_defaults_in file, if cargo mass is 500kg with all other default condition, can the vehicle travel for 45km with FTP drive cycle? Conclude the observations
- In the above case, try changing the battery capacity and repeat the simulation
- Perform grade ability test with PRIUS_Jpn_defaults_in file. Compare your results in table and conclude.
Introduction
The US Department of Energy's (DOE's) Advanced Vehicle Simulator (ADVISOR), which was created by the National Renewable Energy Laboratory and built in the MATLAB/Simulink environment. For sophisticated vehicle modelling, ADVISOR offers the community of automotive engineers a user-friendly, adaptable, supported, and resilient analysis tool. It is largely used to measure the fuel efficiency, performance, and emissions of vehicles that use alternative technologies, such as internal combustion engines in hybrid (i.e., multiple power source) designs, fuel cells, batteries, and electric motors. It is excellent at calculating the relative change that may be anticipated as a result of the use of technology in comparison to a reference situation.
TASK I
ADVISOR tool using Matlab after downloading it from the website . ADVISOR utility will launch when we open the file advisor.m in the editor window. We can choose the metric system from the pop-up window if it's more convenient. The electric car file is what we are intended to load here.
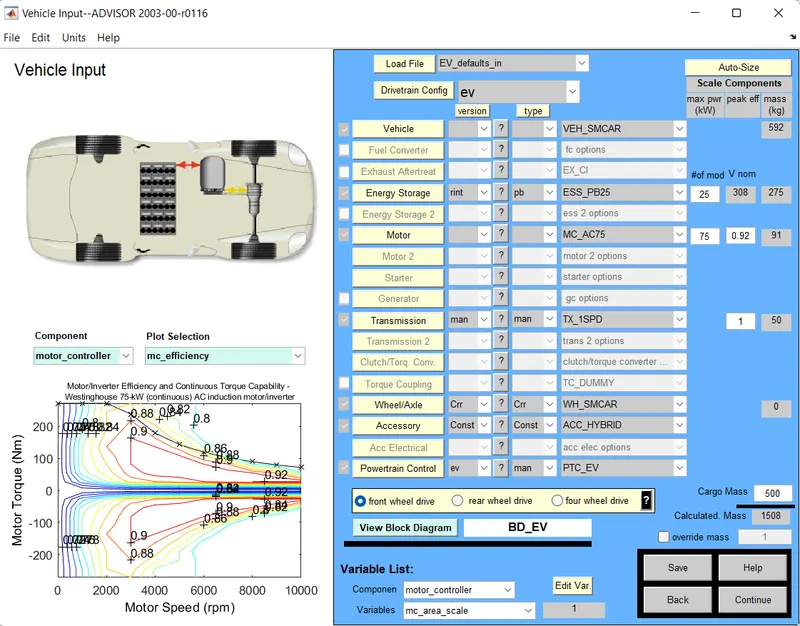
We can choose the desired file in the representation above by clicking the load file button. We wanted to simulate a vehicle with 500 kg of payload mass in the target. The cargo mass option shown above is where it can be entered. When we click Continue, a window will appear, and it is pictured below.
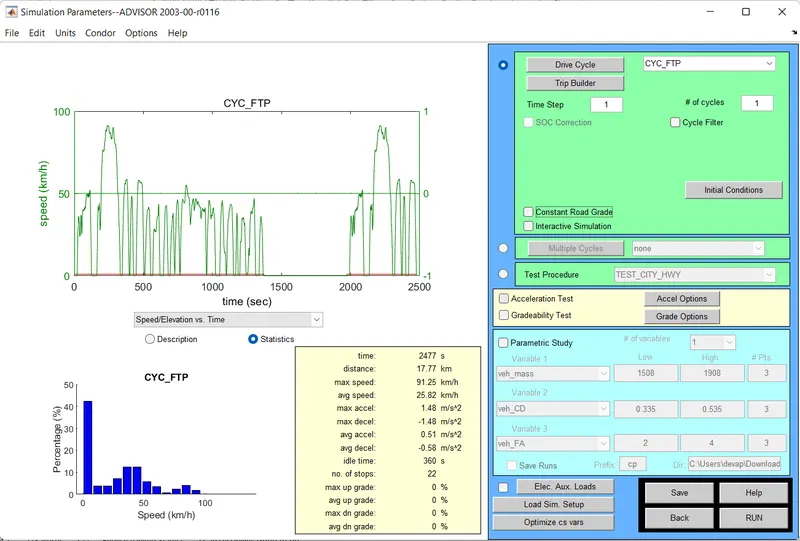
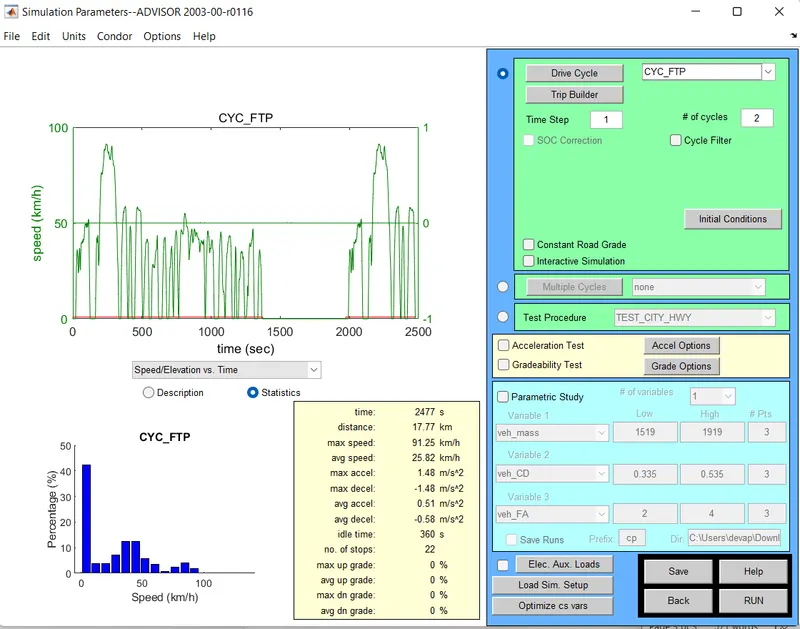
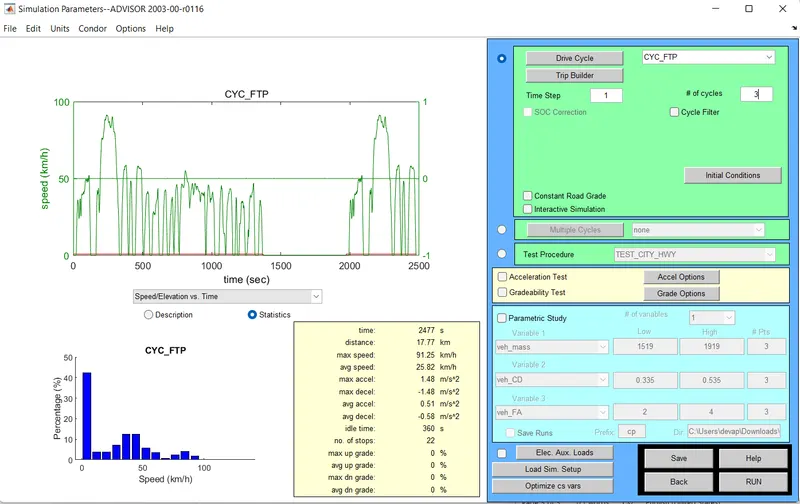
We were able to choose the FTP drive cycle by using the drive cycle button, which is relevant to the vehicle we had chosen. Also selectable is the number of driving cycles. One is the pre-set value. Clicking the RUN button will now start the simulation. Following is the outcome.
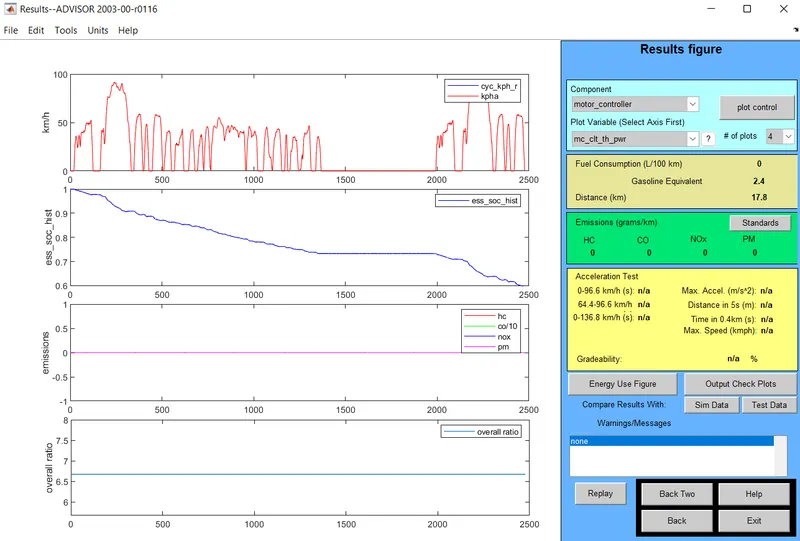
We can observe from the result figure that the car travelled 17.8 kilometres. We were instructed to determine whether a vehicle could travel 45 kilometres. To do that, we'll run the simulation and increase the amount of drive cycles. Below is a representation of adjusting the amount of cycles.
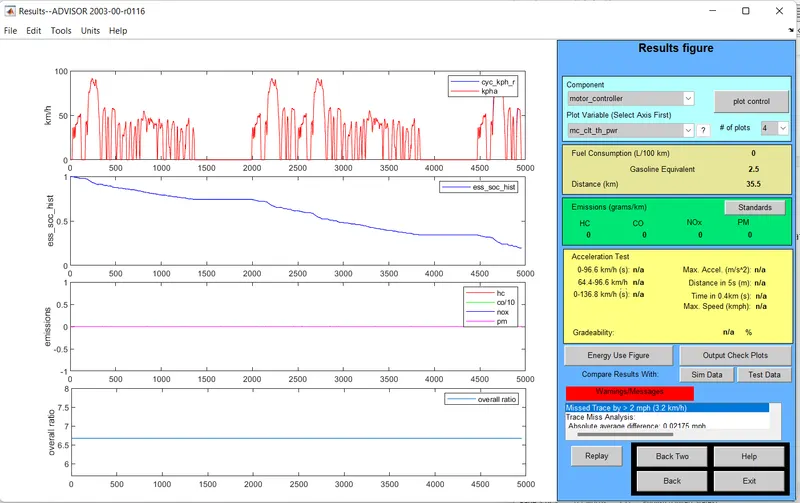
After changing the number of drive cycles into two, the RUN button is activated and the result is given below.
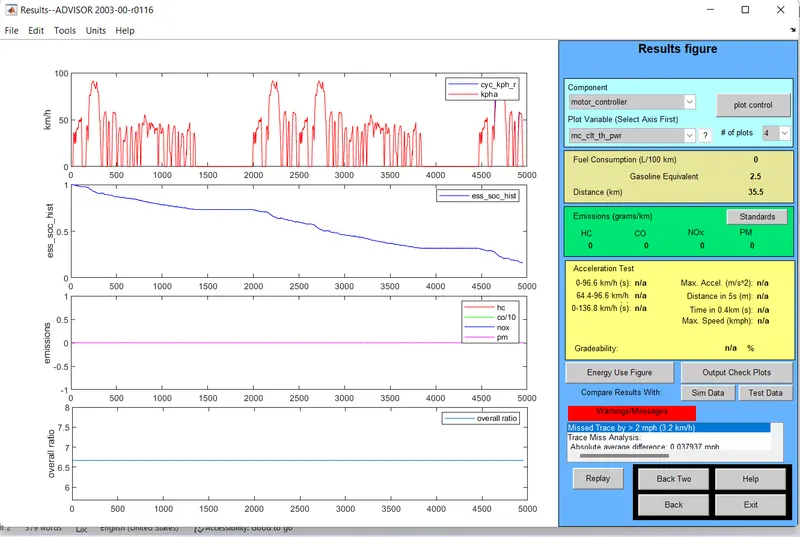
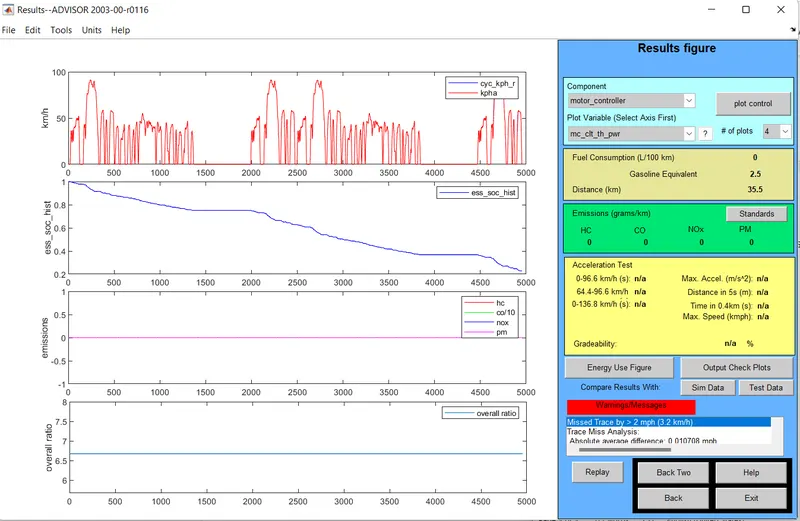
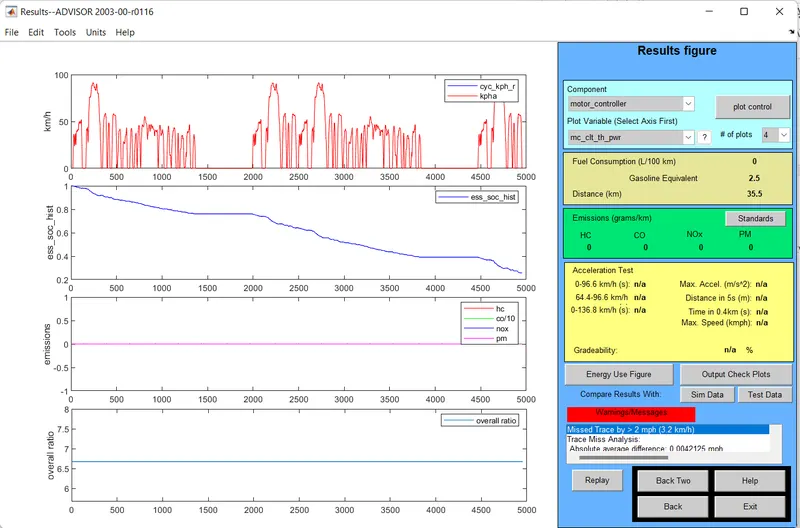
The measurement of the travelled distance in this case was 35.5 km. This is insufficient to address our situation. So we switch to three for said drive cycle number.
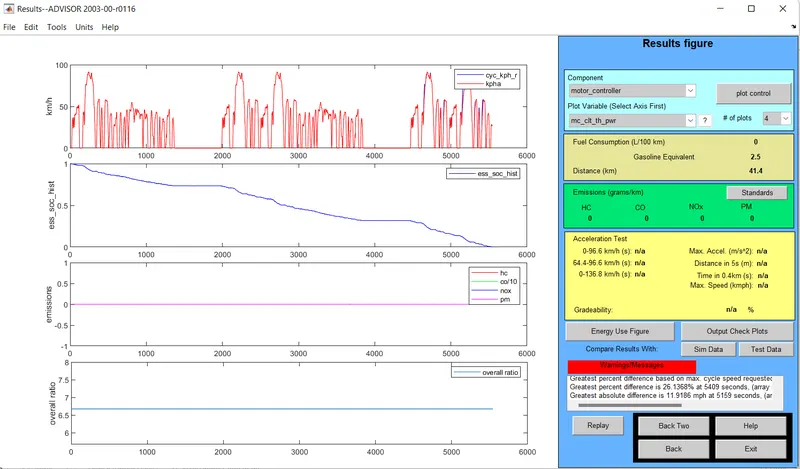
The vehicle covered a distance of 41.4 kilometres. For our circumstances, this is also insufficient. However, we are limited in how many cycles we can add. as the soc value is almost 0 for three driving cycles. The vehicle has a limited range because it is entirely powered by the battery. Therefore, the car's maximum range is 41.4 kilometres.
TASK II
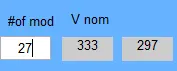
We can now repeat the simulation while altering the amount of modules in the same vehicle. Battery capacity is altered while maintaining all other variables constant.” # of mod & V nom” describe the battery capacity . We will change the module number of batteries from first box, after that remaining two boxes reflect the changes in voltage and weight of the battery.
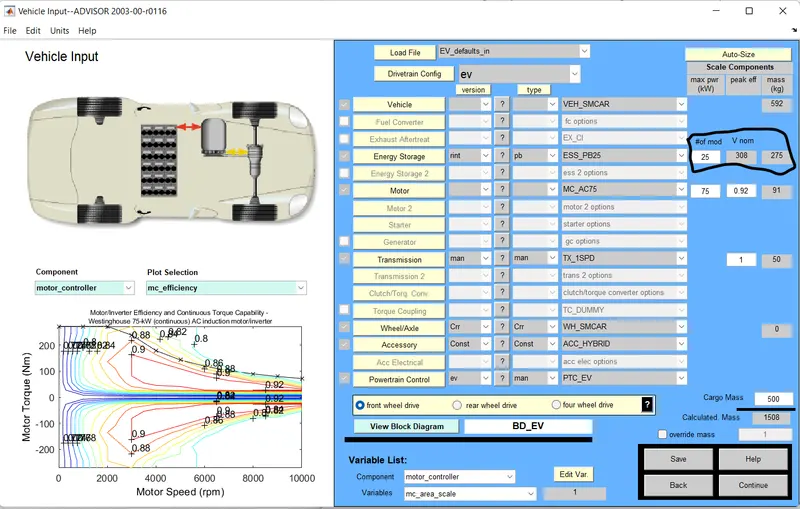
After changing the battery capacity, simulation is carried out and the result is given below.
26 modules

Drivecycle-2
drive cycle-3
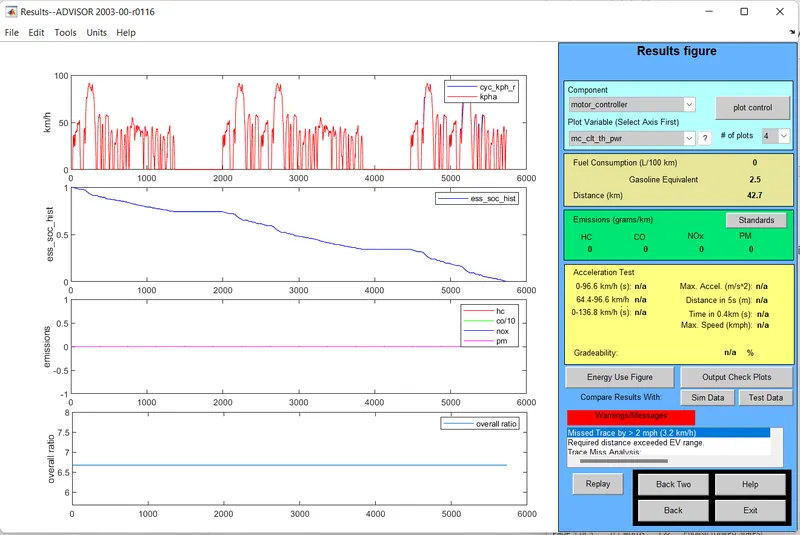
27 Modules Batteries
drive cycle-2
drive cycle -3
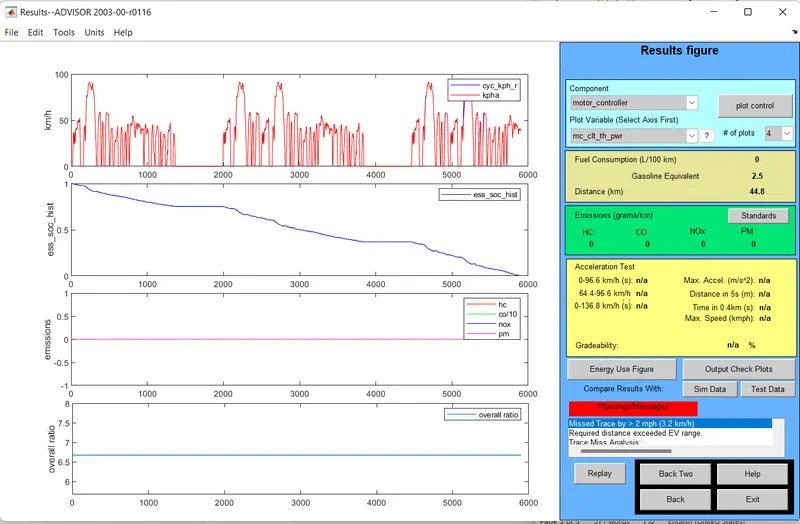
28 Modules Batteries

drive cycle-2
drive cycle-3
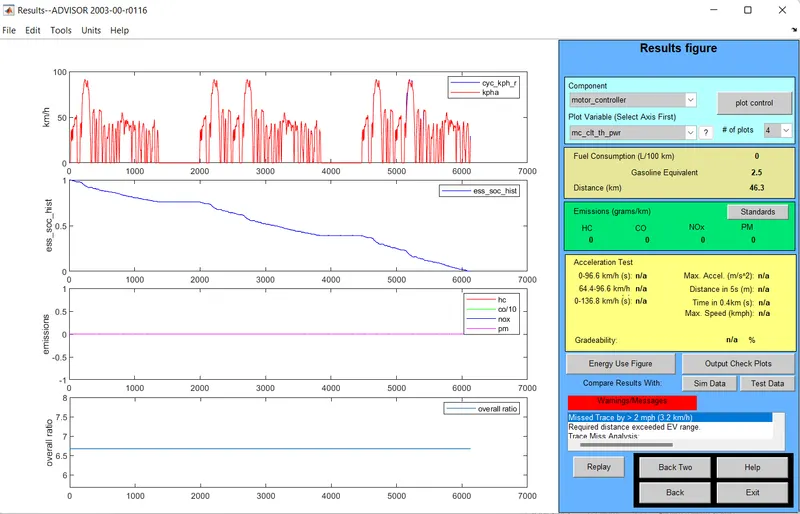
Drive cycle-2
| Battery Module | Battery weight | Voltage | KM |
| 26 | 286 | 321 | 35.5 |
| 27 | 297 | 333 | 35.5 |
| 28 | 308 | 345 | 35.5 |
Drive cycle-3
| Battery Module | Battery weight | Voltage | KM |
| 26 | 286 | 321 | 42.7 |
| 27 | 297 | 333 | 44.8 |
| 28 | 308 | 345 | 46.3 |
28 modules of 345 volt battery unit is needed to cover a distance of 45 kilometres.
TASK III
The Toyota PRIUS is simulated in the ADVISOR programme using data from original laboratory tests. The illustration is provided below.
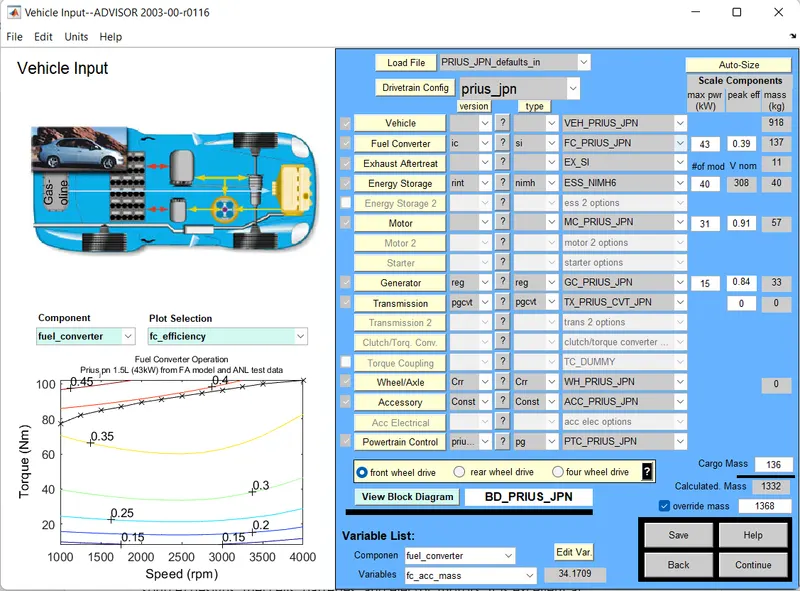
In this car, we intend to conduct a grade level test. This file can be loaded using the software's load file button. Since all data comes from actual laboratory measurements, no parameters are altered.Here I changed the speed and duration in grade test window. The representation of a window is provided below.
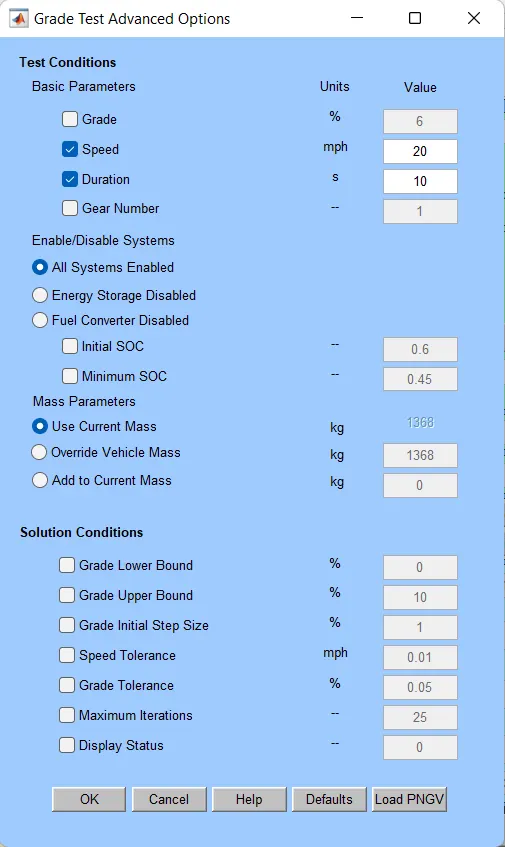
firstly kept the duration as 10s and speed changed.Result plots are illustrated below
1. speed 20mph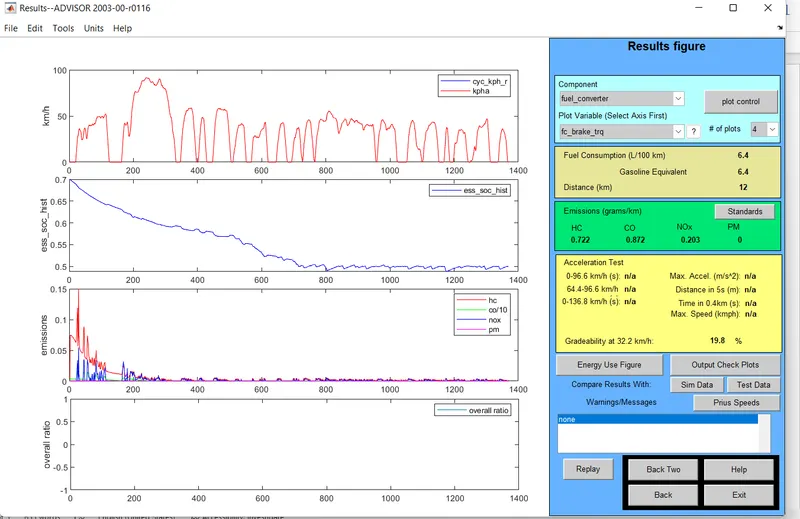
Gradeability-19.8%
2.speed -30mph
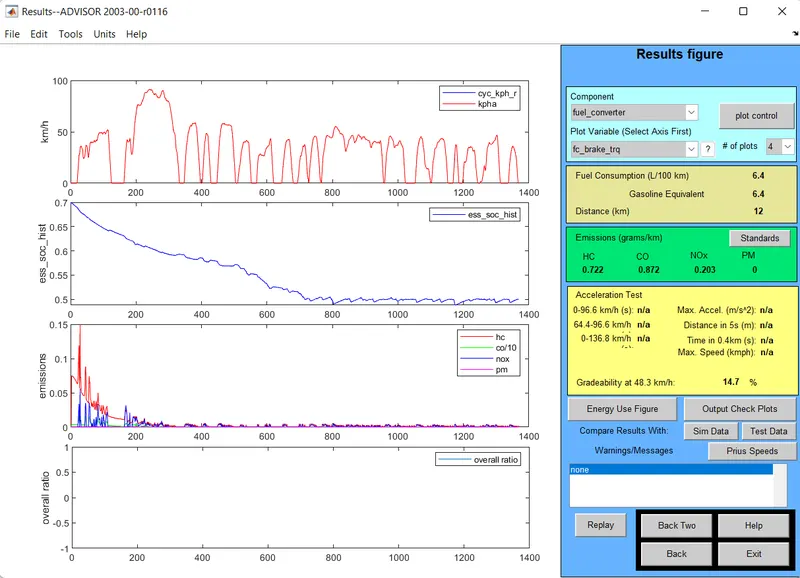
Gradeability-14.7%
3. Speed-40mph
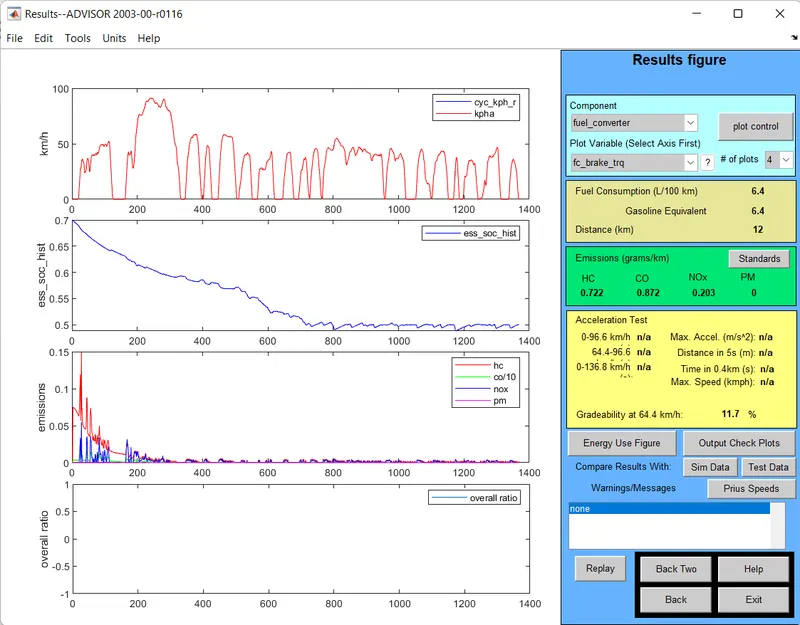
Gradeability-11.7%
4. Speed-45mph
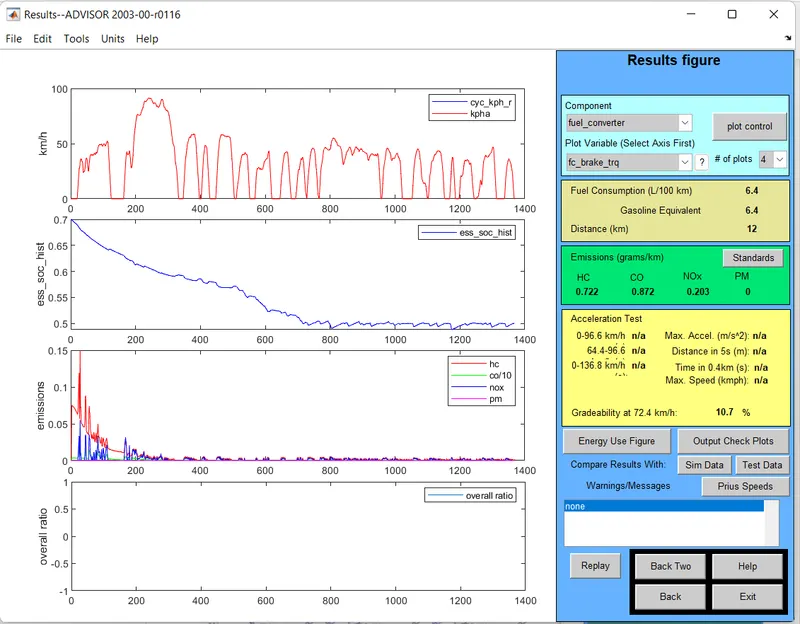
Gradeability-10.7%
5. Speed-50mph
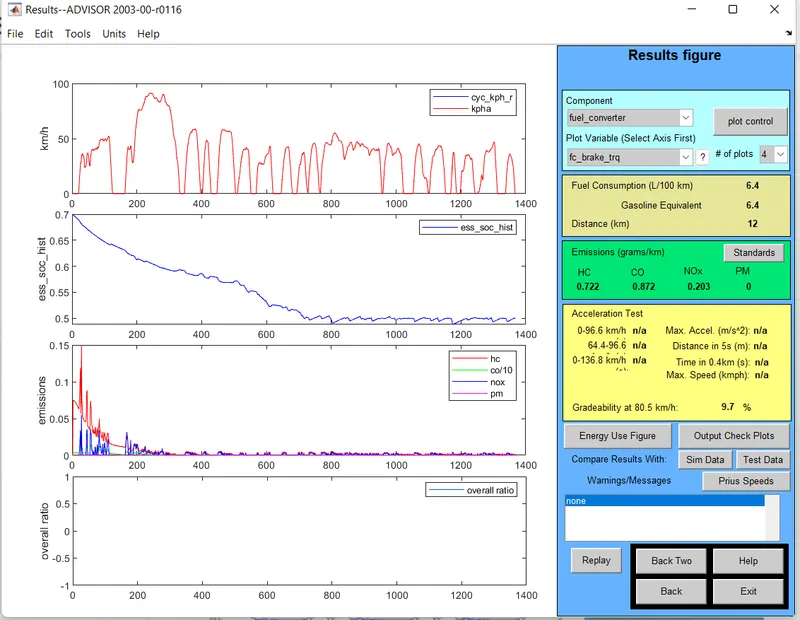
Gradeability-9.7%
Table - I(10s Duration)
| Serial No. | Speed(mph) | Speed(kmph) | Gradeability% |
| 1 | 20 | 32.2 | 19.8 |
| 2 | 30 | 48.3 | 14.7 |
| 3 | 40 | 64.4 | 11.7 |
| 4 | 45 | 72.4 | 10.7 |
| 5 | 50 | 80.5 | 9.7 |
Change the duration as 20s in above mentioned speed.
1. Speed-20mph
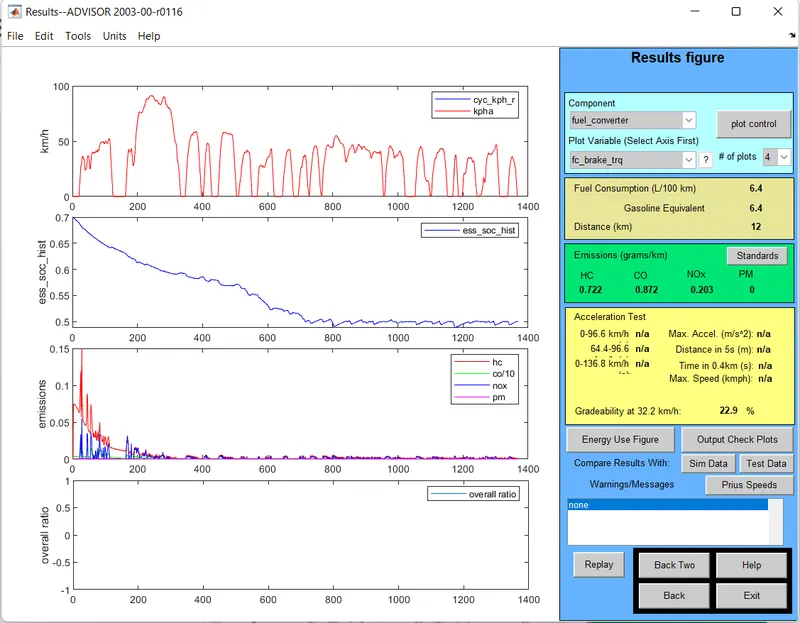
Gradeability -22.9%
2. Speed-30mph
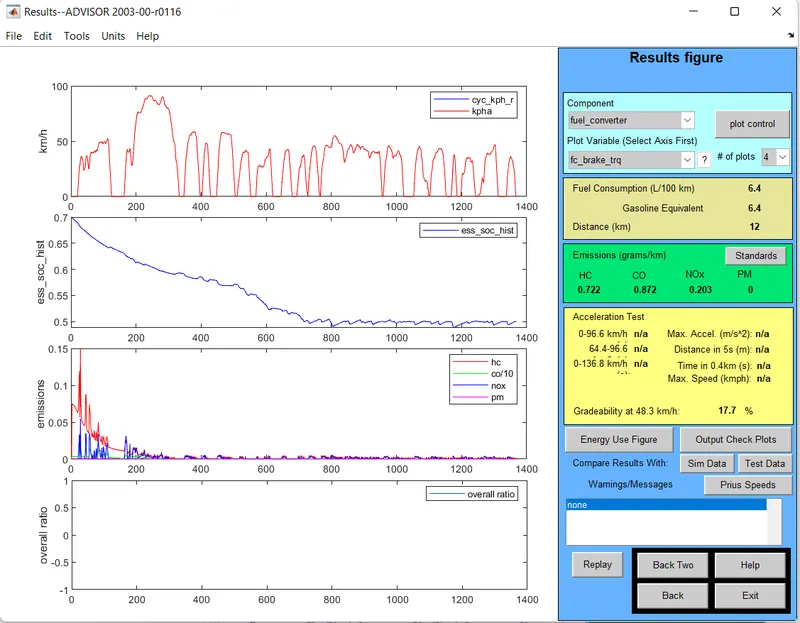
Gradeability-17.7%
3. Speed-40mph
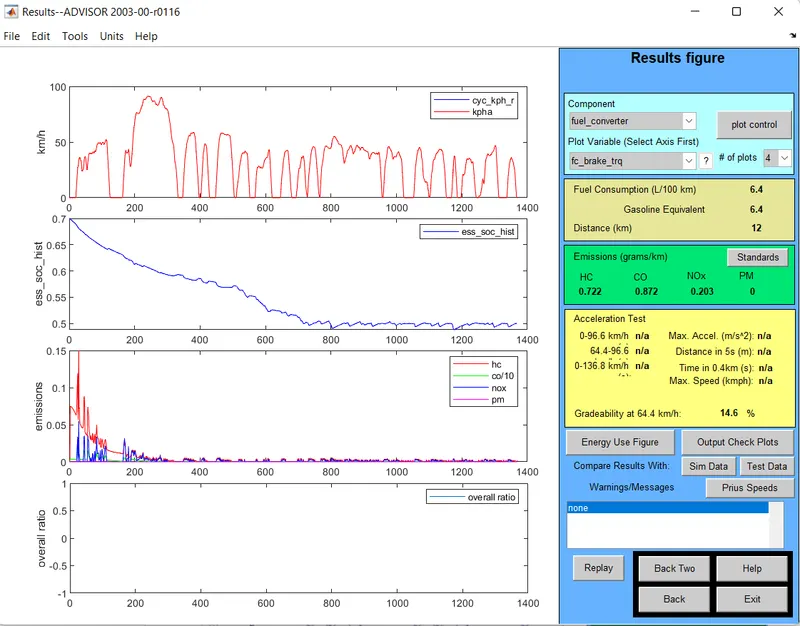
Gradeability-14.6%
4. Speed-45mph
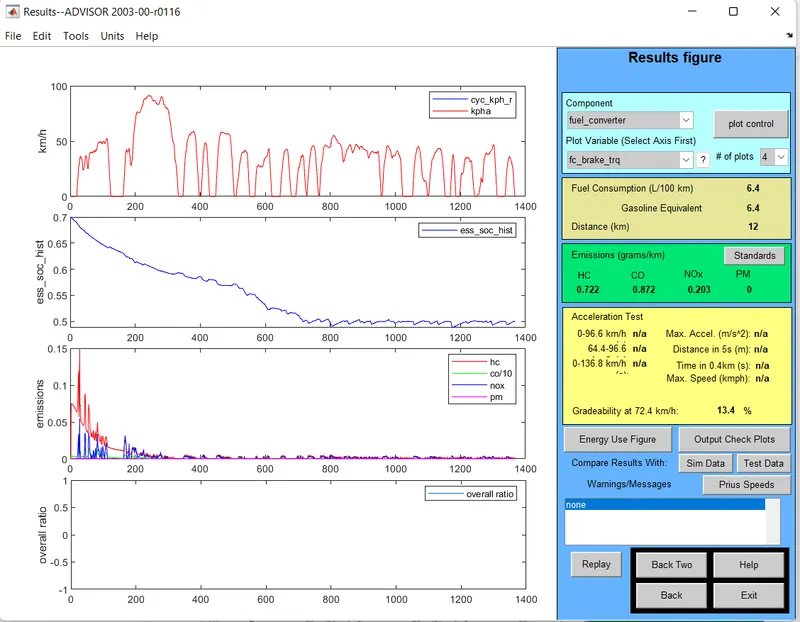
Gradeability-13.4%
5. Speed-50mph
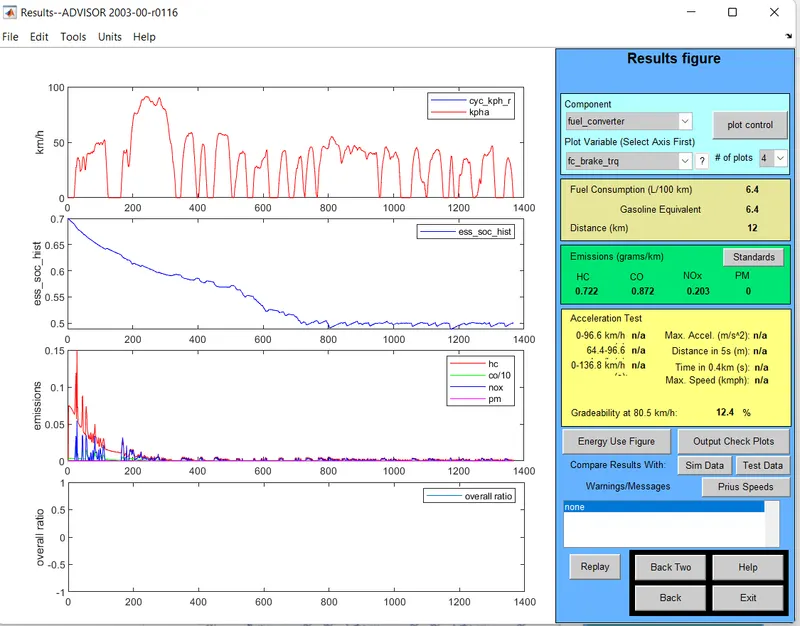
Gradeability-12.4%
Table - II (20s Duration)
| Serial No. | Speed(mph) | Speed(kmph) | Gradeability% |
| 1 | 20 | 32.2 | 22.9 |
| 2 | 30 | 48.3 | 17.7 |
| 3 | 40 | 64.4 | 14.6 |
| 4 | 45 | 72.4 | 13.4 |
| 5 | 50 | 80.5 | 12.4 |
Conclusion
Gradability decreases with increasing vehicle speed for both 10- and 20-second periods.