Week - 4
TASK 1
- Implement control logic of a “washing machine” using Stateflow as per given sequence:
- If the power supply is available, the system gets activated
- If the Water supply is not available, stop the process & indicate through LED
- Soaking time should be 200s followed by Washing time of 100s.
- Then rinsing happens for next 20s & dryer runs for 50s
After all the processes have completed turn on the finished LED
Based on the question we can use the chart block for making the stateflow Control logic. The question is clearly stated that only when the Power is ON the whole process will begin. This is followed by the availability of water supply. If these 2 conditions is not satisfied the washing machine process will not begin.
Model Explanation
The following blocks are used to make the model
- Chart
- Constant
- Display
- Slider switch (Dashboard)
- Lamp(Dashboard)
MODEL
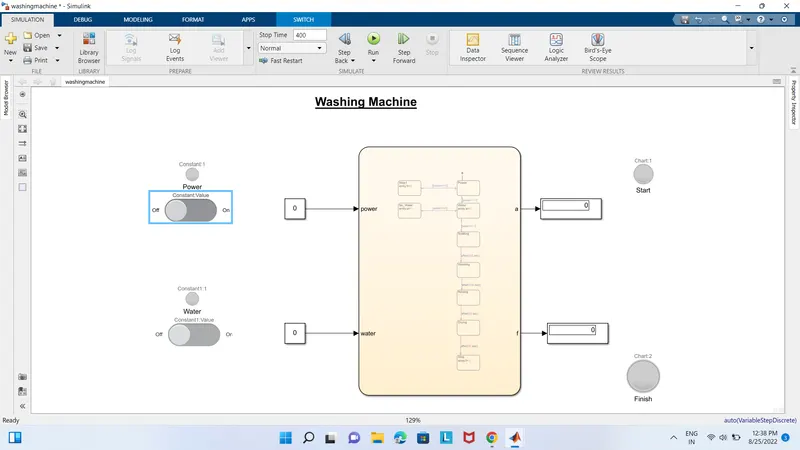
STATEFLOW CHART
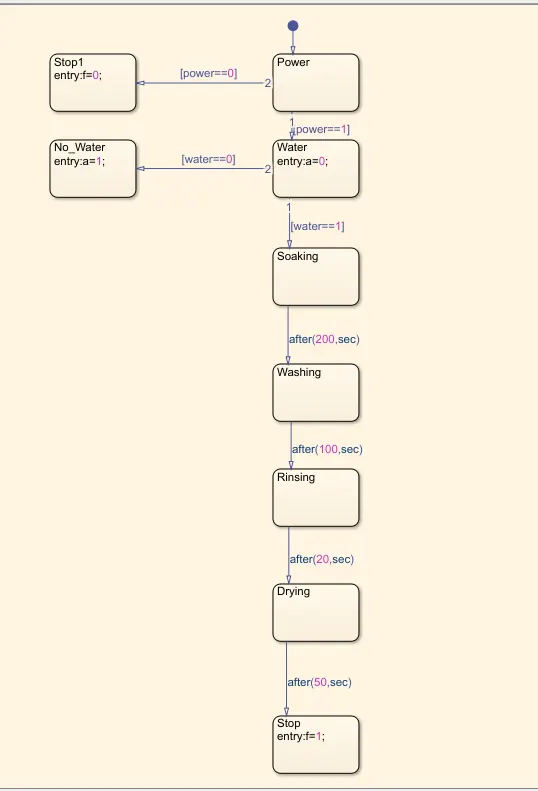
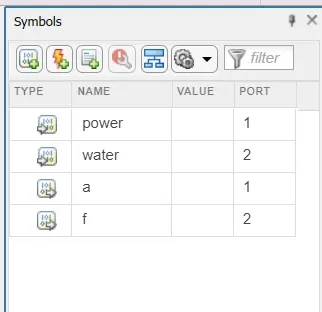
Symbol pane
Switch Connection.
In order to get a dashboard block to the model, first of all create the stateflow and make input data and and output data in symbol pane. After that select the need ful block and assign it like as follows.
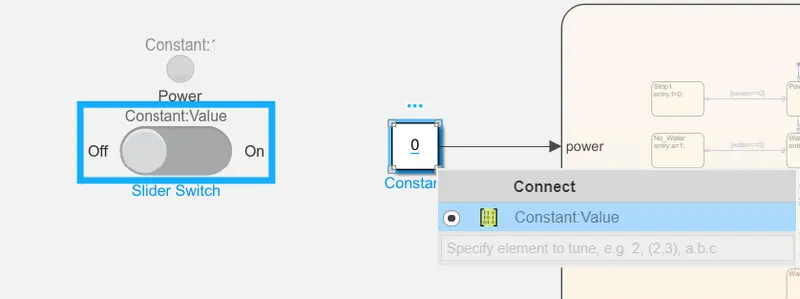
Two constant blocks are connected to the stateflow chart as inputs. Thease two constant blocks are in turn controlled by Slider switches for Power and Water. From the help of Display block, start indicator lamp and finish indicator lamp we can easily analyzed the conditions.
- If the Power supply is available and water supply is not available
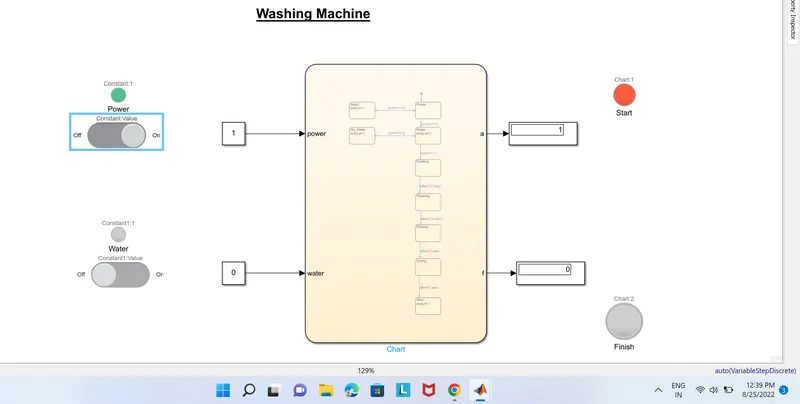
The RED Indicator indicates the system is ON but there is no water is available.
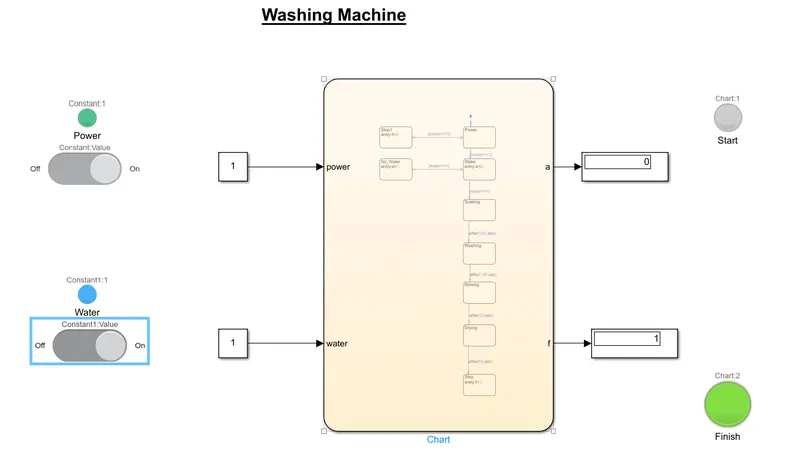
- Soaking time should be 200s followed by washing time of 100s. Then rinsing happens for next 20s & dryer runs for 50s.
The starting state of Washing machine is created with two transition conditions.
Power=1 & water=1.
That means both are ON conditions. The remaining process which takes place after the system is ON.As per the given conditions Soaking time is 200sec followed by the washing time of 100sec. The rinsing happens for next 20secs and after that the dryer is runs for 50 sec.
TASK 2
2. Make a Simulink chart for the “Gear shift” logic as per below conditions:
Speed Range(kmph) Gear
0 to 15 1
16 to 25 2
26 to 40 3
41 to 60 4
Above 61 5
Give speed input while the simulation is running & display the gear number.
Gear Shift
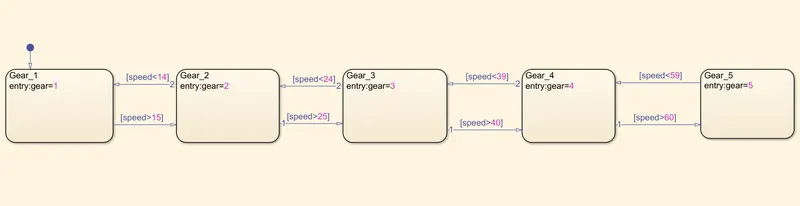
As per given condition for gear shifting we want to create a stateflow diagram. For that the chart block is used.
Model Explanation
The following blocks are used to make the model
- Constant
- Slider gain
- Chart
- Terminator
- Display(from Dashboard)
- Circular gauge(dashboard-customizable block)
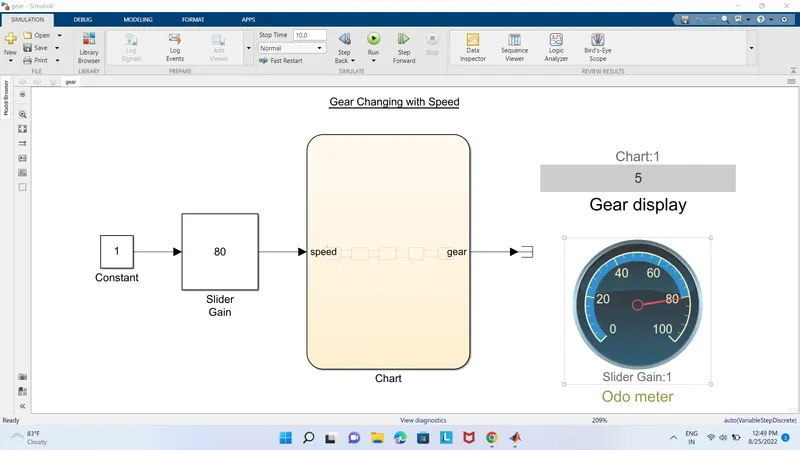
Model
Stateflow Chart
Symbol pane
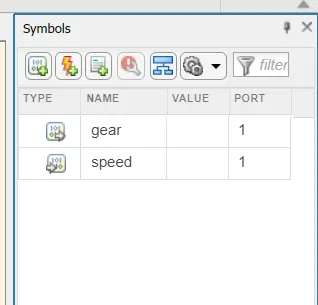
Model Explanation
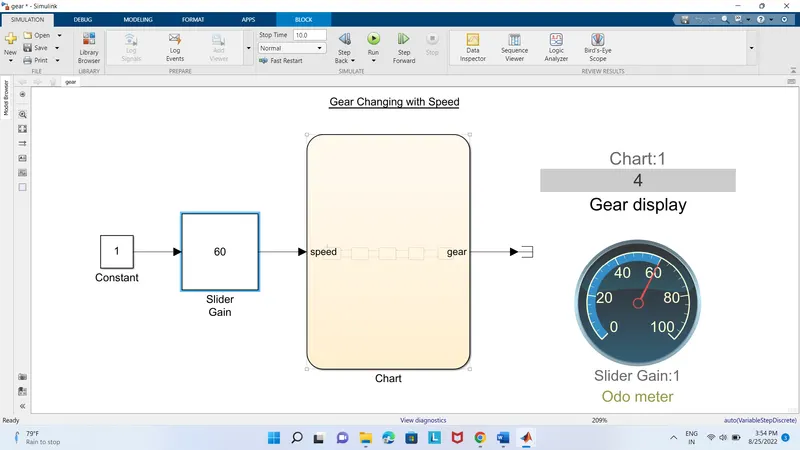
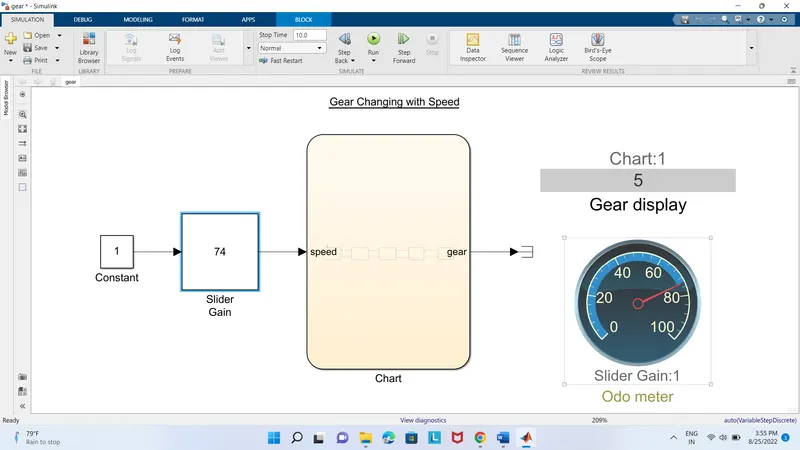
Two input blocks are here, one is the constant and other is slider gain block. The slider gain block performs a scalar gain that we can modify during simulation. The value given in the constant block gets multiplied with the slider gain value during the simulation. With the help of stateflow daigram we can find the gear shift position respect to the speed.
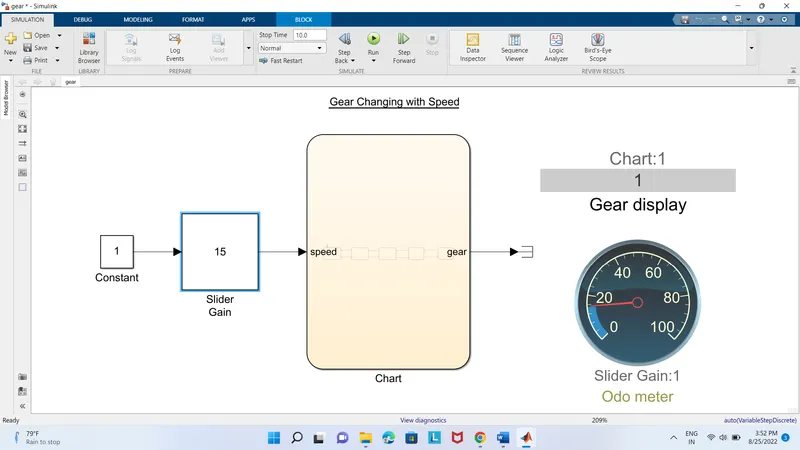
Condition 1
Speed 0 to 15, gear-1
Condition 2
Speed 16 to 25, gear-2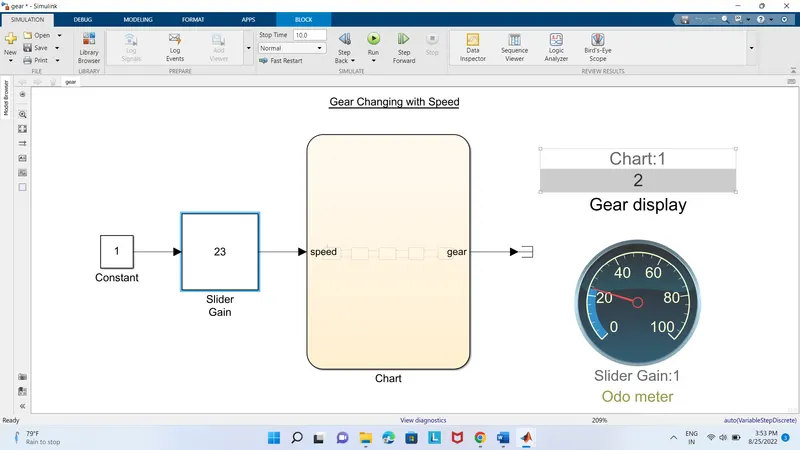
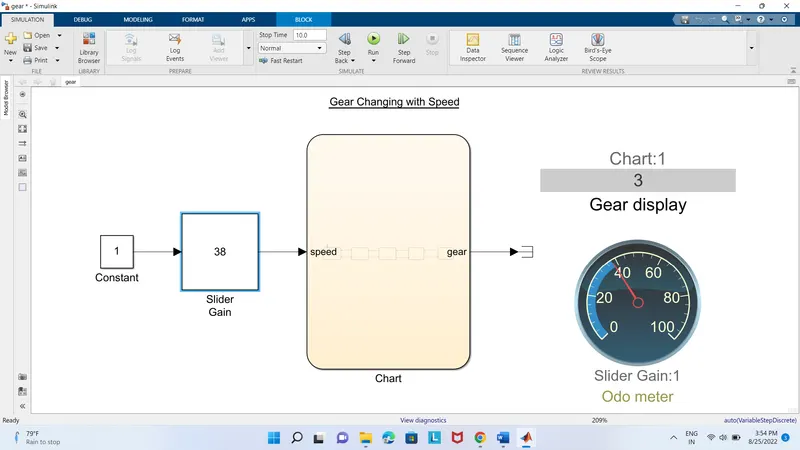
Condition 3
Speed 26 to 40, gear-3
Condition 4
Speed 41 to 60, gear-4
Condition 5
Above 61, gear-5
RESULT
Completed the two TASKs and satisfactorily run the simulink models.