Week-4 Challenge WOT Condition Part-2
1. What is the difference between mapped and dynamic model of engine, motor and generator? How can you change model type?
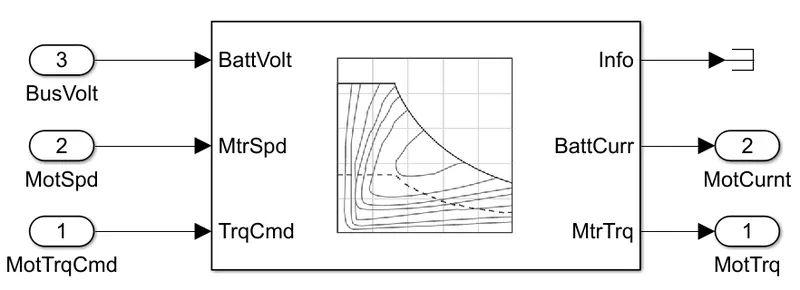
Sol: Mapped Model:
This type of model runs based on the look up tables or some predefined input values.Hence these models are not as efficient in output when compared to dynamic motor models. Although the simulation time for these kind of mapped models is very less compared to dynamic models.
To get more accurate results, one needs more accurate look up table and also needs to collect alot of information for better output for that particular mapped model.
Example of mapped motor model:
Dynamic Model:
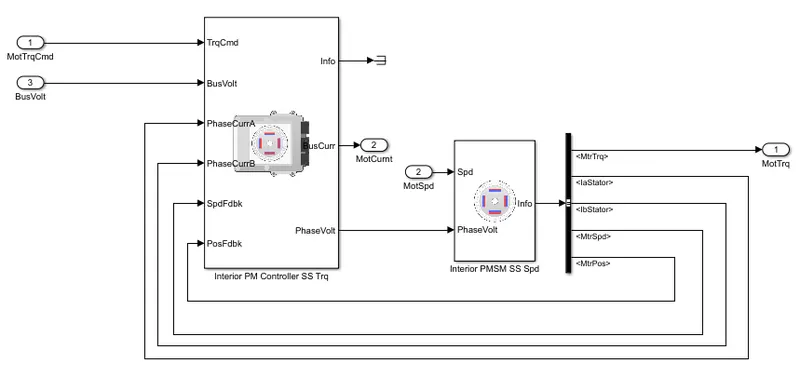
Dynamic models are nothing but a group of internal function of a particular machine represented using MATLAB or Simulink. This kind of model represents the real time working of the model. It doesnot take any predefined inputs and hence gives real time values generated from the model and provides output accordingly.
Simulation time is more compared to the mapped model as the values are generated or calculated and hence are more accurate.
In terms of differences in motor, generators or engines, the basis remains same that is for mapped model we need to feed in data into the look up tables ( for eg in terms of current, rpm, torque etc.) and for dynamic models these are generated based on the other subsystems from which these values are interpreted.
Example of dynamic motor model:
___________________________________________________________________________________
2. How does the model calculate miles per gallon? Which factors are considered to model fuel flow?
Sol: The reference model to calculate the miles per gallon was taken from Electric Vehcile Reference model available in MATLAB documents. It is shown below:
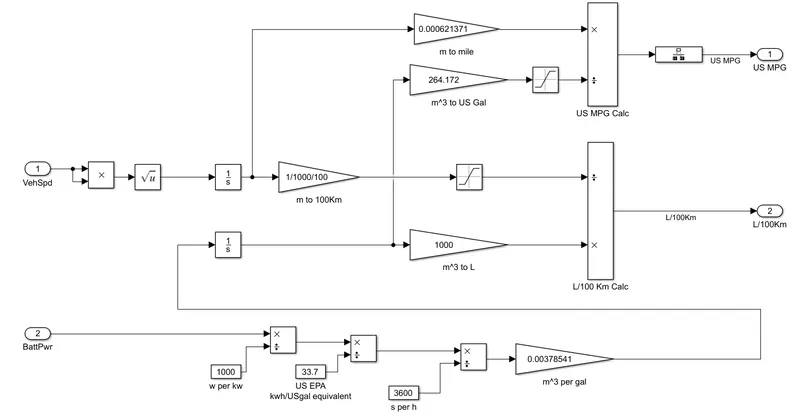
We know that since the electric vehicles only need battery as the source for energy, we can see in the above image that the inputs are basically Vehicle speed and Battery Power. The Battery power is converted in kW first and then in the next block the kW is basically converted into gallons. The following blocks convert this quantity into m3 and it is further converted to L in the following couple of blocks.
Meanwhile, on the other input, i.e vehicle speed is converted to meter and then to miles by a couple of blocks. Now the two blocks miles and US gallons are given to a product block to get the miles per gallon unit. In this way the whole algorithm for the miles per gallons is modelled for an electric vehicle.
___________________________________________________________________________________
3. Run the HEV Reference Application with WOT drive cycle. Change the grade and wind velocity in the environment block. Comment on the results.
Sol: Model Used : Hybrid Electric Vehicle Multimode Reference Application
For this simulation the following values were considered :
Grade : 10 %
Wind velocity = 20 m/s
Cycle Stop Time = 100 s
WOT start time = 5 s
WOT time to decelerate = 60 s
WOT stop time = 100 s
Below are the plots obtained:
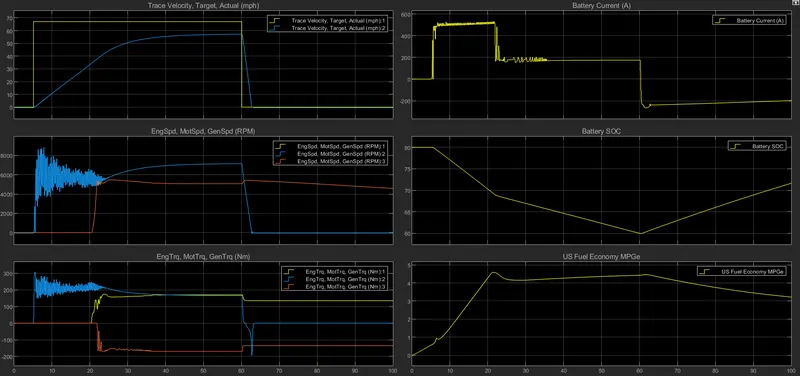
In plot 1: We can see here that the vehicle cannot reach its top speed as the wind velocity is acting against it and at 60 seconds the deceleration started and the speed of the vehicle is reduced to 0.
In plot 2: In this plot we can see the change in speed of engine, motor, & generator in rpm. We can observe the engine and motor speed reached above 8000 rpm and the generator speed reached above 5500 rpm.
In plot 3: This plot shows the variation of torque of engine, motor and generator. We can see here that till around 5 seconds, the torque of all the three elements i.e engine,motor and generator remains constant at 0 and after that the engine torque increases (as the acceleration begins) and the motor and genrator torque continue to be constant until 22 seconds. After this point the torque of genrator goes below zero and torque of motor goes up and around 40 seconds the torque of both engine and motor become same. As the deceleration time approaches at 60 seconds, the motor torque again decreases to below 0 for a brief period and then becomes zero as the battery begins to charge.
In plot 4: This plot gives the details regarding the usage of battery current where upto 5 seconds it is 0 as there is no motor used. After 5 seconds there is acceleration applied to the vehicle and the engine and the motor start utilising the current. After 22 seconds we can see that the current usage decreases as the generator starts acting as a motor providing sufficient power to move the vehicle. After 60 seconds the deceleration period begins and hence the regeneration period begins which helps in storing the current back to the battery.
In plot 5: From this plot we can easily understand the SOC of the battery at any particular point of time of the drive cycle. We can see that till 5 seconds there is no discharge from the battery and after 22 seconds, the rate of discharge is rather slowed down due to the effect of generator acting as a motor. Finally after 60 seconds, due to deceleration, the SOC goes up due to regenerative braking condition.
In plot 6: From this plot we can determine the miles per gallon (mpg) for the vehcile in given conditions. We can see that till 22 seconds the mpg capacity increases and after 60 seconds we have a decline as the motor stops to perform as the battery begins to be charged back again.
___________________________________________________________________________________
4. Keeping all other parameters same, compare the simulated results of hybrid and pure electric powertrains
Sol: Here all the parameters were kept the same as previous questions for both the models.
Hybrid Electric Vehicle Multimode Reference Application:
Electric Vehicle Reference Application:
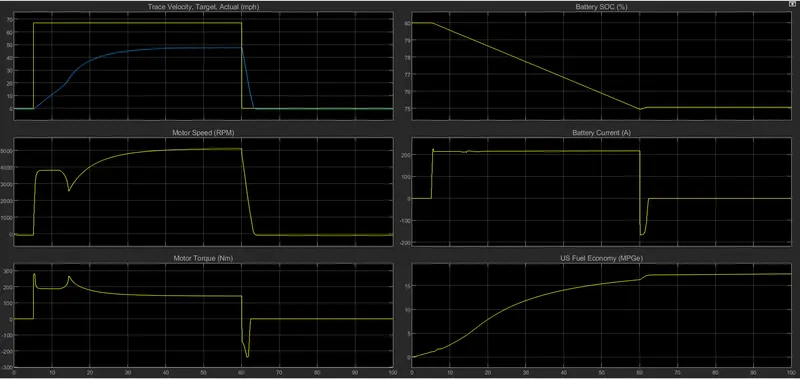
In plot 1: In EV mode we can see the velocity decreases compared with the HEV mode for the time period 5 to 60 seconds as the engine and generator are missing to provide that extra power and velocity.
In plot 2: We can see that the motor speed increases with sharp increase in velocity upto a point and then it becomes constant for a brief amount of time and then decreasing again in a short amount of time. After that the speed increases steadily and becomes constant as it approaches 60 seconds. After that the vehicle starts to decelerate causing the motor speed to come to 0 and mainitian it till the end of the cycle.
In plot 3: Here also we can see that th Torque increases with steep increase in velocity. After that for a brief amount of time it decreases and remains constant only to again increase and then maintain a constant torque until 60 seconds. After that the deceleration period begins and the torque is reduced to zero.
In plot 4: Here we can see that the SOC of the battery is much better than the HEV at the end of drive cycle. At the end of the cycle we can see that for EV the SOC remains at 75% as for HEV it is around 71%. Aslo one can notice in EV mode, that the SOC utilised during the entire drive cycle is around 5 %.
In plot 5: In this we can observe that the battery current is high during the initial stages as the motor requires higher torque to achieve the velocity and then till deceleration time, the same amount of current is drawn from the battery. Once deceleration begins, the current usage is reduced to 0.
In plot 6: We can note that the mpg factor increases through out the drive cycle for EV mode. Thus the fuel efficiency rate is much better for Evs as compared to HEVs.
___________________________________________________________________________________