Week-4 Challenge WOT Condition Part-2
QUESTION 1:
AIM: What is the difference between mapped and dynamic model of engine, motor and generator? How can you change model type?
MAPPED MODEL OF ENGINE:
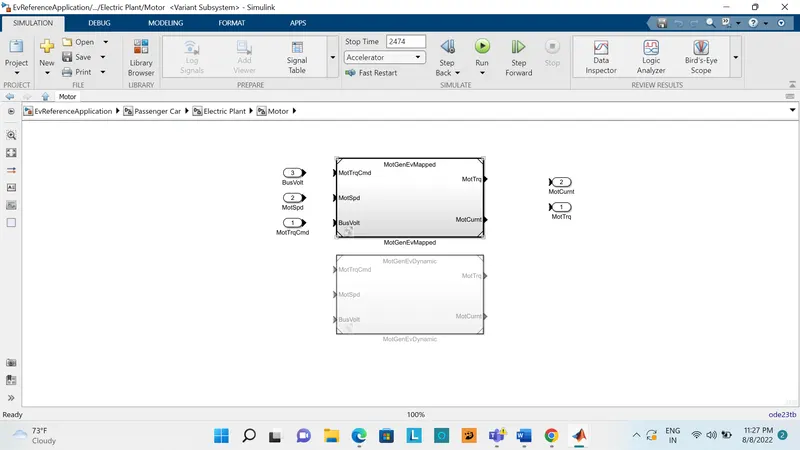
1)The mapped model is one of the model where the all data points are pre_assigned in lookup tables
2)the required torque of the motor is sensed and the required torque is generated by the motor or the engine blockit is simply without considering the real time motor or engine parameters
3)the accuracy of the system is very low but the simulation is done in much less time and as it does not run by the real time parameters
4)the output values are stored for the given input values of the engine motor and generator
MAPPED MODEL:
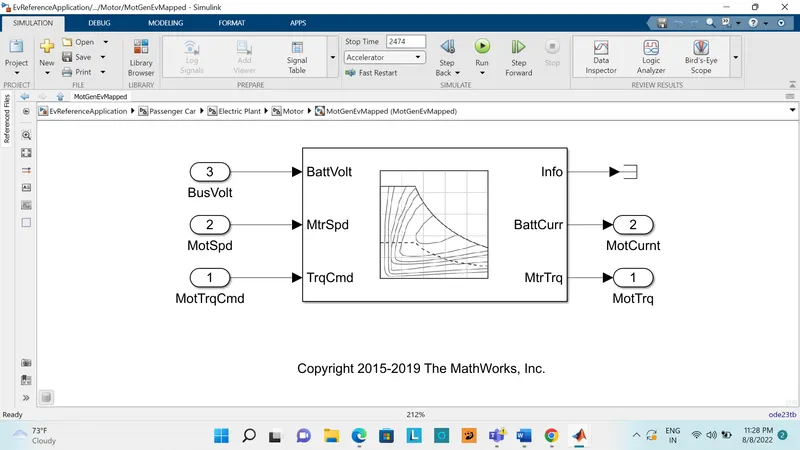
Mapped engine represent by macro engine behaviour as a set of lookup tables.(brake,torque,fuel,floe,air,nasflow,exhaust temperature,efficiency,and emissison) as function of commanded load measured engine speed.This type of models are suitable for analysis and design activities that do not require engine subsystem dyanamic characteristics for example in engine and transmission powertrain matching analysis for fuel economy ,emissions and perforamnce trade-offs.
DYNAMIC MODEL OF ENGINE:
1)dynamic model is a system to generates the output by using the combination of the outputs from the various subsystems
2)this system accuracy is very high compare to mapped model
3)and this dynamic model simulation taking long time to complete the operation as it has many individual simulation running by all the the subsystems of the engine and motor,generator
4)for the drive cycle requirements intial bus voltage and current is given along the vehicle feedback so it runs the actual simulation at the purticular moment
DYNAMIC MODEL:
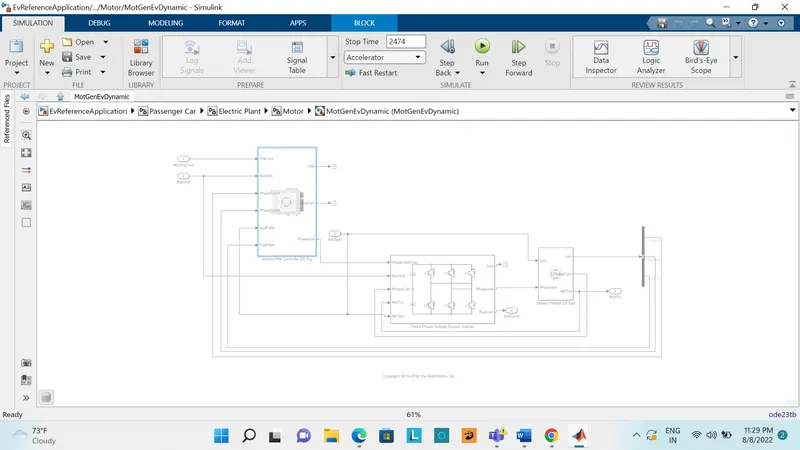
Dynamic engines are changes engine behavior into individual component model that account for engine dyanamic ,most notably imtake airflow and turbo charger dynamics.this type of models are suitable for designing the control,estimator and diagnostics,alogorothms that depends on dyanamic subsystems states,for example in closed loop air fuel ratio control algorithm development
MAPPED AND DYNAMIC MODELS OF EV MOTOR AND GENERATOR:
PROCEDURE TO FIND MAPPED AND DYNAMIC MODELS:
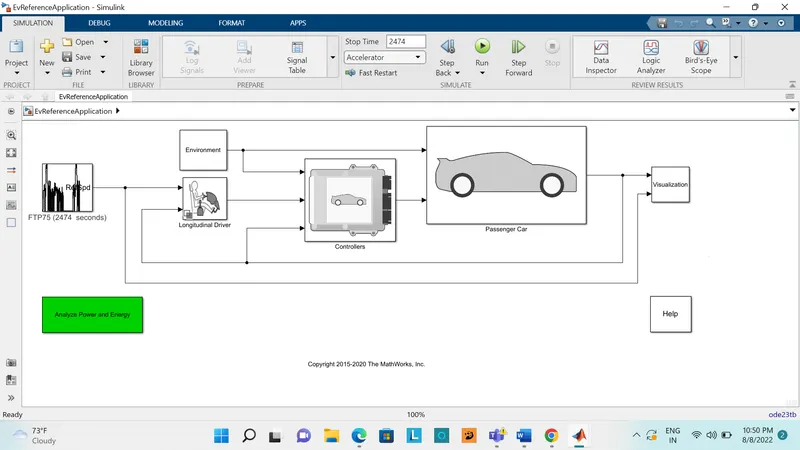
1)First open the MATLAB and search the power train block
2)Then after simulink model appears to shows the work flow blocks of the system
3)After select and double click the passenger block the new subsystem will appears
4)in the we need to go to electric plant for double click the block and another subsystem will appears
5)finally we get the EV motor,generator block
6)after this process we just right click on the block and go to varience label mode active choice motor GenEV mapped or dynamic models
EV REFERANCE MODEL:
QUESTION 2:
AIM: How does the model calculate miles per gallon? Which factors are considered to model fuel flow?
MILES PER GALLON:
Miles per gallon is nothing but the distance measured in miles for example a car can travel per gallon of fuel.and this MPG is the primary measurement of a car fuel efficiency.If the MPG value is high than the fuel efficiency is more.
For a conventional vehicle the fuel efficiency is calculated by this miles per gasollon(MPG).in hybrid electric vehicle the fuel efficiency is calculated by miles per gallon equivalent(MPEG)
PROCEDURE:
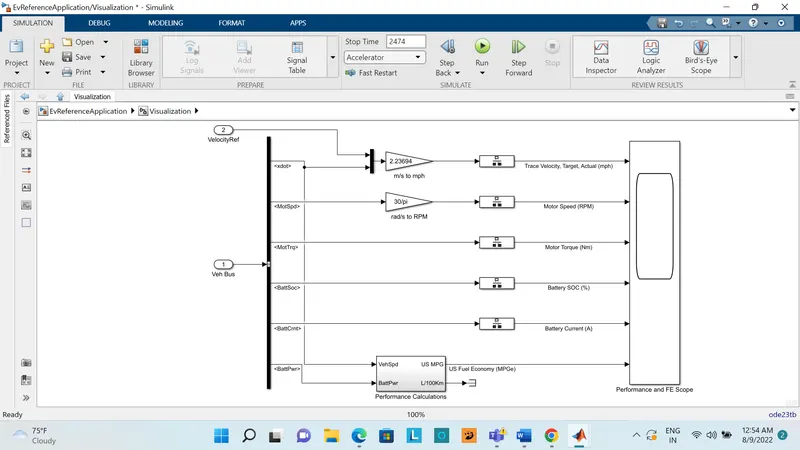
1)click on the visualization block on the ev referance application
2)than we get the performance calculation subsystem of visualization block
3)after we need to go to performance calculation block there we get the actual mpg calculations
SUBSYSTEM OF VISUALIZATION:
SUBSYSTEM OF PERFORMANCE CALCULATIONS:
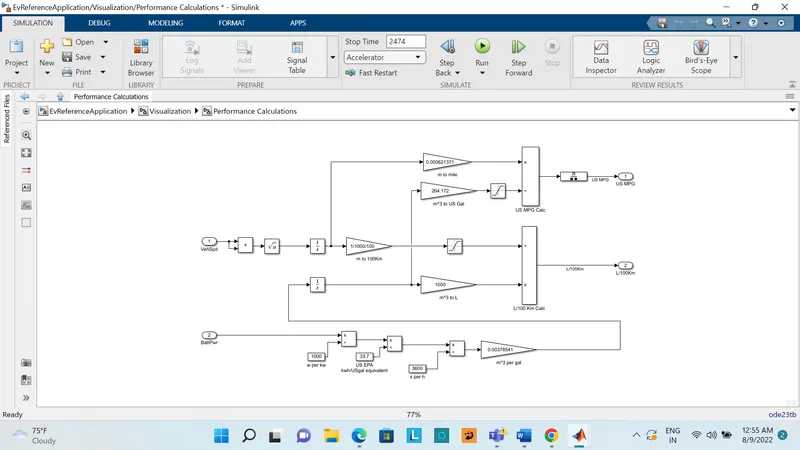
CONSIDERATION OF THESE GIVEN 3 INPUTS:
1)fuel flow
2)vehicle speed
3)battery power
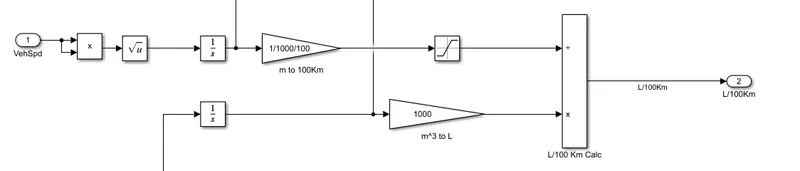
- The data of the vehicle speed is used to calculate the distance traveled in meters/kms to miles
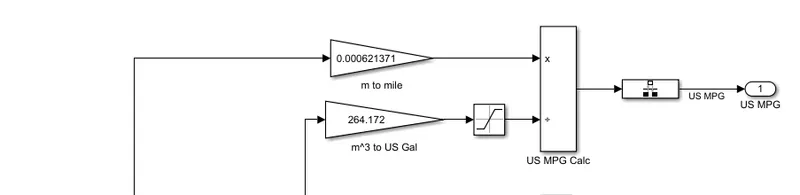
- the fuel flow is the combination of input of vehicle speed and input of battery power for calculating these two eliments we get the MPG value and that value is 33.7
- battery power is convert the power in watts to kilo watt hour(KWH) and again its converted to gasoline equivalent using US EPA value by dividing with 33.7
FUEL FLOW:
VEHICLE SPEED:
BATTERY POWER:

QUESTION 3:
AIM: Run the HEV ReferenceApplication with WOT drive cycle. Change the grade and wind velocity in the environment block. Comment on the results.
EV REFERANCE BLOCK:
Now we have to change the drive cycle source to FTP75 to WOT condition with sample time 40seconds.
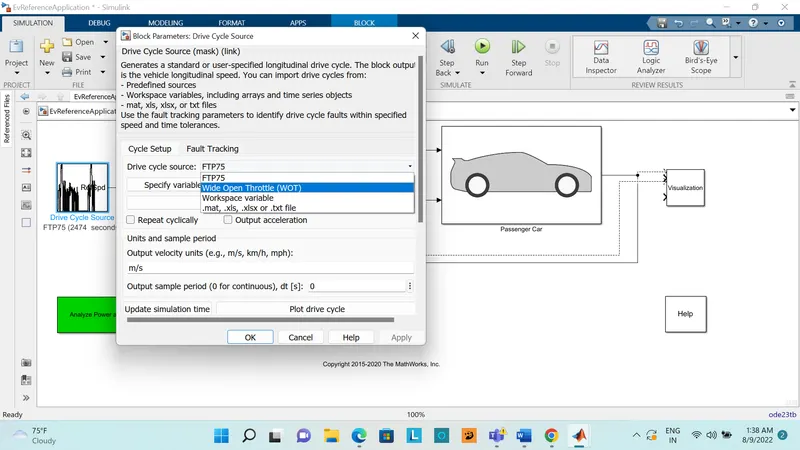
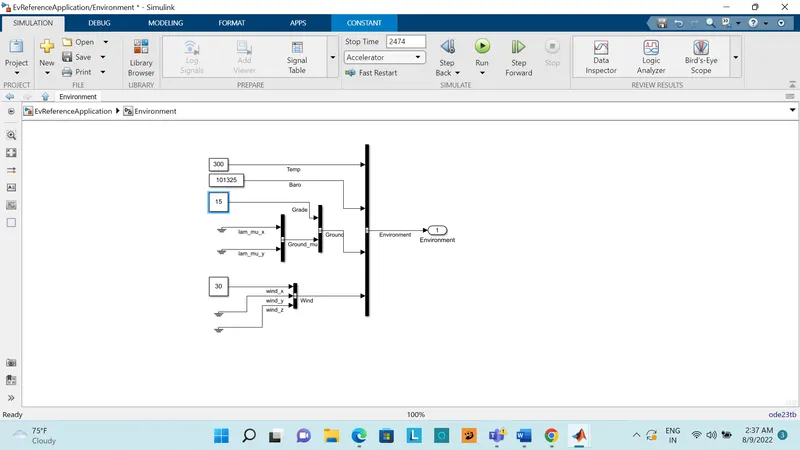
also change the environment block with wind speed of 30m/s and grade to 15
RESULTS:
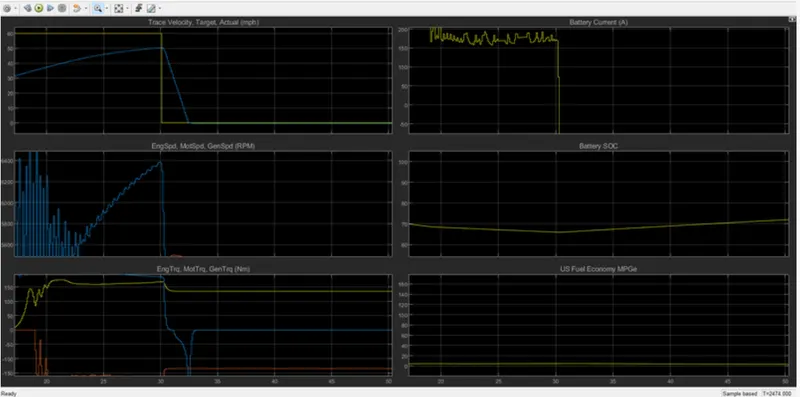
GRADE=15,WIND VELOCITY=30M/S
CONCLUSION:
1 GRAPH:
velocity&accelerate
top velocity can be achieved=50.1 mph
time taken to accelerate=29.034 sec
time taken to accelerate=2.471 sec
2 GRAPH:
motor&engine rpm
Top motor rpm=5712 rpm
Top engine rpm=5451 rpm
3 GRAPH:
Motor&engine torque
Max motor torque=306.0 N-m
Max engine torque=174.7 N-m
4 GRAPH:
The supply current of the battery maximum value is167A. it reduces to the value 150 when the full throttle is applied during the deaccealaration of the vehicle
5 GRAPH:
During acceleration of vehicle the battery soc will falls from 80 to 65% and during the deccelaration due to negative braking it increases slighylt 65 to 70%
6 GRAPH:
max fuel economy can be achieved =4.675
QUESTION 4:
AIM:Keeping all other parameters same, compare the simulated results of hybrid and pure electric powertrains.
SIMULATIONS RESULTS OF PURE EV:
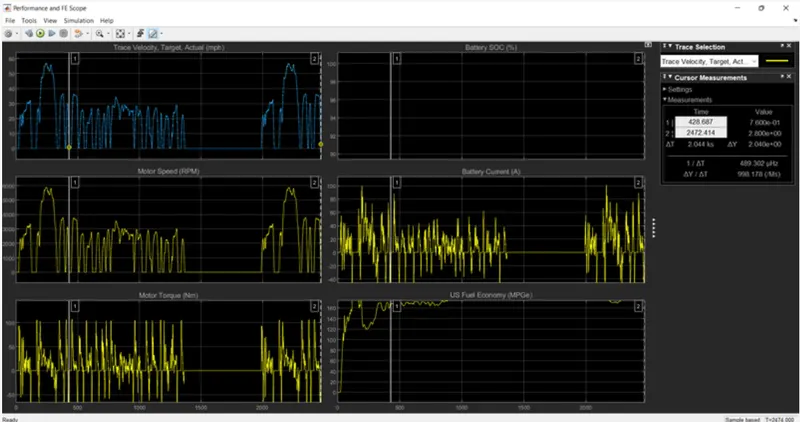
SIMULATION RESULTS OF HYBRID EV:
CONCLUSION:
1)The required peak velocity can be achieved is less in HEV compare to EV
2)In HEV the deacceleration time also less because it consist of moving parts
3)EV having the the more fuel economy compare to HEV because there is no any moving parts due to that it having less functional losses
we have succesfully complete and find the solution to the given tasks