Week-4 Challenge WOT Condition Part-2
Q.1)What is the difference between mapped and dynamic model of engine, motor and generator? How can you change model type?
Mapped Engine: Mapped Engine is the default settings in powertrain blockset. It is used to measure to measure performance parameters of the vehicle by using standard lookup tables which are prefed to the system. This type of modelling is less accurate. The lookup tables value are based on the values of brake torque, commanded torque and engine speed. If any other parameter like Input engine temperature is selected then lookup table values are also a function of the temperature parameter. The data extracted from lookup tables are: air mass flow, fuel flow, emission data, exhaust temperature and efficiency. This data is used to find out other parameters which are needed by the end user.
Dynamic Engine: This type of model uses real time data fed by the user at run time for modelling. This model is more accurate than mapped engine model. This type of model is used when the data of subsystems of a vehicle is required. We can calculate: Brake torque, fuel flow, port gas mass flow, exhaust temperature, exhaust mass flow rate and exhaust emissions,
Mapped Motor: The mapped motor works in torque control mode. This type of motor is used when the user requires a faster simulation and doesn't have the knowledge of motor parameters. The output torque and reference torque is compared and changes are made. Input torque or speed can be specified, electrical losses and maximum motor power and torque can be defined
Dynamic Motor: In the dynamic motor a three phase interior permanent magnet synchronous motor (PMSM) is used. block uses three phase input voltages to regulate the individual phase currents, allowing control of the motor torque or speed. This block is used when the user knows what parameters are to be used in that particular simulation. This motor is more accurate.
Mapped Generator: The mapped generator block is also similar like other blocks. Most of the data required is taken from the lookup tables corresponding to the given input parameters. Its simulation time is less.
Dynamic Generator-The dynamic generator involves user entering the parameters manualy during the run time for their particular applications. The results take time and are more accurate
Changing Model Type-
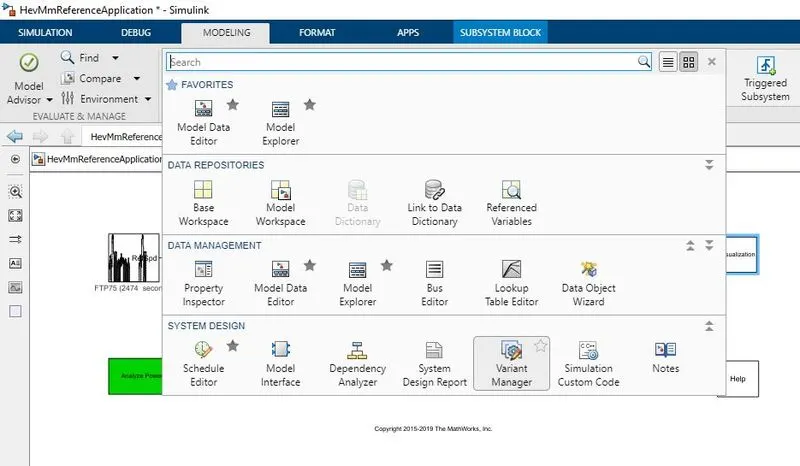
- Go to modeling tab.
- Click on drop down list in design.
- Select varient manager.
- Varient manager window will open.
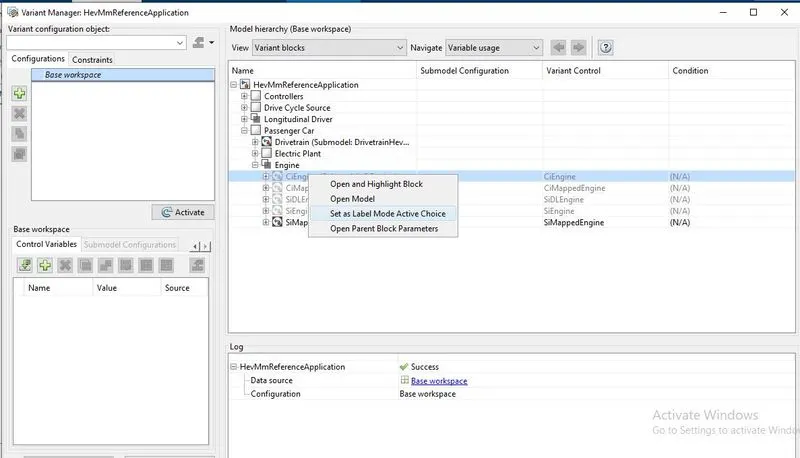
- Expand passanger car > Engine
- Right click on model which you want to set as active.
- Select 'Set as Lable Mode active choice
Q.2) How does the model calculate miles per gallon? Which factors are considered to model fuel flow?
Miles Per Gallon(MPG)-
Miles per gallon is the distance a car can travel in per gallon of fuel. MPG is the primary measurement of car’s fuel efficiency. The higher the MPG, the more fuel efficient it is.
Miles per gallon equivalent (MPGe)-
One gallon of burned gasoline produces 115000 units of British Thermal Units (BTU). Producing same amount of heat will required 33.7 kWh of electricity.
The MPGe is the distance a car can travel on 33.7 kWh of electricity. If a car travels 50 miles on 33.7 kWh of electricity then the MPGe for that car is 50.
This is equivalent to a IC engine var traveling 50 miles in 1 gallon of gasoline.
MPGe Calculation-
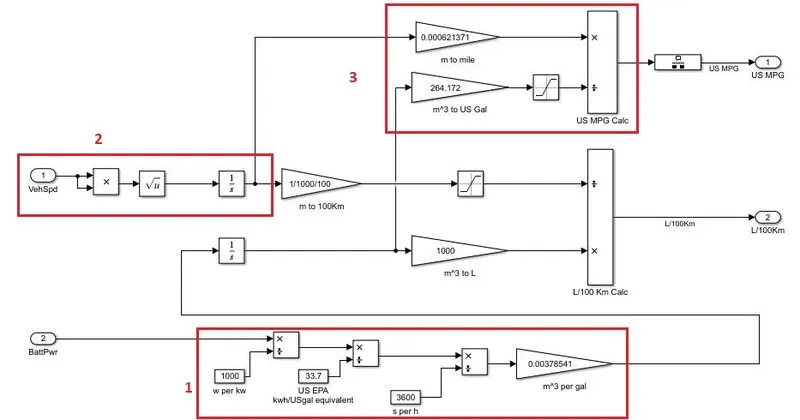
Figure shows the MPGe calculation subsystem.
- There are two inputs for the MPGe calculation- Vehicle Speed & battery power.
- Now, refer box 1 in the fig. Here input is battery power which in watts.
- These watts are converted into kW by dividing it 1000.
- Further, the kWh are converted into equivalent gallons by dividing them by 33.7 (As 1 gallon of gasoline = 33.7kWh of electricity)
- To convert per hour to per second divide this by 3600.
- Gallons are converted into meter cube by multiplying gallons by 0.00378541(Conversion factor for gallons to meter cube for gasoline).
- As this meter cube f gasoline is instantaneous quantity, the equivalent fuel consumption is found out by using an integrator block.
- Now refer box 2. Here, the input is vehicle speed which is in m/s.
- Distance travel by the car is obtained by integrating the speed.
- The distance in meters is converted into miles using a gain block having gain value of 0.000621371(Conversion factor for meters to miles).
- Gasoline used by the car is converted to gallons by using a gain block having value 264.172(Conversion factor).
- Now, distance travelled by car in miles is divided by equivalent of gasoline consumed to get Miles Per Gallon equivalent the car.
Q3) Run the HEV ReferenceApplication with WOT drive cycle. Change the grade and wind velocity in the environment block. Comment on the results.
Case1-
Steps-
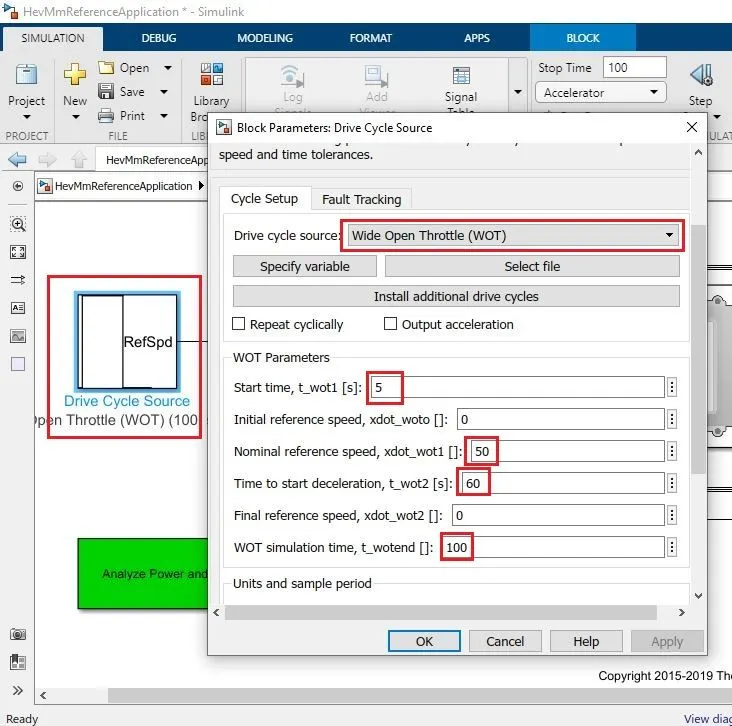
- Open HEV ReferenceApplication model from help.
- Open block parameters of Drive cycle block.
- Select Wide Open Throttle from drive cycle source drop down list.
- Enter start time, Nominal reference speed, Time to start deceleration, WOT simulation time as 5, 50, 60 and 100 respectively.
- Click apply and then OK.
- Enter stop time as 100 seconds.
- Run the model.
Observation-
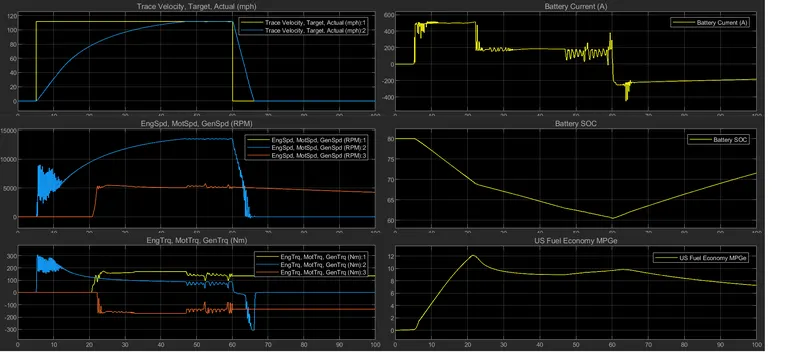
- The step signal for velocity is applied to the model at time t=5 sec.
- As soon as the WOT is applied the vehicle, the motor also starts running and its speed (RPM) increases in exponential manner.
- With increasing motor speed car velocity also starts increasing.
- At starts motor draws power from only the battery. The battery current is almost 500 amps during this time.
- The battery SOC rapidly decreases as motor draws power from the battery.
- The MPGe increases with time.
- After time t= 20 seconds engine start running which also drives the generator.
- Now power required to drive the car is provided by both the engine and electric motor.
- As power requirement is shared, the current drawn by the motor from the battery falls below 200 amps.
- The battery SOC deceases but now with lesser rate of discharge.
- MPGe of the car decreases but remains almost constant after that.
- Car attends its top speed at time t= 46 seconds and continues to run at that speed for next few seconds.
- At time t=60 seconds WOT condition is removed. The car starts decelerating.
- Electrical motor also decelerates and reaches zero.
- But engine and generator continues to run.
- During deceleration vehicle enters the regenerative braking mode and thus battery current becomes negative i.e. battery starts charging and battery SOC increases.
Case 2-
Steps-
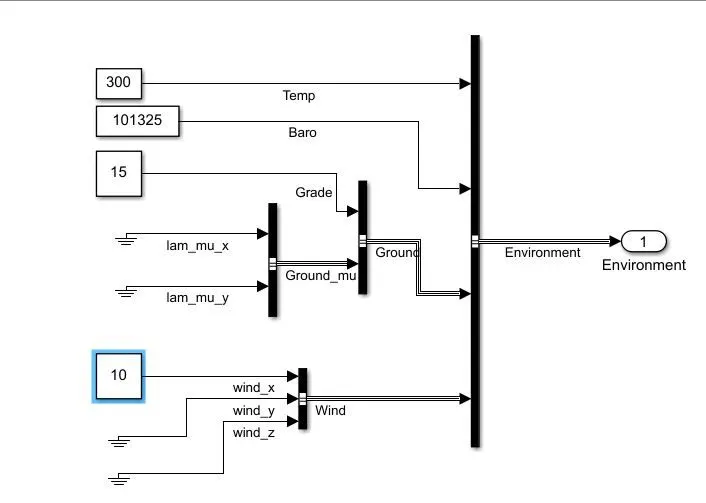
- Keep all the previous parameters unchanged.
- Open environment block.
- Enter grade value 15 and wind velocity as 10.
- Run the simulation and observe the result.
Observation-
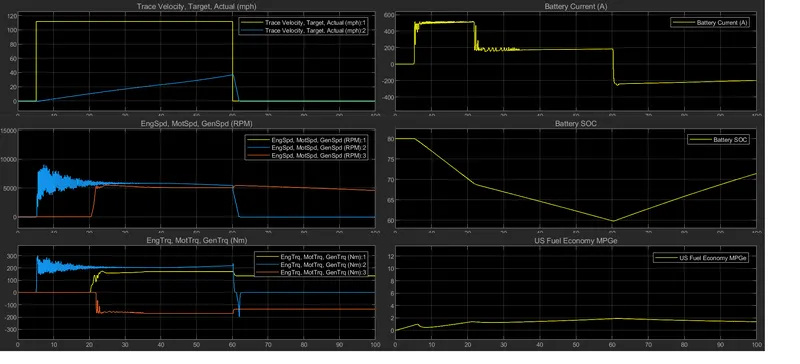
- Similar to case 1 WOT condition is applied at time t=5 sec.
- Motor speed increases and oscillates around 5000 RPM.
- Motor draws power from battery only and battery SOC starts decreasing rapidly.
- At time t= 20 seconds engine starts which drives the motor.
- The MPGe increases with time.
- After time t= 20 seconds engine start running which also drives the generator.
- Now power required to drive the car is provided by both the engine and electric motor.
- As power requirement is shared, the current drawn by the motor from the battery falls below 200 amps.
- The battery SOC deceases but now with lesser rate of discharge.
- MPGe of the remains almost constant after that.
- The velocity of the car increases during this time but acceleration is much less than the case 1 due to hill climbing force and aerodynamic drag.
- And thus, car is able to reach the maximum velocity of 36.8 mph at t=60 seconds which is end of WOT condition.
- At time t=60 seconds WOT condition is removed. The car starts decelerating.
- Electrical motor also decelerates and reaches zero.
- But engine and generator continues to run.
- During deceleration vehicle enters the regenerative braking mode and thus battery current becomes negative i.e. battery starts charging and battery SOC increases.
Q.4) Keeping all other parameters same, compare the simulated results of hybrid and pure electric powertrains.
EV Reference File-
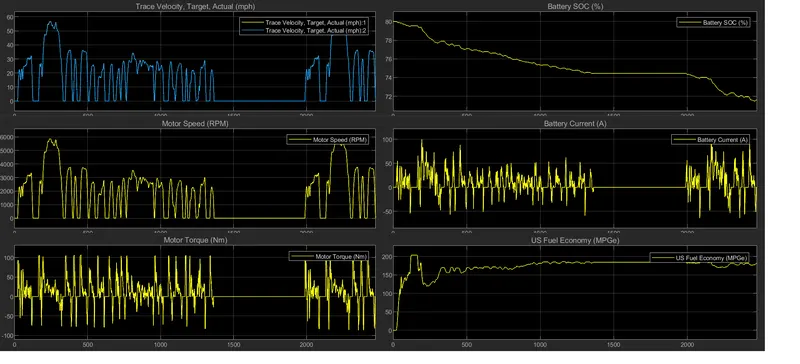
- As observed from the graph trace velocity and target velocity follow each other.
- Motor RPM also varies with the target velocity.
- During acceleration motor draws power from the battery.
- While decelerating car enters into regenerative braking region and supplies power back to the battery.
- Battery SOC decreases during the entire driving cycle.
- The MPGe for the car initially increases, reaches up to 200 and falls.
- After that MPGe oscillates around 190.
HEV Reference File-
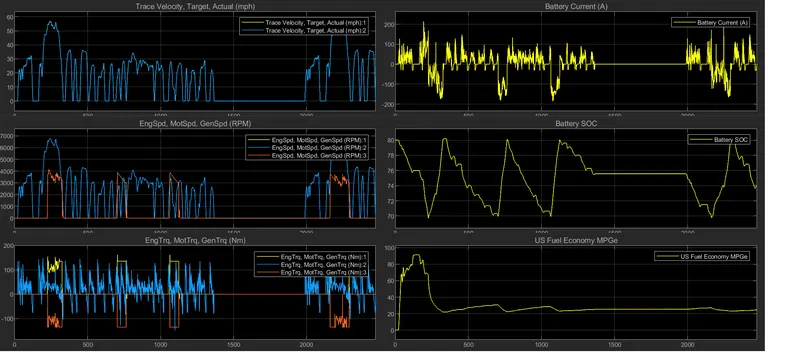
- Initially motor draws from battery only.
- As observed from the graph trace velocity and target velocity follow each other.
- Motor RPM also varies with the target velocity.
- While decelerating car enters into regenerative braking region and supplies power back to the battery.
- During the driving cycle battery SOC decreases. When it falls to 70% engine starts and it charges the battery.
- When battery SOC again reaches to 80% value engine stops and battery SOC start falling again.
- Initially MPGe reaches up to 90. When engine starts MPGe falls upto 25 and remains constant through out the driving cycle.