Week - 4
- Implement control logic of a “washing machine” using Stateflow as per given sequence:
- If the power supply is available, the system gets activated
- If the Water supply is not available, stop the process & indicate through LED
- Soaking time should be 200s followed by Washing time of 100s.
- Then rinsing happens for next 20s & dryer runs for 50s
After all the processes have completed turn on the finished LED
Theory:
The given model of washing machine has 4 states-
- Soaking
- Washing
- Rensing
- Drying
Machine changes its state from one state to another when certain condition is fulfilled(i.e. time duration). Machine requires two inputs- power and water supply.
Blocks used-
- Signal Editor
- Chart
- Display
- Lamp
Model Explanation-
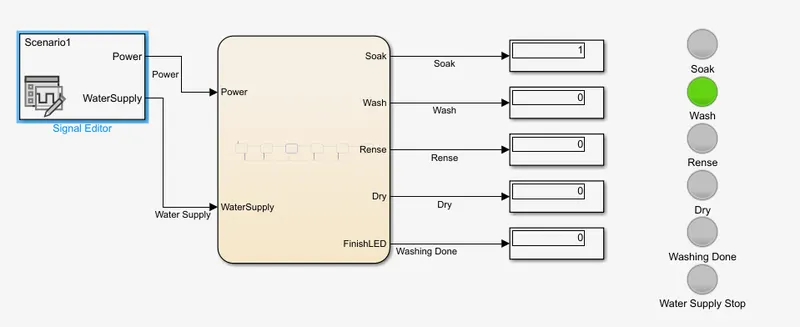
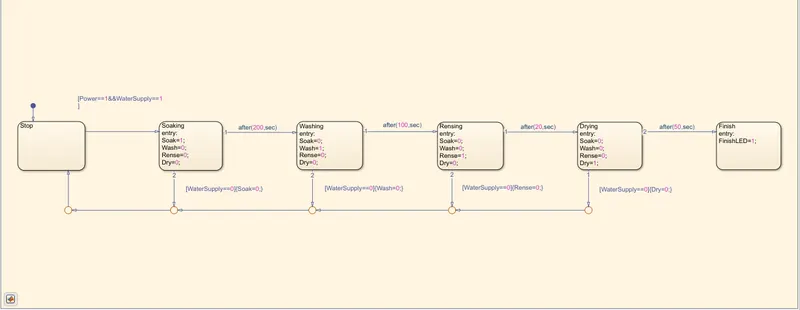
In the model attached, a signal editor block is used to simulate the power and water supply input to the washing machine. Two types of scenarios are simulated using signal editor block.
- Scenario 1 –
The power and water supply is available through out the entire cycle of the washing machine. Soaking time should be 200s followed by Washing time of 100s. Then rinsing happens for next 20s & dryer runs for 50s.
- Scenario 2 –
The power supply is available through out the entire cycle of the washing machine but, water supply cuts after 200 seconds after starting the operation.
The chart has 6 states-Stop, Soaking, Washing, Rinsing, Drying and Finish.
Each state has 4 variables-Soak, Wash, rinse and Dry. They are defined as the output data types. During each state, the variables associated with that particular state becomes 1 i.e. ON all other variables become 0 i.e. OFF. After remaining the state for defined time the model changes its state. Similarly the entire process gets completed.
If water supply gets cut during any of the state, that particular states becomes OFF and control is shifted to OFF state.
In the Simulink environment, each chart output is connected to a lamp. When that particular output becomes active, the lamp associated with it glows.
- Make a Simulink chart for the “Gear shift” logic as per below conditions:
Speed Range(kmph) Gear
0 to 15 1
16 to 25 2
26 to 40 3
41 to 60 4
Above 61 5
Give speed input while the simulation is running & display the gear number.
Blocks Used-
- Slider Gain
- Chart
- Display
Model Explanation-
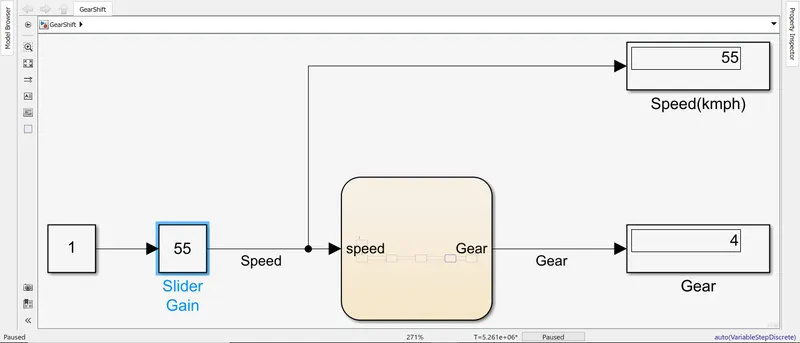
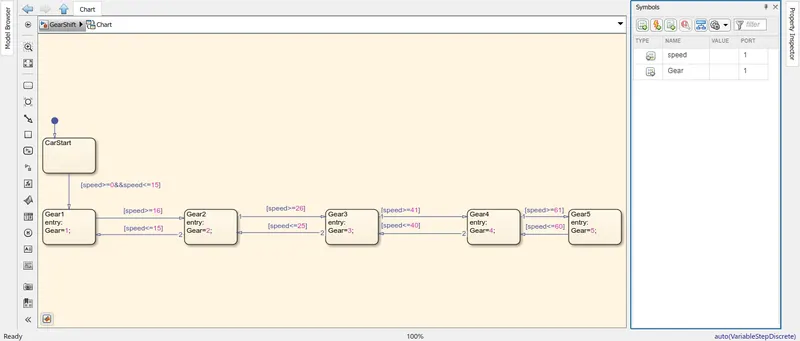
In this model a slider gain block is used to simulate the speed of the car. This speed is input to the chart. The car has 5 states- Gear1, Gear2, Gear3, Gear4, Gear5. When the value of speed comes in the range of the particular gear as given in the question, the state associated with that speed become active and value of variable gear becomes equal to the gear number. The variable gear is defined as the output data type in the chart.
Speed and gear number are displayed on two separate displays in the Simulink environment.