Week-4 Challenge WOT Condition Part-2
1.What is the difference between mapped and dynamic model of engine, motor and generator? How can you change model type?
ANS-
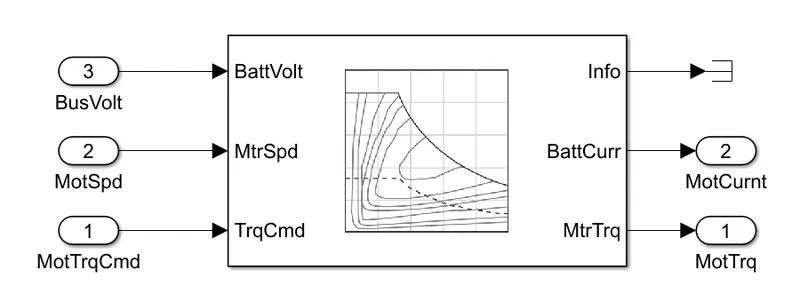
Mapped Model-
1.Model uses a set of steady-state lookup tables to characterize engine performance.
2.In this output is given by the preassigned values from the lookup table.
3.The model take low simulation time than dynamic model as it takes the real time parameters.
4.In this model output values can be stored.
5.Accurracy is not very high.
Below image shows the mapped model.
Dynamic Model-
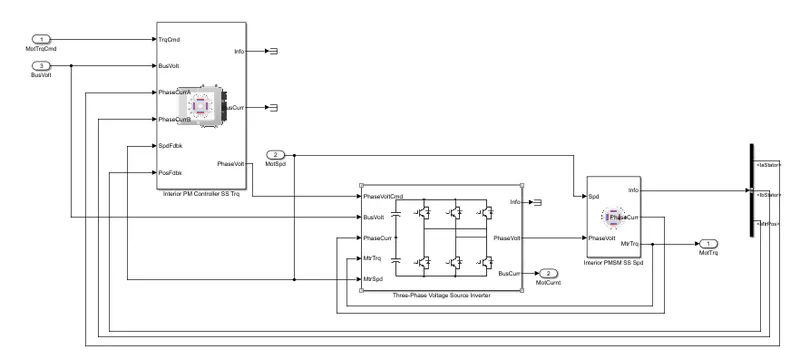
1.Model decomposes the engine behavior into engine characteristics that are separated into lower-level components. By combining components in this way, the models capture the dynamic effects.
2.This model uses the combination of the output from various subsystems to generate the output.
3.This model take very high time for simulation as it is combination of various subsystems.
4.Accuracy of the model is very high as it takes the output of various subsystems.
Below image shows the dynamic model
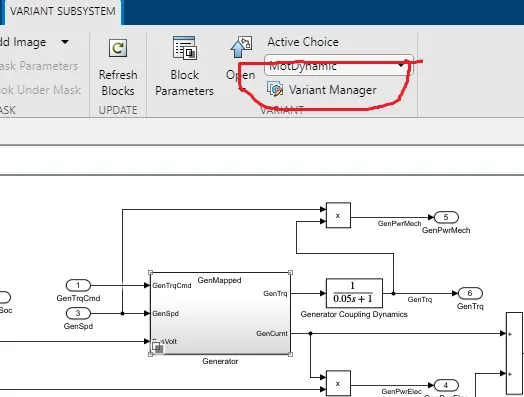
Please follow the below steps to change the model from mapped to dynamic model-
1.In power train block set click on the passanger car block
2.After that click on the electrical plant block.
3.After that click on motor/generator block after that select varient manager option as shown below
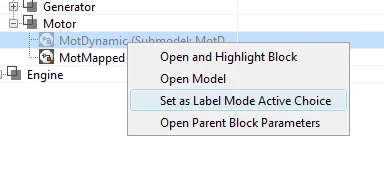
4.In that select the dynamic model as varient label mode active as shown below.
2.How does the model calculate miles per gallon? Which factors are considered to model fuel flow?
ANS-
What is miles per gallon?
1.Miles per gallon is fuel economy or average of the vehicle whic says how far the vehicle can travel for that much of fuel.
2.in case of electric vehicle it tell us the energy required to move the vehicle.
3.Given power train block set has a module that calculate the miles per gallon for vehicle the module is as below.
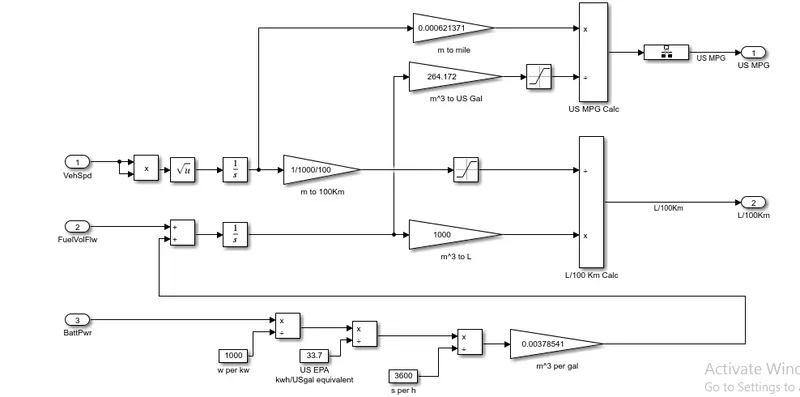
1.To calculate the miles per gallon wo factor must be considered as we know speed and distance are two important factor to calculate the miles per gallon
2.To calculate the distance we have to integrate the speed after that it converts from miles to meter
3.Then model convert the baattery power to kwh and as per US environmental protection agency(EPA) 1gallon is equal to 33.7kwh.Then convert hour to seconds.
4.Then we get m3per gallon then we have to divide the distance to the gallon required then we can get the miles per gallon.
3.Run the HEV ReferenceApplication with WOT drive cycle. Change the grade and wind velocity in the environment block. Comment on the results.
Ans-As shown in below select the WOT drive cycle inout the parameters.
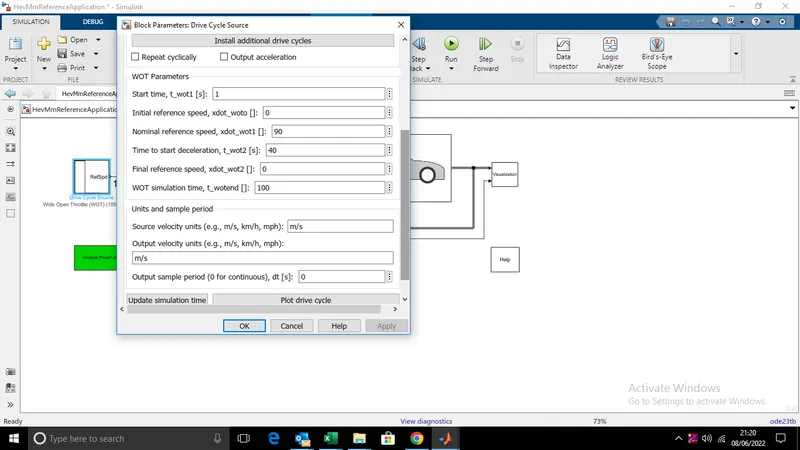
Run the model after as below plots are shown as output
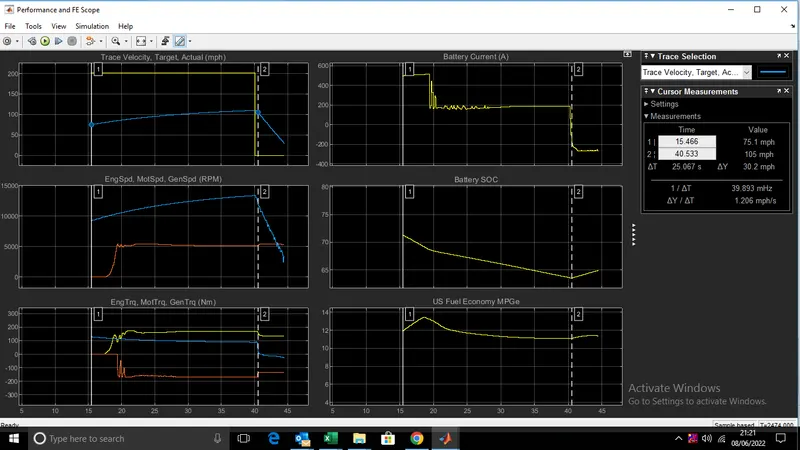
Above 6 plot shows the behaviour of the HEV motor
1.Plot 1 -
- Plot 1 shows the graph of trace velocity and target velocity with respect to time.
- For reach the vehicle to the mximum velocity it required 24.41s
- For decceleration it required 5.013s
2.Plot 2-
- Plot 2 shows the Engine,motor and Gen speed in RPM
- Maximum Engine RPM is 5405 RPM
- Maximum Motor Speed is 13374 RPM
- Maximum Generator RPM is 5405 RPM
3.Plot 3-
- Plot 3 shows the Engine torque motor torque and generator torque with respect to time through out the drive cycle in Nm
- Peak engine torque is 170Nm
- Peak Motor Torque 80Nm
- Peak generator torque 0Nm
4.Plot 4-
- Plot 4 shows the Battery current in Ampere
- Battery start to discharge from 510.8Amp
- Battery start charge from -253.5Amp
5.Plot 5-
- Plot 5 shows the battery SOC
- Baatery state of charge discharge from 71% to 61% in 24.67 sec
6.Plot 6-
- Plot 6 Shows the fuel economy
- Vehicle can travel 13.4miles per gallon.
In case we will consider the conditions with changing the grade angle wind velocity 7 degree and 25mps resp as shown below
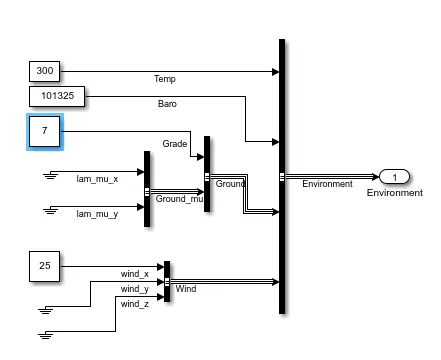
And plot the result.The result as follows
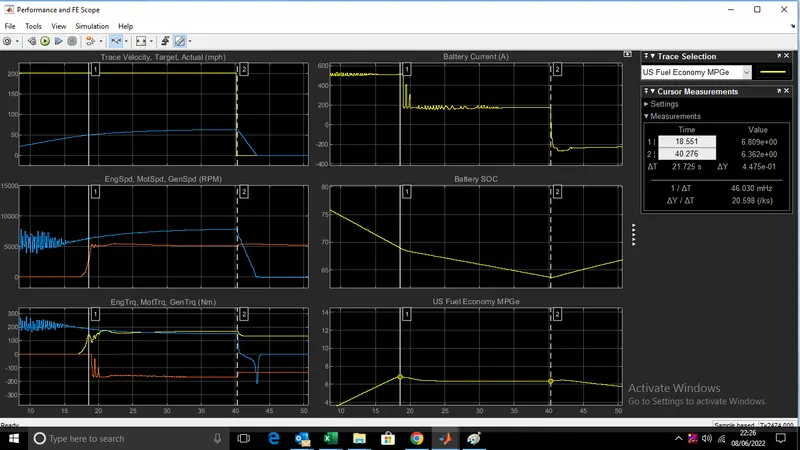
The explanations are as follow
1.Plot 1 -
- Plot 1 shows the graph of trace velocity and target velocity with respect to time.
- For reach the vehicle to the mximum velocity it required 40.27s
- For decceleration it required 2.84s
2.Plot 2-
- Plot 2 shows the Engine,motor and Gen speed in RPM
- Maximum Engine RPM is 5398 RPM
- Maximum Motor Speed is 7857 RPM
- Maximum Generator RPM is 5398RPM
3.Plot 3-
- Plot 3 shows the Engine torque motor torque and generator torque with respect to time through out the drive cycle in Nm
- Peak engine torque is 170.1Nm
- Peak Motor Torque 153Nm
- Peak generator torque 0Nm
4.Plot 4-
- Plot 4 shows the Battery current in Ampere
- Battery start to discharge from 397Amp
- Battery start charge from -397.6Amp
5.Plot 5-
- Plot 5 shows the battery SOC
- Baatery state of charge discharge from 68% to 63.6% in 21.47 sec
6.Plot 6-
- Plot 6 Shows the fuel economy
- Vehicle can travel 6.7 miles per gallon.
Observaon:
- We run the both the simulation and we get the result and we can conclude without inclusion of hill climbing angle and velocity vehicle is much more efficient with compared to simulation result with the 2 nd case.
- The vehicle is not able to achieve the top speed in second case as the current discharge from the battery at the same time.
- The state of discharge also high
- The fuel economy also not a good
- We can say no load vehicle efficiency is very good.
4.Keeping all other parameters same, compare the simulated results of hybrid and pure electric powertrains.
Ans-
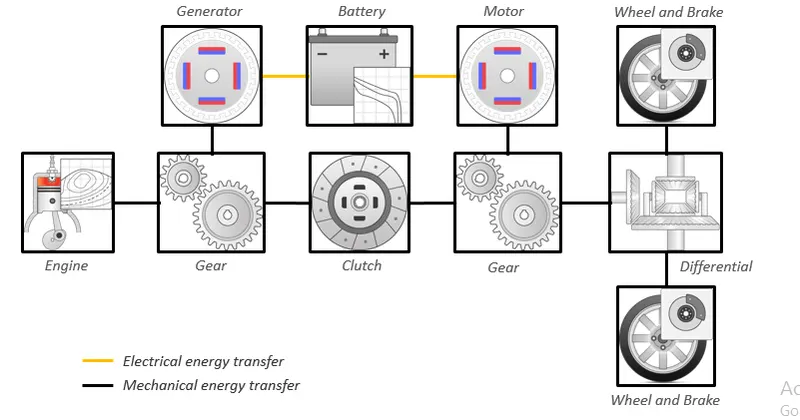
Hybrid electric Vehicle-
Hybrid vehicle is the vehicle in which for propulsion they use Engine and motor by using the fuel and battery resp.
Block diagram as below
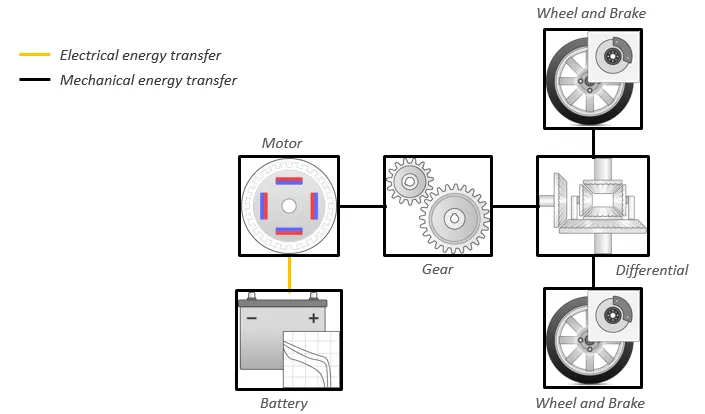
Pure electric vehicle-
Elecric vehicle is run bu using the motor for motor propulsion battery pacs are used.
Block Diagram as below
For comparison we will simulate the both the model with the FTP drive Cycle and results plots are as below for HEV reference application
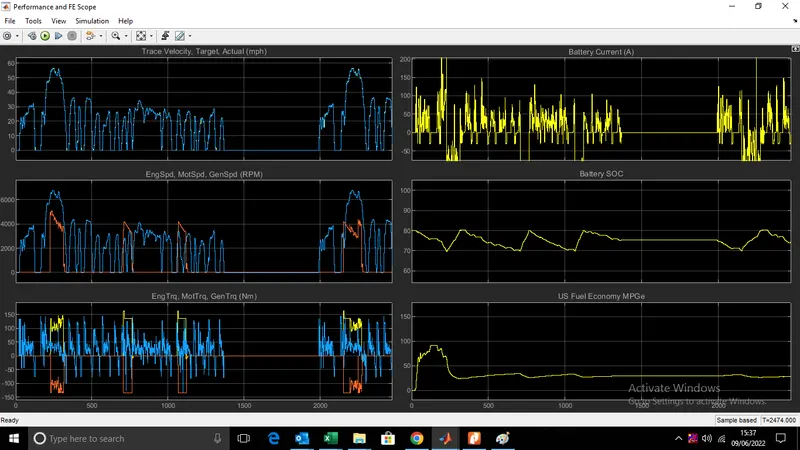
1.Plot 1
- Plot 1 Shows the graph of Standard FTP drive Cycle .
- In that drive cycle to reach the vehicle at maximum speed is 56.7 mph and time required to achiev the maximum speed is 239 sec
2.Plot 2-
- As we Know the plot two shows the motor, generator and engine speed RPM.
- For FTP drive cycle the values are as below
- Engine peak RPM is 5110 RPM
- Motor Peak RPM is 6767 RPM
- Gnerator peak RPM is 5110 RPM
3.Plot 3 -
- This plot shows the engine torque,Motor torque and generator torque.
- For FTP drive cycle values are below in Nm
- Peak engine torque is 135 Nm
- Peak Motor Torque 129 Nm
- Peak generator torque 0Nm
4.Plot 4-
- Plot 4 shows the Battery current in Ampere
- Battery start to discharge from 263 Amp
- Battery start charge from -169 Amp
5.Plot 5-
- Plot 5 shows the battery SOC
- Baatery state of charge discharge from 80.% to 70.6% in 361 sec
6.Plot 6-
- Plot 6 Shows the fuel economy
- Vehicle can travel 91.4miles per gallon.
For EV reference application
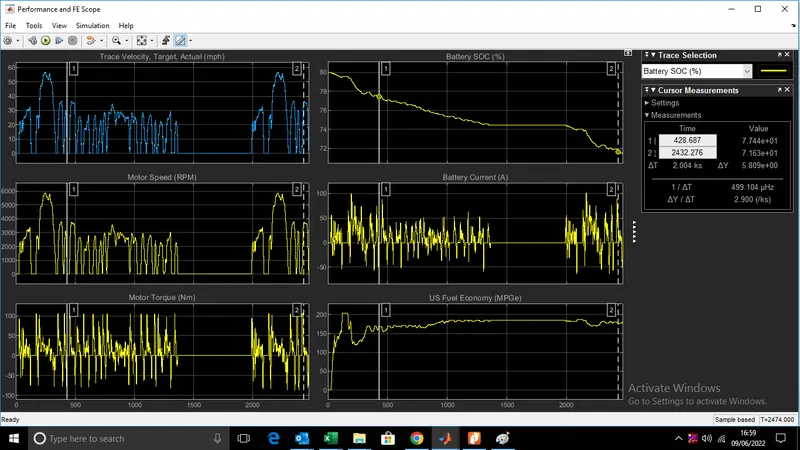
Results explained are as below
1.Plot 1
- Plot 1 Shows the graph of Standard FTP drive Cycle .
- In that drive cycle to reach the vehicle at maximum speed is 56.7 mph and time required to achiev the maximum speed is 239 sec
2.Plot 2-
- The plot two shows the motor RPM.
- For FTP drive cycle the values are as below.
- Motor Peak RPM is 5802 RPM
3.Plot 3 -
- This plot shows the Motor torque .
- For FTP drive cycle values are below in Nm
- Peak Motor Torque 105 Nm
4.Plot 4-
- Plot 4 shows the battery SOC
- Baatery state of charge discharge from 79.5% to 74.4% in 1183 sec
5.Plot 5-
- Plot 5 shows the Battery current in Ampere
- Battery start to discharge from 95 Amp
- Battery start charge from -39 Amp
6.Plot 6-
- Plot 6 Shows the fuel economy
- Vehicle can travel 20.39miles per gallon.
Observations-
1.As hybrid electrical vehicle is a combination of Motor and engine it gives the top speed as compared to the pure electric vehicle.
2.Hybrid electric vehicle gives the high torque as compared to pure electrcial vehicle.
3.As electric vehicle used the liyhium ion battery so it discharge fast.
4.Electric vehicle produce the zero emmission as compared to hybid electric as it uses the fuel.