Week-4 Challenge WOT Condition Part-2
- What is the difference between dynamic and mapped model of engine, motor and generator? How can you change the model type?
MAPPED MODEL: Mapped model is also called as the Static model. If we have data, we can map to particular block to create a mapped block. For example, if we have motors data, we can map data to particular mapped motor block. In the same way we can create the engine mapped block and generator mapped block if we have known the related data.
The static model going to work faster and it runs based on data given in the lookup table.
DYNAMIC MODEL: Dynamic model is going to represent the actual components, dynamic model is created by using the individual components of a machine so, we can analyse the impact of individual engine components on the overall performance. Dynamic model is used to analyse more detailed. If we have component level data, we can create the dynamic model.
STEPS TO CHANGE MODEL TYPE:
- Open the HEV reference application, then open the passenger car block.
- Passenger car block was created by many sub blocks like engine block, electric plant and drive train block.
- To activate other engine model, Right click on the engine block, go to variant option.
- Then go to Label model active choice.
- In that select the model which you want to activate.
- Then that model will be activated.
- In the same we can change the motor and generator model also.
- How does the model calculate miles per gallon? Which factors are considered to model the fuel flow?
OBJECTIVE: To find how does the model calculate miles per gallon and which factors are considered to model the fuel flow.
DESCRIPTION:
Miles Per Gallon (MPG): Miles Per Gallon is a fuel economy rating determined by how a car can travel on a gallon of gasoline or diesel.
Notations:
- 1000 w = 1kw (w/1000)
- 1 gallon = 33.7 kwh
- 1 hr = 3600 s
- 1 gallon = 0.00378541 m3
- 1 m3 = 264.172 Us gal
- 1 m = 0.000621371 mile
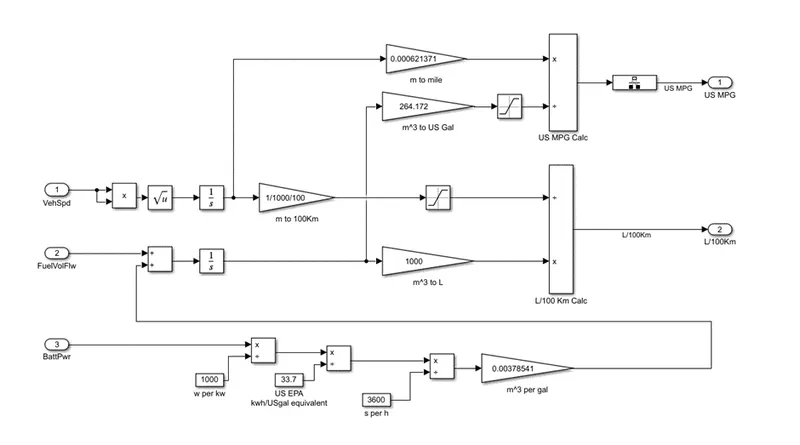
Block Diagram representing the how MPG will be calculated for HEV vehicle
- The Hybrid Electric Vehicle uses both the battery power and the engine power to run the vehicle.
- The HEV model will calculate the MPG of the vehicle by adding the battery power and the engine power.
- The battery power is converted to kw by dividing it by 1000 (1000w per kw).
- Then the battery power in kw is divided by the US gallon equivalent (1gallon = 33.7 kwh).
- The result obtained will be in 1/hr (kw/kwh = 1/h).
- Then the time in hr is converted to sec by dividing it with 3600 (1hr = 3600s).
- The time in sec is then multiplied with 0.00378541m3 (1 gallon = 0.00378541 m3) to convert it in to m3/s.
- Then the battery power in m3/s is added to fuelvolflow as the vehicle runs with both the powers, and then integrated the result value to convert it in to m3.
- Then the value in m3 is multiplied with 264.172 (1m3=264.172 US gal).
- Here we got the equivalent value of total gallons used by the vehicle.
- To find the miles per gallon the vehicle speed is multiplied by itself.
- Then the resultant value is taken under square root and integrated to get the distance travelled by vehicle in m.
- Then the distance in m is multiplied with 0.000621371 to convert it in to mile
- The distance in mile is then divided with total gallons used by the vehicle to get the miles per gallon.
- The total gallons value is passed through saturation block by allocating the higher and lower values in the saturation block.
Factors considered to model the fuel flow
- Engine Speed
- Engine Torque
- Battery voltage (SOC)
- Vehicle weight
- Air intake
- Drive Cycle
- Run the HEV reference application with WOT drive cycle. Change the grade and wind velocity in the environment block. Comment on the results.
OBJECTIVE: To run the HEV reference file with WOT drive cycle by changing the grade and wind velocity in the environment block.
DESCRIPTION:
Hybrid Electric Vehicle (HEV): A hybrid vehicle is the one that uses two or more distinct types of power, in the HEV it uses Electric power along with the engine power to run the vehicle.
HEV has different types of architectures
- Series Hybrid vehicle
- Parallel Hybrid Vehicle
- Series-Parallel (Power Split) Vehicle
Here in this reference file example, we have used Series-Parallel architecture for modelling the HEV.
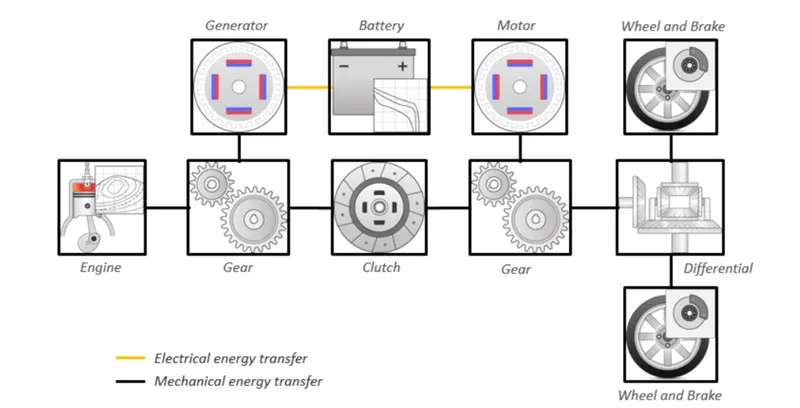
Block Diagram of HEV Series-Parallel architecture is shown above.
HEV model with WOT drive cycle:
Case-1:
- In this case we have used the drive cycle as WOT with all the parameters set to default.
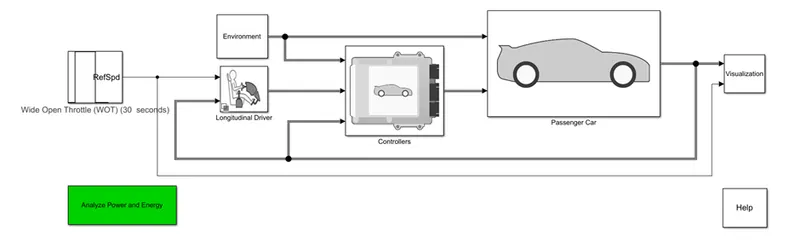
HEV Series-Parallel Architecture Powertrain model
RESULT:
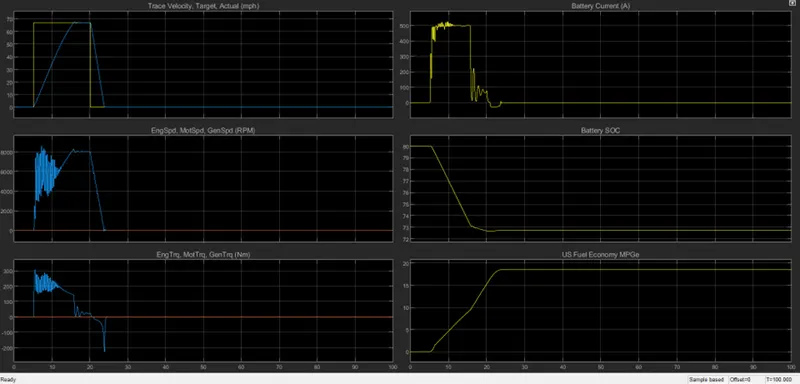
Fig showing the results of HEV Series-Parallel Architecture Powertrain model with WOT drive cycle
- From the above results we can say that the time taken by the vehicle to reach its maximum speed is 10.6s i.e., at 15.6s as the start condition was given at 5s. that we can observe in the Trace Velocity Graph.
- In this case battery power alone driven the vehicle throughout the entire drive cycle so, engine stayed in off mode which we can observe in the motor, engine, generator speed graph.
- From the motor, engine, generator speed graph we can also observe that the max speed of the motor reached to 8600 rpm approximately.
- Battery current reaches to around 525A and settled at 500A at the time of starting due to the high current requirement during the acceleration period and then started decreasing due to the deceleration and goes even below zero due to regenerative braking that we can observe in the Battery(A)
- State of Charge (SOC) of battery is at 80% at the start of the drive cycle and discharged to around 73% at the end that we can observe in Battery SOC graph.
- The gasoline equivalent of the battery power i.e., miles per gallon can be observed in US Fuel Economy MPGe graph.
Case-2:
- In this case we have used the drive cycle as WOT by changing some of the initial conditions of the drive cycle.
Start time = 2sec
Nominal reference speed = 35m/s
Time to start deceleration = 45s
Simulation time = 60s
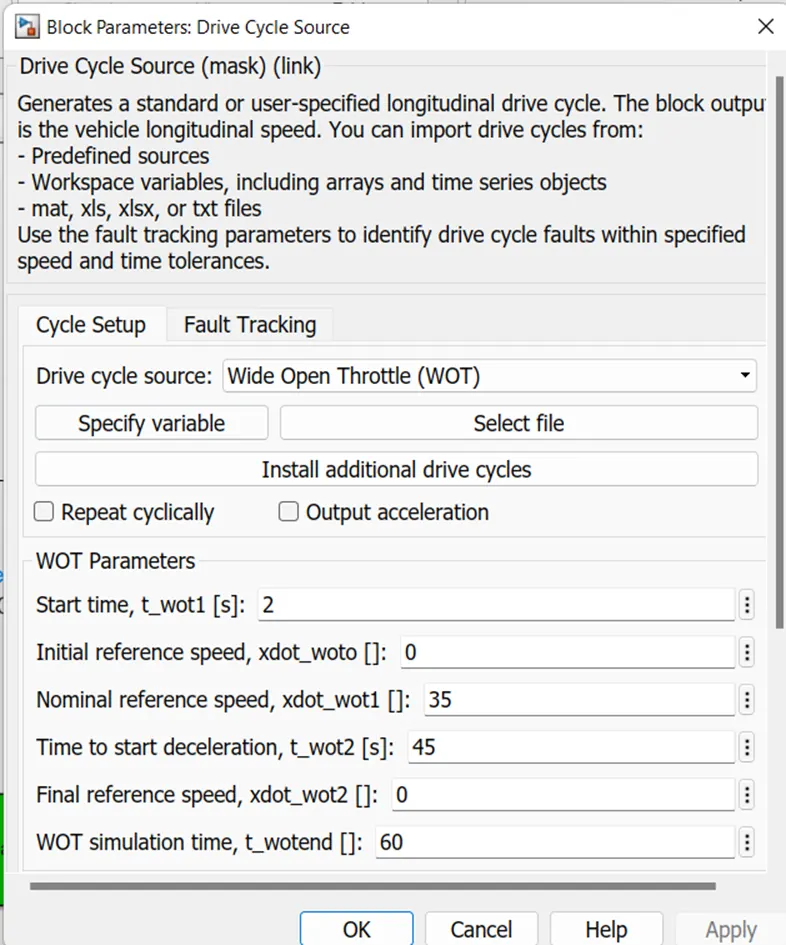
Fig showing the change in parameters of the WOT drive cycle
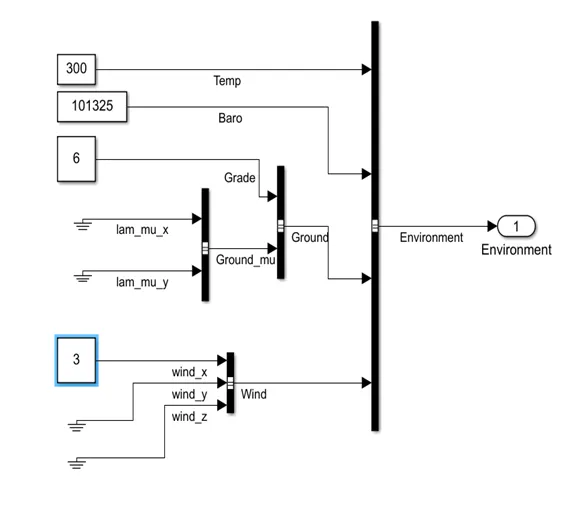
- We also changed the grade to 6 and wind velocity 3m/s.
RESULT:
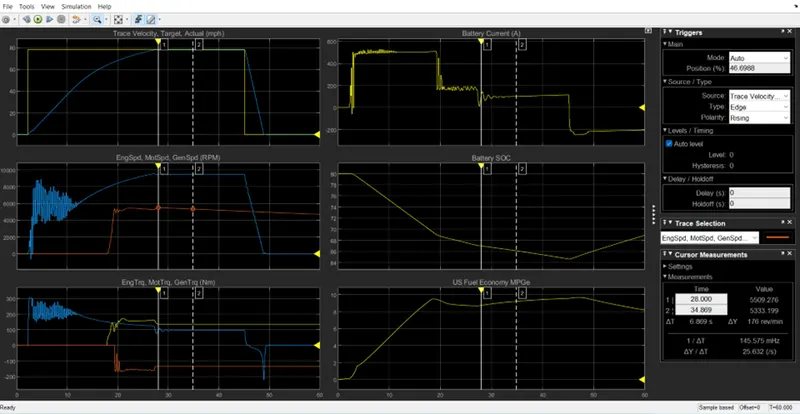
Fig showing the results of HEV Series-Parallel Architecture Powertrain model with WOT drive cycle
- From the above results we can observe that as battery power is not sufficient to run the vehicle, the engine gets on at 17.8s to run the vehicle due to the high demand of propulsion power.
- In this case the time taken by the vehicle to reach its maximum speed is 25.4s i.e., at 27.4s as the start condition was given at 2s. that we can observe in the Trace Velocity Graph.
- In this case the vehicle used both battery and engine power which we can observe in the motor, engine, generator speed graph.
- From the motor, engine, generator speed graph we can also observe that the max speed of the motor reached to 9560 rpm approximately at 27.1s and maximum speed of the engine reached to 5510rpm at 28s
- Battery current reaches to around 525A and oscillated at 500A at the time of starting due to the high current requirement, but after the engine gets on the current requirement was reduced until both the powers reach their efficiency margin.
- As the deceleration period started at 45s the current further decreases as there is no requirement of battery power to run the vehicle during deceleration and vehicle moves to regenerative braking mode that we can observe in the Battery(A)
- State of Charge (SOC) of battery is at 80% at the start of the drive cycle and discharged rapidly to around 69% until the engine gets on, but after that it discharged slowly until the deceleration and starts getting charged during the deceleration time as the vehicle moves to regenerative braking mode that we can observe in Battery SOC graph.
- The gasoline equivalent of the power that required to run the vehicle i.e., miles per gallon can be observed in US Fuel Economy MPGe graph.
- keeping all the parameters same, compare the simulated results of hybrid and pure electric powertrains.
OBJECTIVE: To run the EV reference file with WOT drive cycle by keeping all the parameters same as that of HEV reference model and to compare both the simulated results.
DESCRIPTION:
Electric Vehicle (EV): The electric vehicle is a vehicle that runs on a electricity alone. Such a vehicle does not contain an internal combustion engine like the other convention vehicles. Instead, it employs an electric motor to run the wheels.
Block Diagram showing the architecture of EV vehicle.
EV model with WOT drive cycle:
- In this case we have used the drive cycle as WOT by keeping the initial conditions of the drive cycle same as the HEV reference file.
Start time = 2sec
Nominal reference speed = 35m/s
Time to start deceleration = 45s
Simulation time = 60s
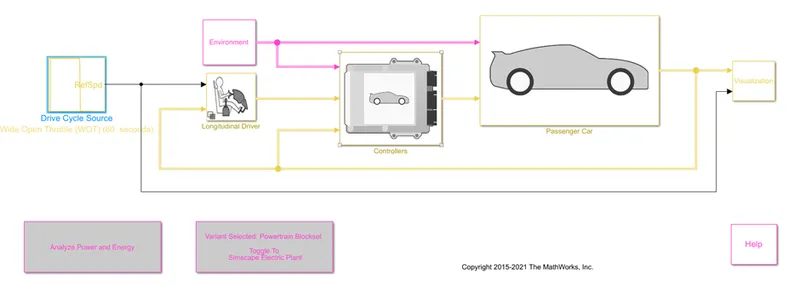
EV Powertrain model
- We also changed the grade to 6 and wind velocity 3m/s same as in the HEV model.
RESULT:
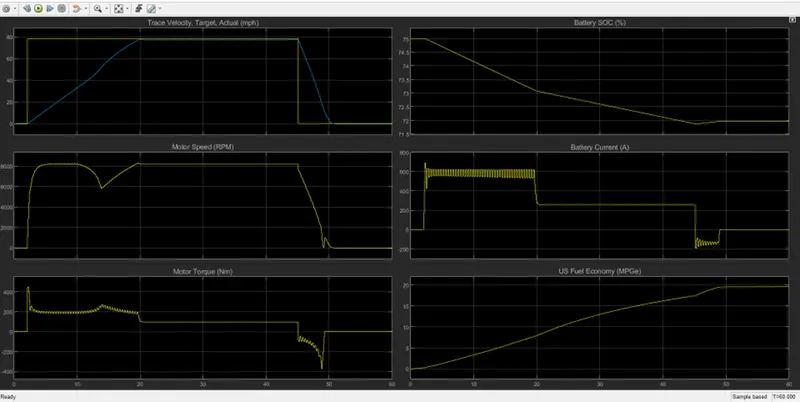
Fig showing the results of EV Powertrain model with WOT drive cycle
- From the above results we can say that the time taken by the vehicle to reach its maximum speed is 18s i.e., at 20s as the start condition was given at 2s. that we can observe in the Trace Velocity Graph.
- In this case battery power alone driven the vehicle throughout the entire drive cycle which we can observe in the motor, engine, generator speed graph.
- From the motor, engine, generator speed graph we can also observe that the max speed of the motor reached to 8320 rpm approximately.
- Battery current reaches to around 690A and oscillated between 620 and 525A at the time of starting due to the high current requirement during the acceleration period and then started decreasing due to the deceleration and goes even below zero due to regenerative braking that we can observe in the Battery(A)
- State of Charge (SOC) of battery is at 75% at the start of the drive cycle and discharged to around 72% at the end and gets charged during the deceleration due to regenerative braking that we can observe in Battery SOC graph.
- The gasoline equivalent of the battery power i.e., miles per gallon can be observed in US Fuel Economy MPGe graph.
COMPARISION:
- The time to reach the max speed of the vehicle is less in EV model than compared to HEV model.
- The battery charging in regenerative braking mode is higher in HEV model than the EV model because in HEV the battery gets charged with engine through generator and through the regenerative braking but in EV it is only through the regenerative braking.
- The battery current drawn by the vehicle at starting due to acceleration is high in EV compared to HEV.
- Motor Torque produced in motor is high in EV compared to HEV.
- The US Fuel Economy MPGe is more in EV compared to HEV.