Week-4 Challenge WOT Condition Part-2
OBJECTIVES:
- What is the difference between the mapped and dynamic engine, motor and generator models? How can you change the model type?
- How does the model calculate miles per gallon? Which factors are considered to model fuel flow?
- Run the HEV ReferenceApplication with WOT drive cycle. Change the grade and wind velocity in the environment block. Comment on the results.
- Keeping all other parameters the same, compare the simulated results of hybrid and pure electric powertrains.
Q) What is the difference between the mapped and dynamic engine, motor and generator models? How can you change the model type?
A)
MAPPED ENGINES:
Mapped Engine is the default setting in the powertrain blocks. It is utilised to gauge to quantify execution boundaries of the vehicle by using standard query tables, which are pressed to the framework. This kind of demonstration is less precise. The query tables esteem depend on the upsides of brake force, told force and engine speed. If some other boundary like Input engine temperature is chosen, query table qualities are additionally a capacity of the temperature boundary. The information extricated from query tables is air mass stream, fuel stream, discharge information, exhaust temperature and effectiveness. This information is utilised to determine the boundaries required by the end client.
Dynamic Engine:
This kind of model's ongoing information is taken care of by the client at run time for display. This model is more precise than the mapped engine model. This model is utilised when the information of subsystems of a vehicle is required. We can compute: Brake force, fuel stream, port gas mass stream, fumes temperature, fumes mass stream rate also, and exhaust emanations.
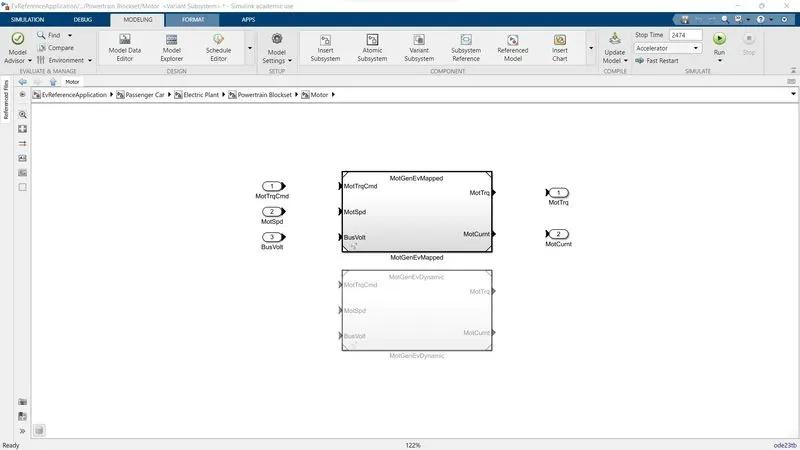
Mapped Motor:
The mapped motor works in force control mode. This motor is utilised when the client requires a quicker reenactment and doesn't have the information on motor boundaries. The resulting and reference forces are looked at, and changes are made. Input force or speed can be specified, electrical misfortunes and most extreme motor power and force can be characterised.
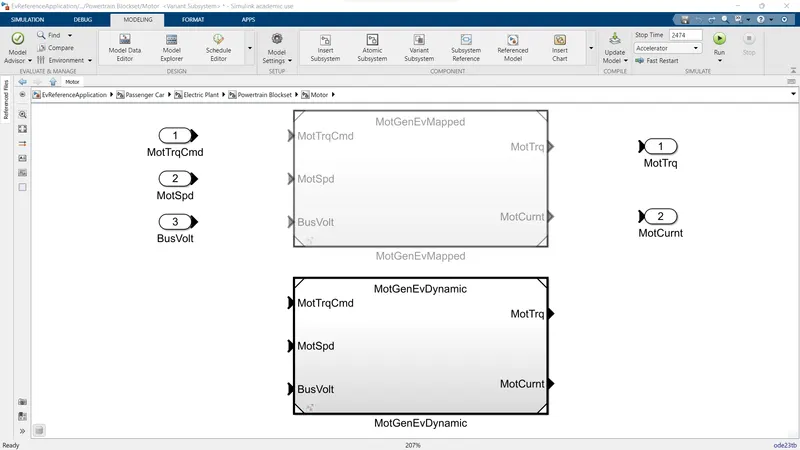
Dynamic Motor:
A three-stage inside permanent magnet synchronous motor (PMSM) is utilised in the dynamic motor. The square purposes three-stage input voltages to direct the singular stage flows, permitting control of the motor force or speed. This square is utilised when the client knows what boundaries are to be utilised in that specific reenactment. This motor is more exact.
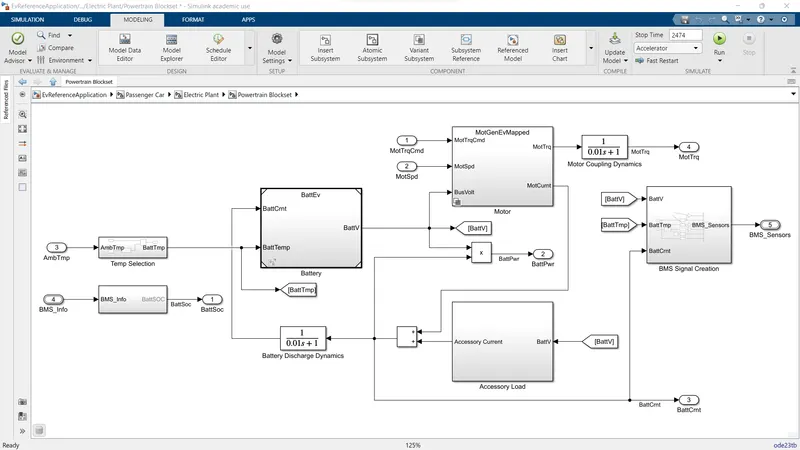
Mapped Generator:
The mapped generator block is likewise comparative like different squares. The vast majority of the information required is taken from the query tables relating to the given info boundaries. Its reproduction time is less.
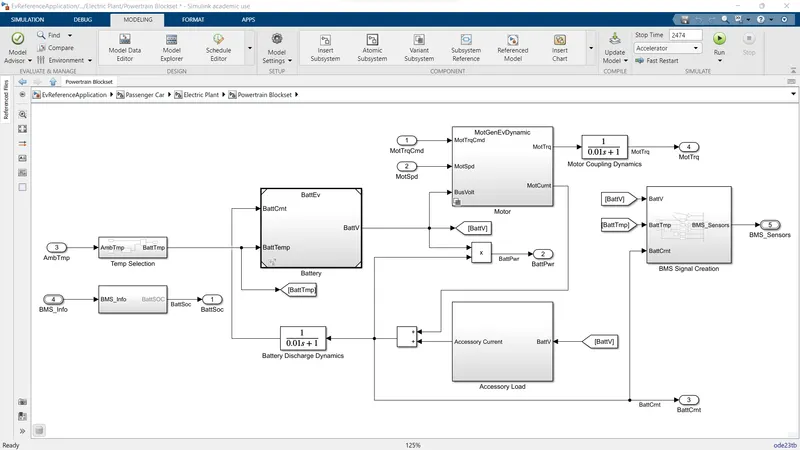
Dynamic Generator:
The dynamic generator includes clients entering the boundaries physically during the run time for their specific applications. The outcomes take time and are more exact.
How to shift from Mapped to Dynamic:
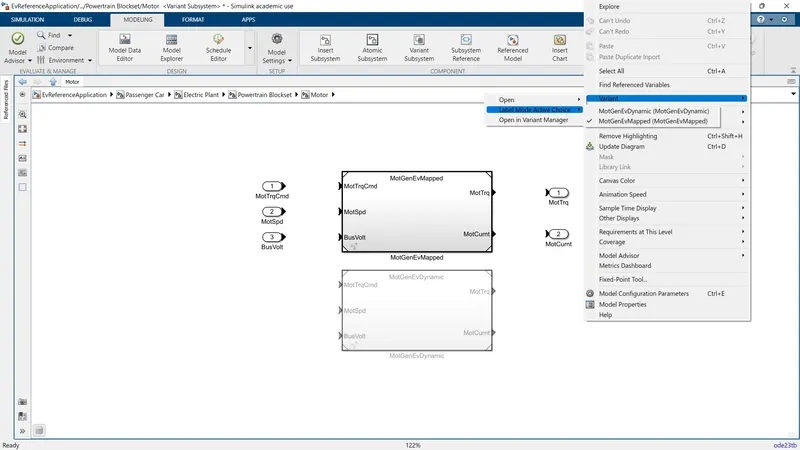
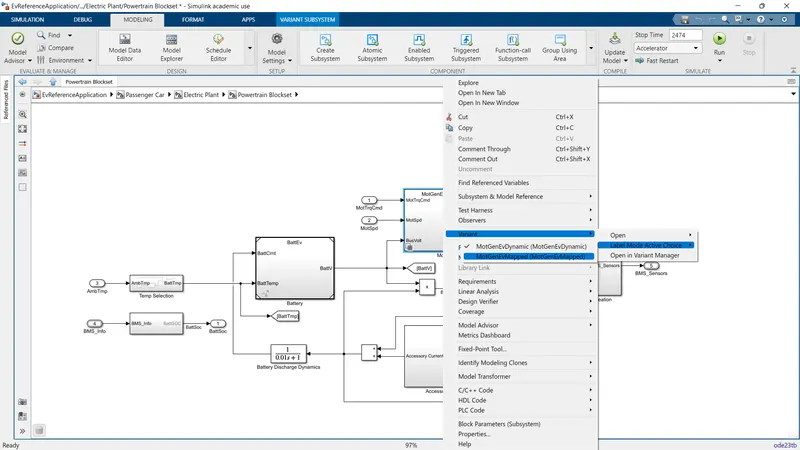
- To shift from dynamic to mapped or the visa versa, select the block you want to change.
- Right-click on that block and go to the variant option.
- Select whichever label is required.
Q) How does the model calculate miles per gallon? Which factors are considered to model fuel flow?
A)
MPGe Defined
MPGe is an abbreviation for “miles per gallon equivalent.” In other words, it's the electric vehicle version of mpg. MPGe was introduced by the Environmental Protection Agency (EPA) in 2010 to compare the amount of energy consumed by vehicles using alternative fuels to those of gas-powered engines.
Calculating MPGe
Burning gasoline generates heat. Using electricity also creates heat. So MPGe is essentially the heat equivalent of mpg. One gallon of burned gas produces 115,000 British thermal units (BTUs). Generating the same amount of heat through electricity would require 33.7kWh, the standard unit used to measure electricity. MPGe is the distance a car can travel on 33.7kWh of electricity. So, if a vehicle can cover 60 miles for every 33.7kWh of electricity, its MPGe would be 60. That would be the equivalent of a gas-powered car getting 60 mpg.
Reference Block of EV Model:
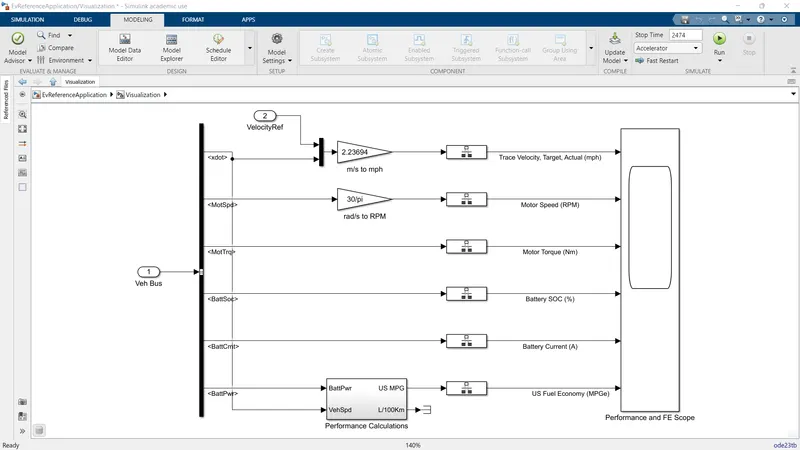
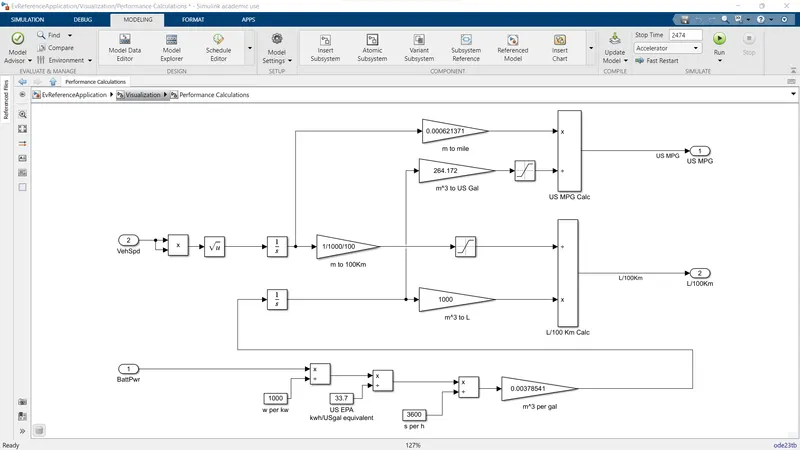
The inputs to be considered are:
- Speed of the vehicle.
- The flow of the fuel.
- The battery power.
The above picture has two energised power and fuel. As examined before, 1 gallon of gas is equivalent to 33.7 kWh of energy. So battery power is first changed over into KW (W/1000), then its partitions by 33.7 kWh. What might be compared to the battery is added to the fuel stream. Utilising the vehicle speed and time, the distance of movement is determined. Then distance is changed over into miles by transformations. Then as we have the fuel stream in m^3 and distance in miles, we can ascertain eco-friendliness.
Q) Run the HEV ReferenceApplication with WOT drive cycle. Change the grade and wind velocity in the environment block. Comment on the results?
A)
HEV ReferenceApplication with WOT drive cycle:
- To start the HEV Reference Application, type "autoblkHEVStart" in the command window and press enter to run the application.
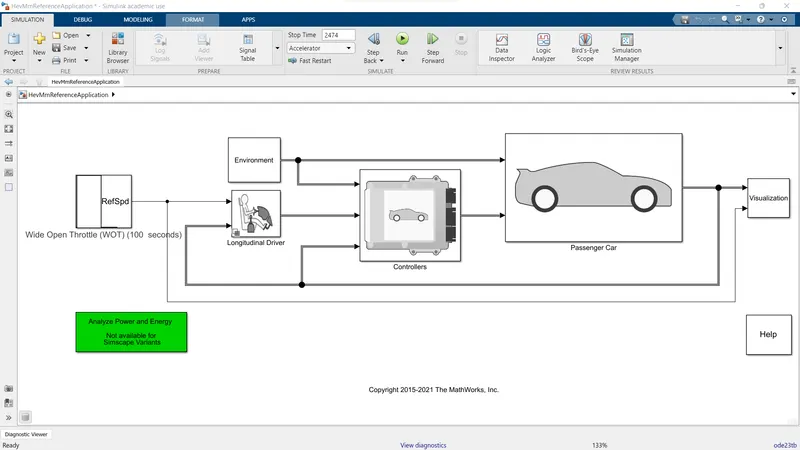
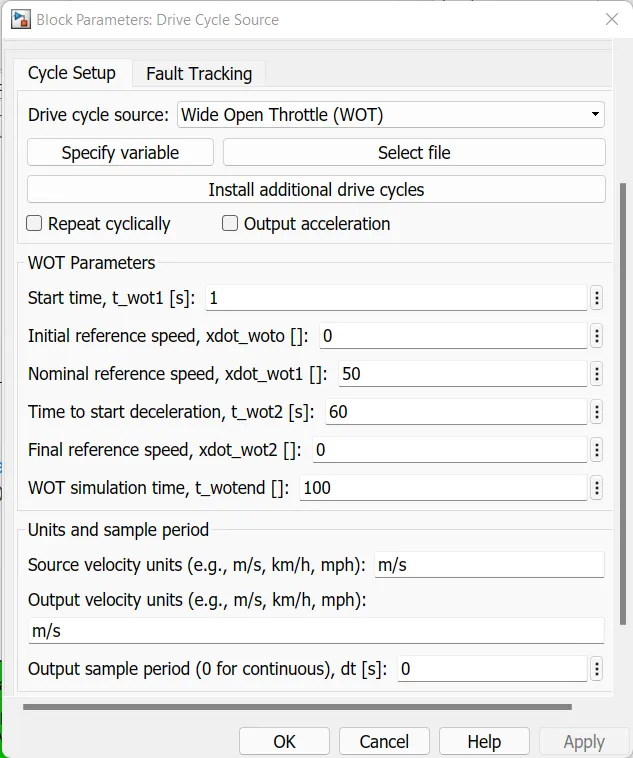
- Next, select the drive cycle block and change the cycle type to Wide Open Throttle (WOT) and enter the values as shown in the picture below.
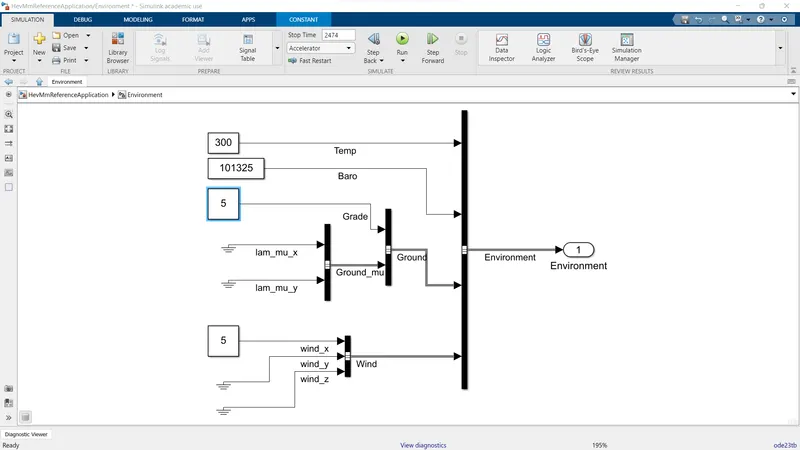
- Next, change the wind speed and grade from the environmental block, as shown in the picture below.
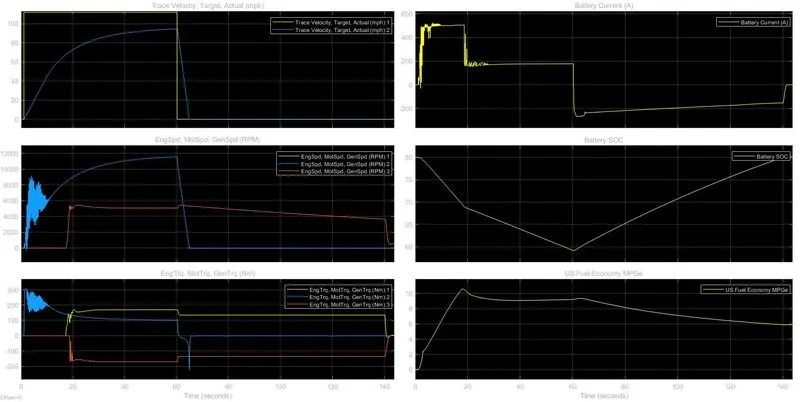
- Now run the simulations and plot the graphs. The graphs and results are shown below.
CONCLUSIONS FROM THE ABOVE SIMULATION AND GRAPHS:
The above charts show the Trace Velocity target and genuine chart: The yellow line shows the wanted way, and the blue line indicates the genuine way. So it very well may be seen that battery power isn't sufficient to meet the prerequisites of the grade also, as wind velocity. Battery Current Graph: When the vehicle speeds up, the battery current expands. When the velocity is steady, the current prerequisite likewise becomes steady. When the deceleration begins, the battery current becomes negative demonstrating regenerative slowing down. Battery SOC: The battery SOC continues to drain until egenerative slowing down begins. This expands the SOC Motor, Motor and Generator Speed: Initially, the engine is utilised to start the vehicle as the machine has a high starting force. Later generator (red chart) kicks in to charge the battery when SOC dips under 70%. The motor chart shouldn't be visible as it might have overlapped with the generator. Motor, Motor and Generator Torque: Motor force is high at first (blue line and afterwards, motor kicks in at a later stage (yellow line). Generator force (red line) is negative as its charging the battery.
Q) Keeping all other parameters the same, compare the simulated results of hybrid and pure electric powertrains.
A)
EV ReferenceApplication with WOT drive cycle:
- Type "autoblkEVStart" in the command window and press enter to run the application to start the EV Reference Application.
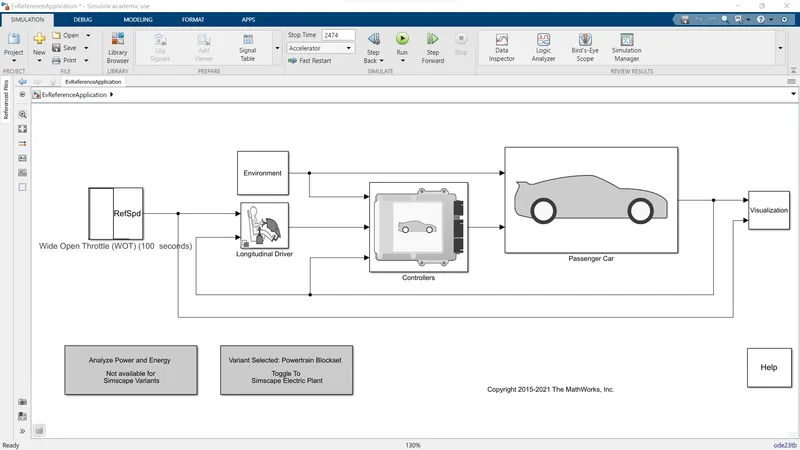
- Next, select the drive cycle block and change the cycle type to Wide Open Throttle (WOT) and enter the values as shown in the picture below.
- Next, change the wind speed and grade from the environmental block, as shown in the picture below.
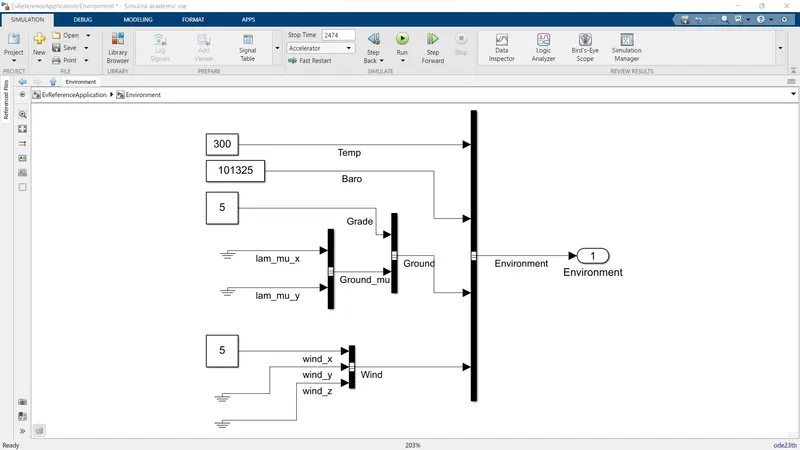
- Now run the simulations and plot the graphs. The graphs and results are shown below.
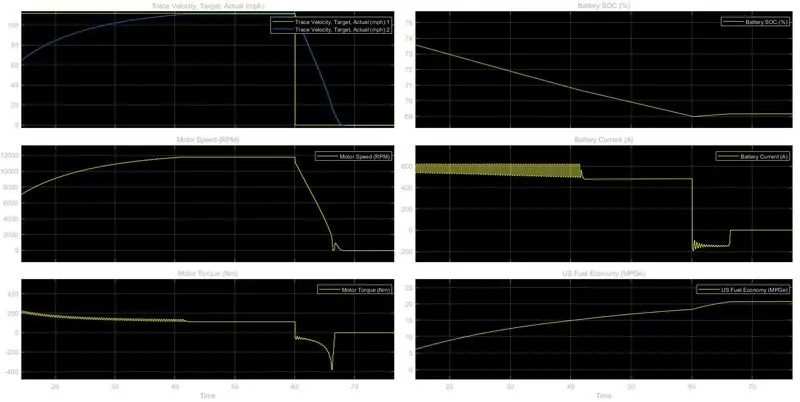
CONCLUSIONS AND COMPARISION OF HEV AND EV POWERTRAINS FROM THE ABOVE SIMULATIONS AND GRAPHS:
In the wake of looking at the diagrams of both EV and HEV following. Execution of the primary diagram (target and simple velocity chart) is practically the same. The explanation could be that in that locale, just the engine was working, so the presentation in both EV and HEV is comparative. At first, the battery current drawn by HEV is up to 500 An and later declines to 200 A. This can be credited to the reality that at first, the engine takes all the heap and later motor kicks in, so engine load drop along these lines currently drawn by the engine lessens.
Furthermore, during the deceleration, it is seen that negative current (regenerative slowing down) streams for a more drawn out time in HEV when contrasted with EV. So we can say that regenerative slowing down is more forceful in HEV. SOC improvement of practically 15% is seen in HEV during deceleration, and just 2% improvement should be visible in EV during deceleration. This can be perceived by a similar explanation made sense of in point 2. Engine force and engine speed are steady in EV, and they continue fluctuating a great deal in HEV during the beginning.
Additionally, the top RPM of the engine in EV is not exactly HEV. These distinctions can be credited to how the battery force of EV is more than HEV. The efficiency of EV is fundamentally more noteworthy than HEV. This is because an electric engine is more effective than a motor.