Project 1 - Parsing NASA thermodynamic data
Parsing NASA thermodynamic data and writing the function that extracts the 14 coefficients and calculates the enthalpy, entropy, and specific heats for all the species in the data file.
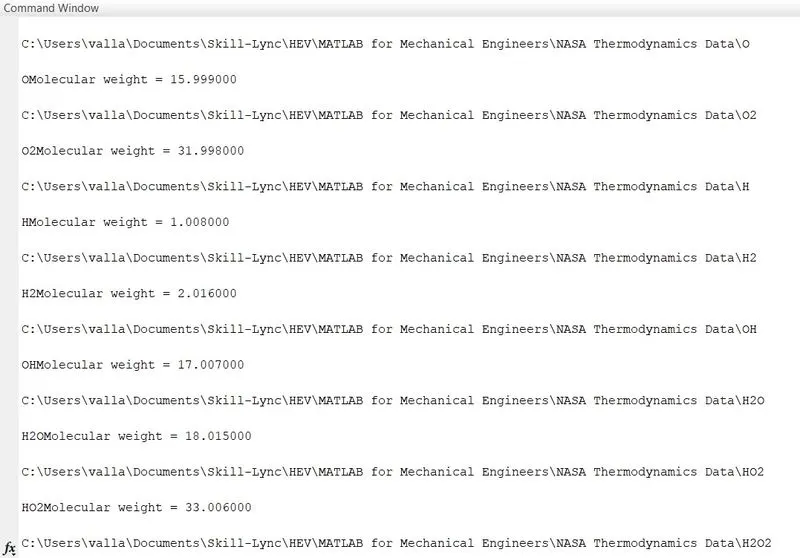
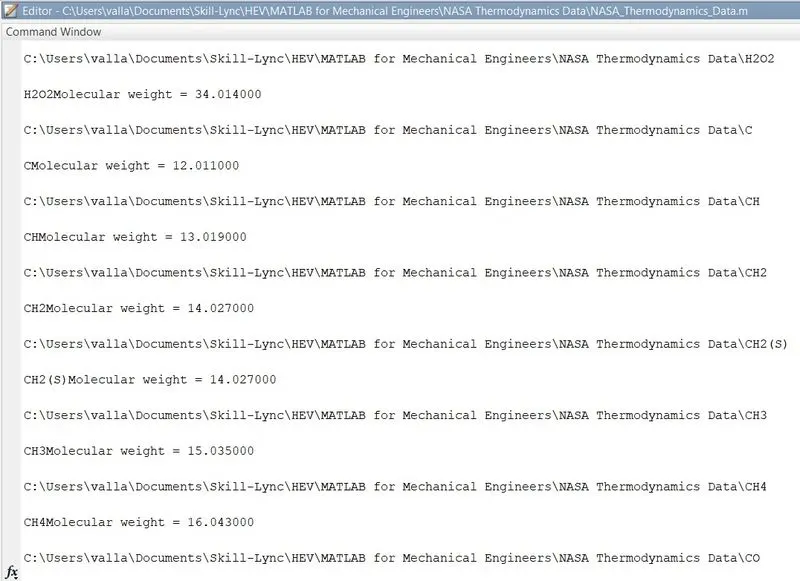
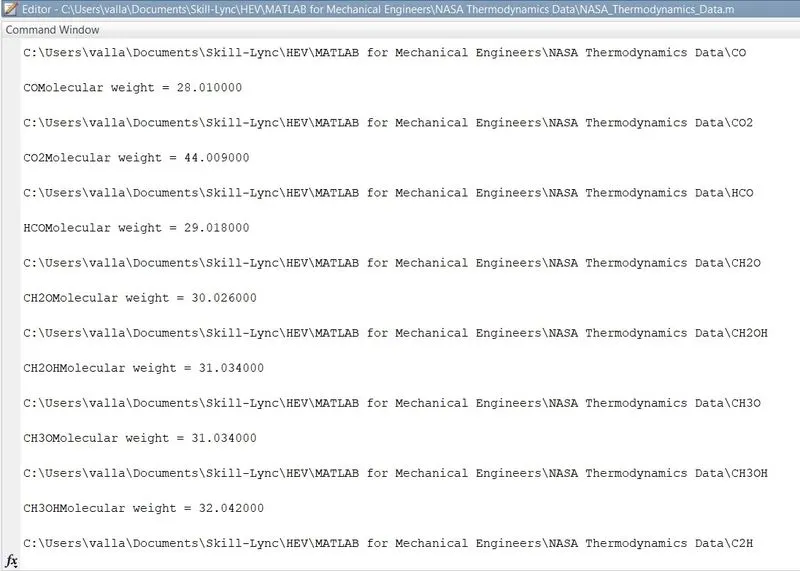
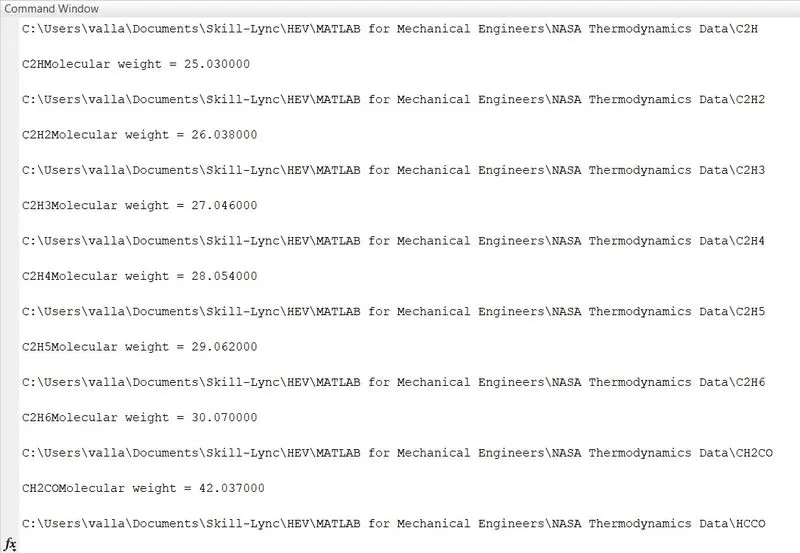
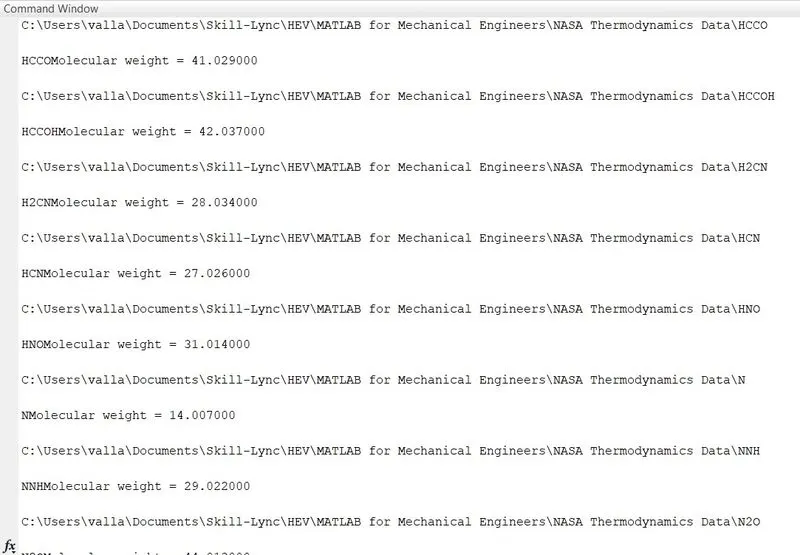
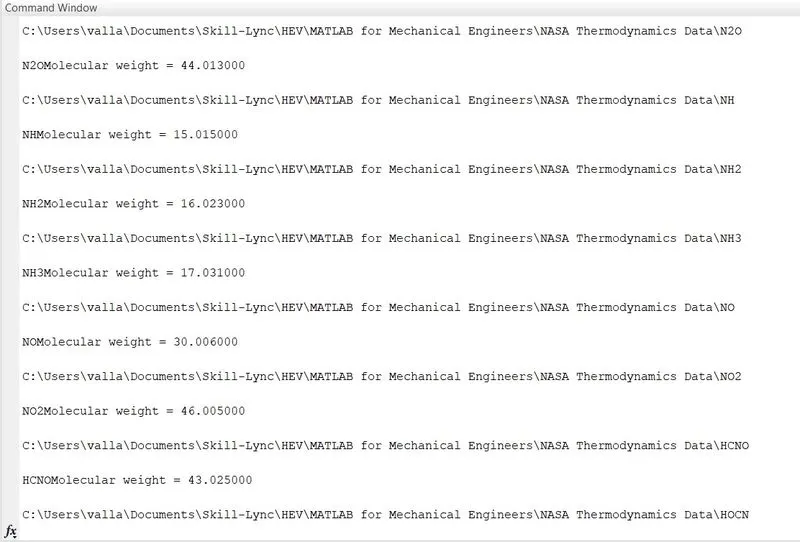
To calculate the molecular weight of each species.
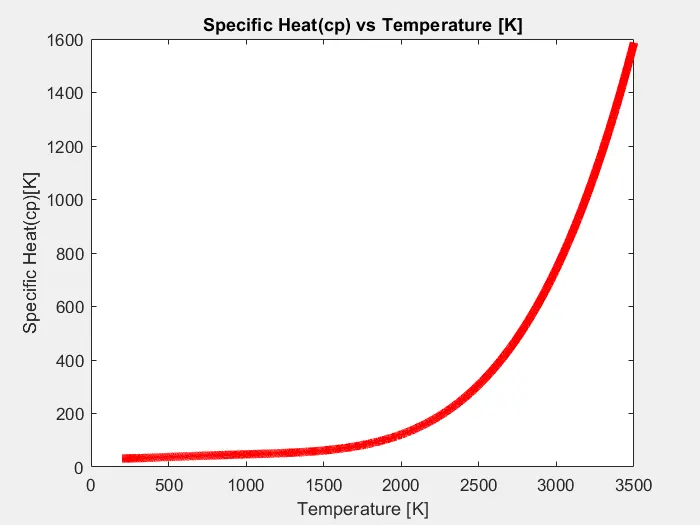
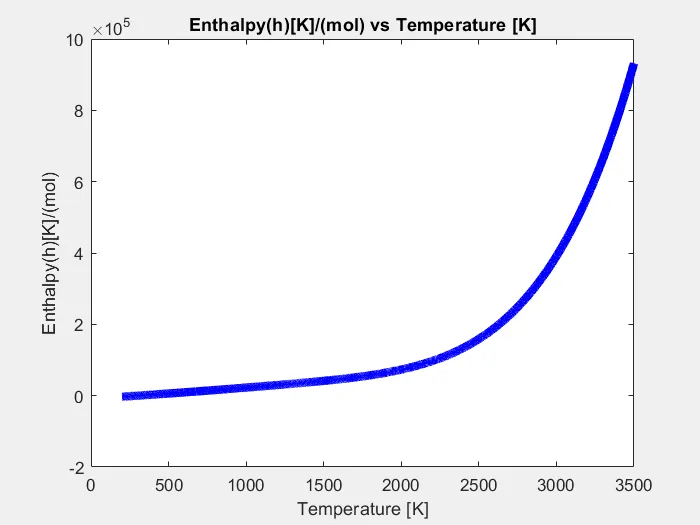
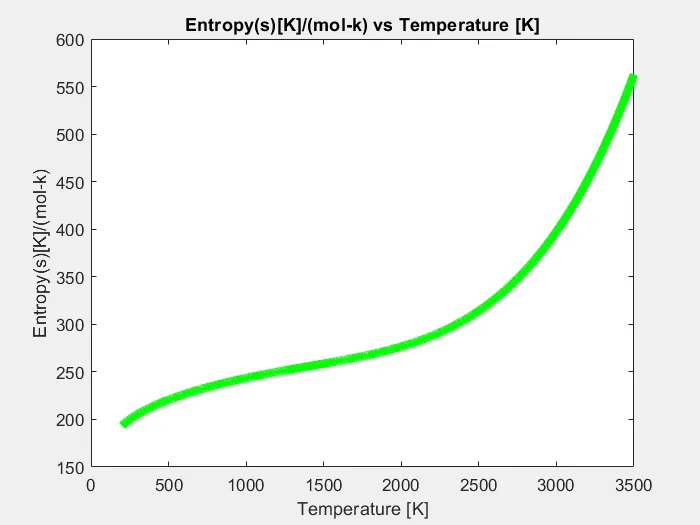
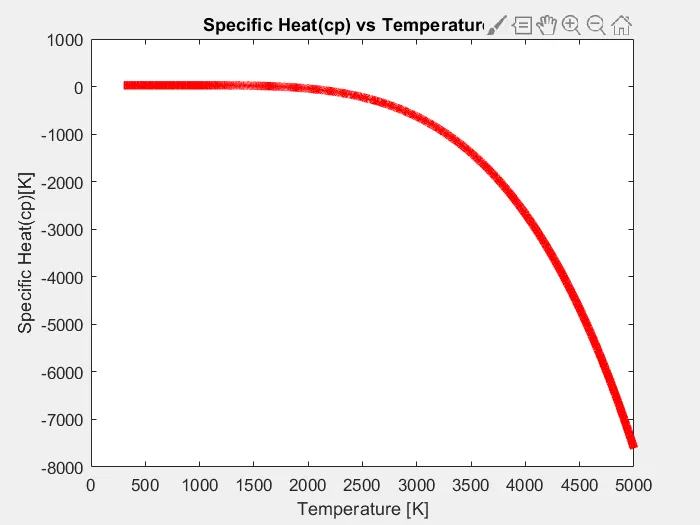
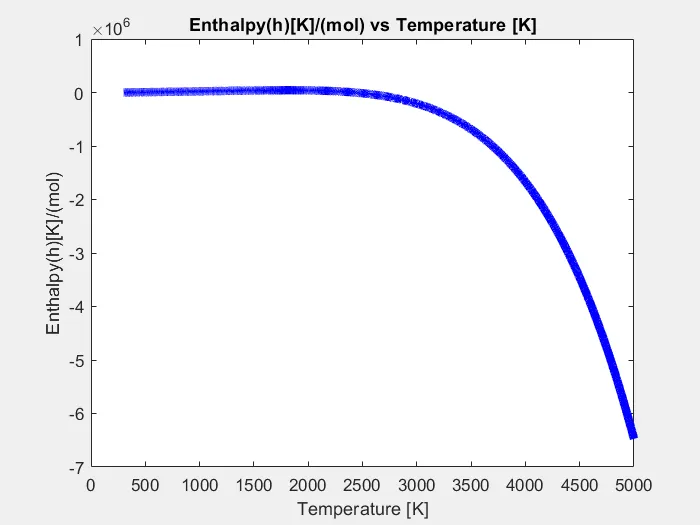
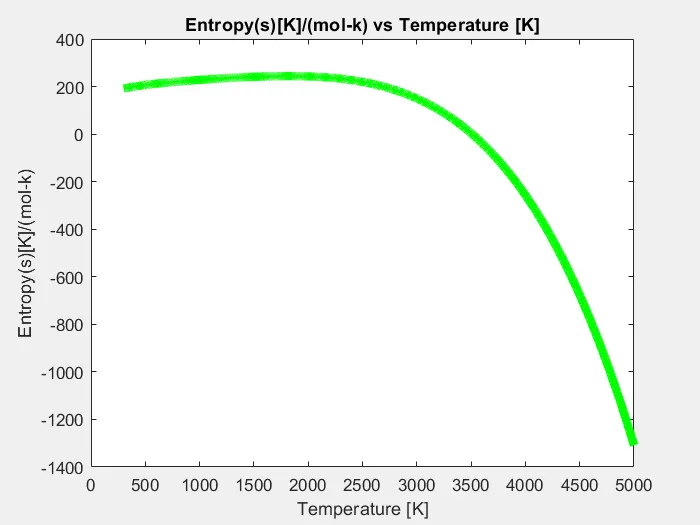
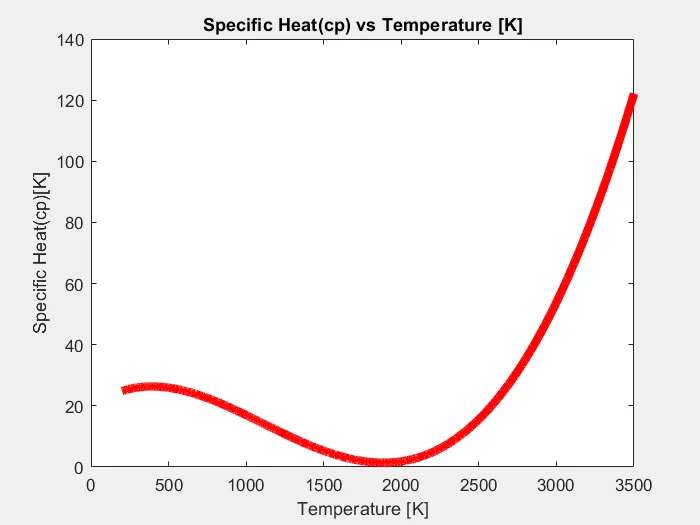
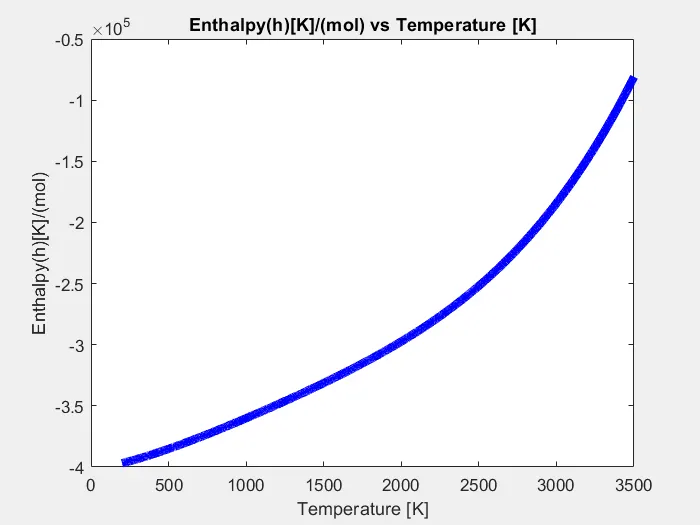
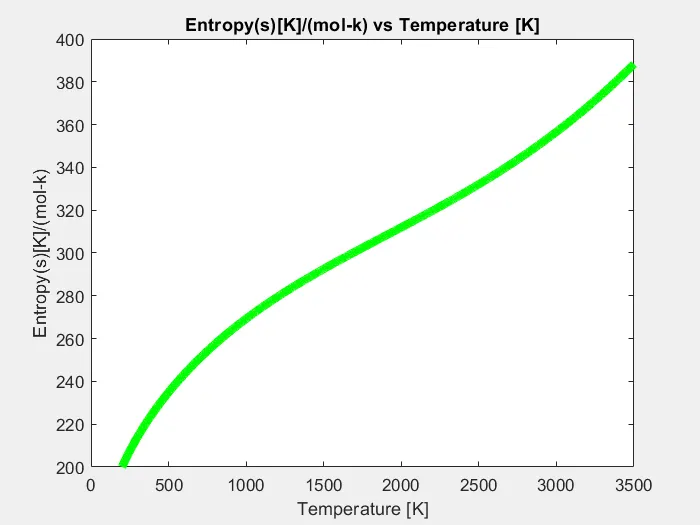
Plot the Cp, Enthalpy, and Entropy for the local temperature range.
Explanation of the code:
- First, open the file THERMO.dat using the command fopen and ask it to read. Then requested it to read line 1 of the file using the command fgetl(f1), where f1 acts as a pointer in the file.
- Next, read the global temperatures in the second line of the file. Then using the command gtemp = strsplit(tline2,' '); split the line wherever space was given and stored in a cell array. Then using the command str2double, converted the string into a double data type and then obtained the values for low, mid, high temperature.
- Next, neglect the following three lines as there are just the comments in the file, using the for and fgetl commands.
- Next, the for loop command was used to read the following 53 lines as they are 53 different species. The 53 species are divided into four lines each. Then using the commands fgetl, strsplit, strfind, and strdouble to read the first line, which provides the species name and local temperature. For the following, three lines use the commands fgetl, strfind, and strdouble, which give the particular species' coefficients.
- Next, Assumed the Universal Gas constant value of 8.314.
- Next, the cp, h, s functions, and the respective values have been calculated for all the 53 species.
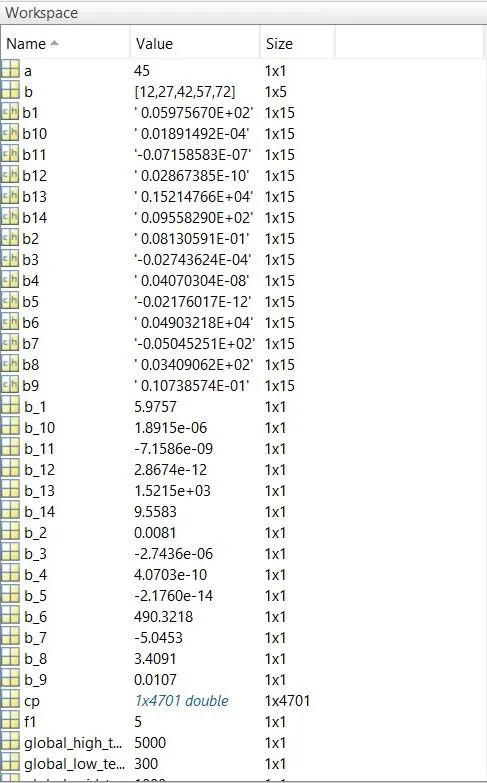
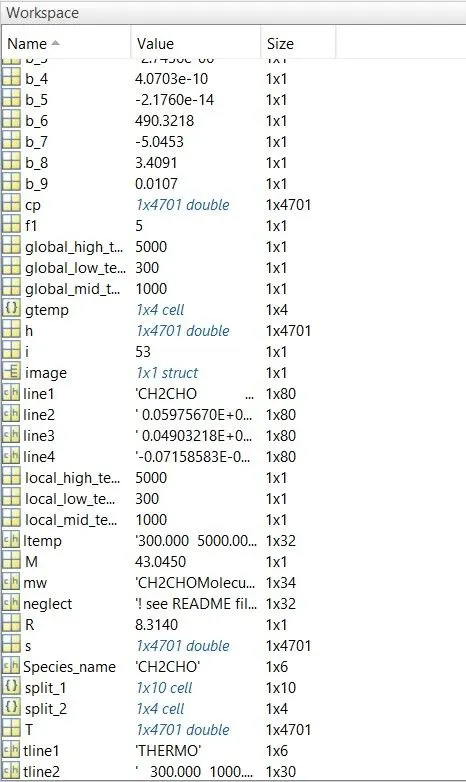
- Next, the species name has been identified and stored in a variable 'species_name'. Then the local temperatures and the 14 coefficients for each species have been calculated and stored into different variables.
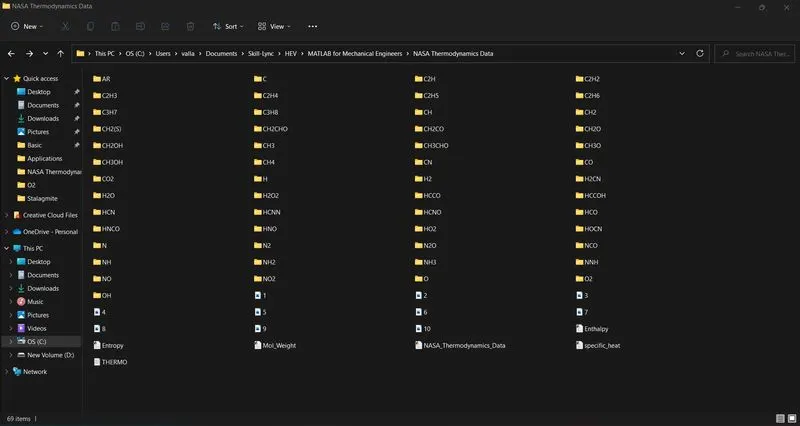
- Next, the command mkdir was used to create the folder for the respective species and give the cd command with the directory to store these files.
- Next, plotted the graphs for cp,h, s, respective to temperature for all the 53 species.
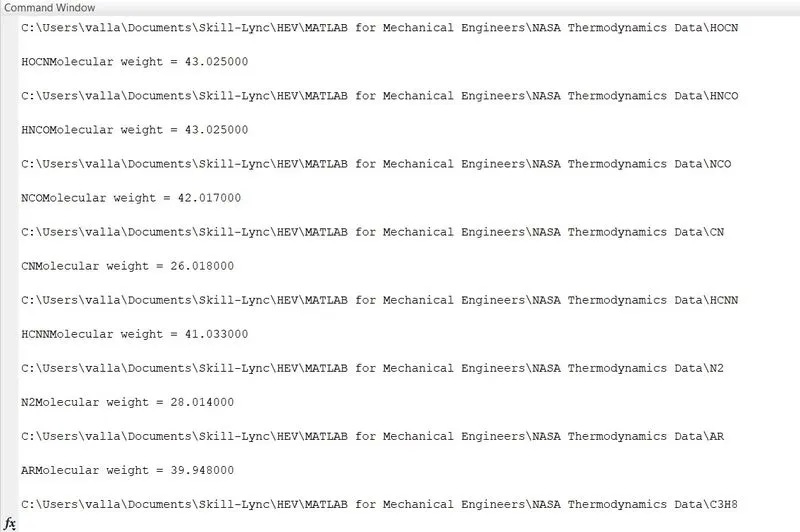
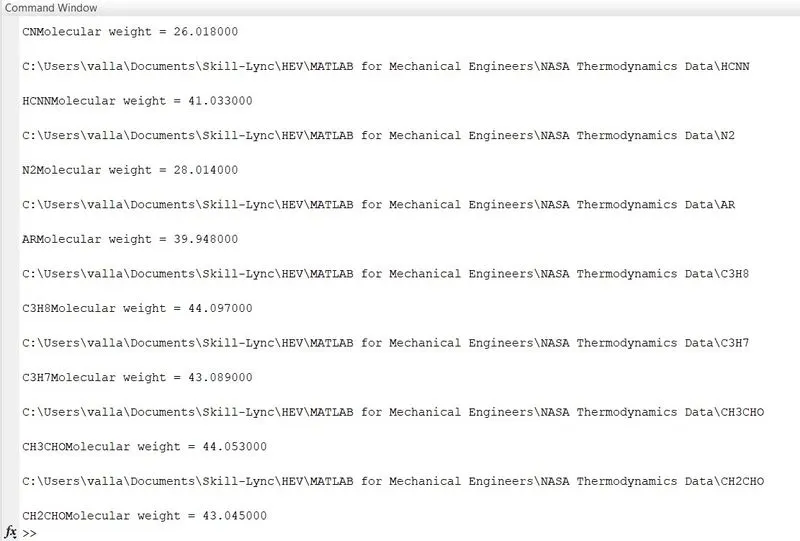
- Next, calculate the molecular weights for the 53 species and saved them in an array. Then the commands mw = sprintf('%sMolecular weight = %f',Species_name,M); disp(mw); are used to display the molecular weights for 53 species in the command window.
close all
clear all
clc

f1 = fopen('THERMO.dat','r');
tline1 = fgetl(f1);

%global_temp_line
tline2 = fgetl(f1);
gtemp = strsplit(tline2,' ');
global_low_temp = str2double(gtemp{2});
global_mid_temp = str2double(gtemp{3});
global_high_temp = str2double(gtemp{4});

%neglecting_next3lines
for i = 1:3
    neglect = fgetl(f1);
end


for i = 1:53
    %first_line

    line1 = fgetl(f1);
    split_1 = strsplit(line1,' ');
    Species_name = split_1{1};

    a = strfind(line1,'G');
    ltemp = line1(a+4:length(line1));
    split_2 = strsplit(ltemp,' ');

    local_low_temp = str2double(split_2{1});
    local_high_temp = str2double(split_2{2});
    local_mid_temp = str2double(split_2{3});

    %second_line

    line2 = fgetl(f1);
    b = strfind(line2,'E');

    b1 = line2(1:b(1)+3);
    b_1 = str2double(b1);
    b2 = line2(b(1)+4:b(2)+3);
    b_2 = str2double(b2);
    b3 = line2(b(2)+4:b(3)+3);
    b_3 = str2double(b3);
    b4 = line2(b(3)+4:b(4)+3);
    b_4 = str2double(b4);
    b5 = line2(b(4)+4:b(5)+3);
    b_5 = str2double(b5);

     %third_line

    line3 = fgetl(f1);

    b6 = line3(1:b(1)+3);
    b_6 = str2double(b6);
    b7 = line3(b(1)+4:b(2)+3);
    b_7 = str2double(b7);
    b8 = line3(b(2)+4:b(3)+3);
    b_8 = str2double(b8);
    b9 = line3(b(3)+4:b(4)+3);
    b_9 = str2double(b9);
    b10 = line3(b(4)+4:b(5)+3);
    b_10 = str2double(b10);

    %fourth_line

    line4 = fgetl(f1);

    b11 = line4(1:b(1)+3);
    b_11 = str2double(b11);
    b12 = line4(b(1)+4:b(2)+3);
    b_12 = str2double(b12);
    b13 = line4(b(2)+4:b(3)+3);
    b_13 = str2double(b13);
    b14 = line4(b(3)+4:b(4)+3);
    b_14 = str2double(b14);

    T = local_low_temp:local_high_temp;

    % Universal Gas Constant
    R = 8.314;

    %Calculations of Specific Heat, Enthalpy, Entropy, and Molecular Weight

    [cp] = specific_heat(b_1,b_2,b_3,b_4,b_5,b_8,b_9,b_10,b_11,b_12,local_mid_temp,T,R);

    [h] = Enthalpy(b_1,b_2,b_3,b_4,b_5,b_6,b_8,b_9,b_10,b_11,b_12,b_13,local_mid_temp,T,R);

    [s] = Entropy(b_1,b_2,b_3,b_4,b_5,b_7,b_8,b_9,b_10,b_11,b_12,b_14,local_mid_temp,T,R);

    cd('C:\Users\valla\Documents\Skill-Lync\HEV\MATLAB for Mechanical Engineers\NASA Thermodynamics Data')
    mkdir(Species_name);
    cd(Species_name)


    %Plot of Cp, Enthalpy and Entropy for the local temperature range (low temperature: high temperature) specific for each species.


    figure(1)
    plot(T,cp,'linewidth',5,'color', 'r');
    xlabel('Temperature [K]')
    ylabel('Specific Heat(cp)[K]')
    title('Specific Heat(cp) vs Temperature [K]')
    image=getframe(gcf);
    imwrite(image.cdata,'Cp vs T.png')
    saveas(1,'specific_heat.jpg')
    grid on

    figure(2)
    plot(T,h,'linewidth',5,'color', 'b');
    xlabel('Temperature [K]')
    ylabel('Enthalpy(h)[K]/(mol)')
    title('Enthalpy(h)[K]/(mol) vs Temperature [K]')
    image=getframe(gcf);
    imwrite(image.cdata,'H vs T.png')
    saveas(2,'Enthalpy.jpg')
    grid on

    figure(3)
    plot(T,s,'linewidth',5,'color', 'g');
    xlabel('Temperature [K]')
    ylabel('Entropy(s)[K]/(mol-k)')
    title('Entropy(s)[K]/(mol-k) vs Temperature [K]')
    image=getframe(gcf);
    imwrite(image.cdata,'S vs T.png')
    saveas(3,'Entropy.jpg')
    grid on
    cd

    %Calculations of Molecular Weight
    [M] = Mol_Weight(Species_name);
    mw = sprintf('%sMolecular weight = %f',Species_name,M);
    disp(mw);


end
%Function for Specific Heat
function[cp] = specific_heat(b_1,b_2,b_3,b_4,b_5,b_8,b_9,b_10,b_11,b_12,local_mid_temp,T,R)
if (T>local_mid_temp)
cp = R*((b_1+(b_2.*T)/2)+(b_3.*(T.^2))+(b_4.*(T.^3))+(b_5.*(T.^4)));
else
cp = R*((b_8+(b_9.*T)/2)+(b_10.*(T.^2))+(b_11.*(T.^3))+(b_12.*(T.^4)));
end
%Function for Enthalpy

function[h] = Enthalpy(b_1,b_2,b_3,b_4,b_5,b_6,b_8,b_9,b_10,b_11,b_12,b_13,local_mid_temp,T,R)
if (T>local_mid_temp)
    h = (R*T).*((b_1+(b_2.*T)/2)+((b_3.*(T.^2))/3)+((b_4.*(T.^3))/4)+((b_5.*(T.^4))/5)+(b_6./T));
else
     h = (R*T).*((b_8+(b_9.*T)/2)+((b_10.*(T.^2))/3)+((b_11.*(T.^3))/4)+((b_12.*(T.^4))/5)+(b_13./T));
end
%Function for Entropy
function[s] = Entropy(b_1,b_2,b_3,b_4,b_5,b_7,b_8,b_9,b_10,b_11,b_12,b_14,local_mid_temp,T,R)
if (T>local_mid_temp)
s = R*((b_1.*log(T))+(b_2.*T)+((b_3.*(T.^2))/2)+((b_4.*(T.^3))/3)+((b_5.*(T.^4))/4)+(b_7));
else
s = R*((b_8.*log(T))+(b_9.*T)+((b_10.*(T.^2))/2)+((b_11.*(T.^3))/3)+((b_12.*(T.^4))/4)+(b_14));
end
%Function for Molecular Weight

function[M] = Mol_Weight(Species_name)

atomic_mass = [15.999,1.008,12.011,14.007,39.948];
elements = ['O','H','C','N','A'];
% Oxygen, Hydrogen, Carbon, Nitrogen, Argon

mol_w = 0;
for i = 1:length(Species_name)
    for j = 1:length(elements)
        if strcmpi(Species_name(i),elements(j))
            mol_w = mol_w + atomic_mass(j);
            z = j;
        end
    end
    mol = str2double(Species_name(i));
    if(mol>1)
        mol_w = mol_w + (atomic_mass(z)*(mol-1));
    end
end
M = mol_w;
end
OUTPUTS:
PLOTS FOR O2:
PLOTS FOR N2:
PLOTS FOR Co2:
COMMAND WINDOWS:
WORKSPACE WINDOWS:
The window where all the folders: