Week-4 Challenge WOT Condition Part-2
Aim: To study and perform the following condition by using Powertrain Blockset.
Objective:
- To study the difference between mapped and dynamic model of engine, motor and generator and also How can we change model type?
- To descibe the how does the model calculate miles per gallon? and which factors are considered to model fuel flow?
- To run the HEV ReferenceApplication with WOT drive cycle. Change the grade and wind velocity in the environment block. Comment on the results.
- To compare the simulated result of hybrid and pure electric powertrains are keeping all other parameter same.
Powertrain Blocksset:
Powertrain Blockset provides fully assembled reference application models of automotive powertrains, including gasoline, Diesel, hybrid and electric systems. It includes a component library for simulating engine subsysteams, transmission assemblies, traction motors, battery packs and controller models.Powertrain Blockset also includes a dynamometer model for virtual testing.
Automotive teams that are deploying Model-Based Design ofte look for a starting point for building system models and applying these models to design and testing. Developing a system model from the ground up requires significant effort and engineers with specialized skills. With powertrain blockset, we engineers can take advantage of a maintained, well-documanted and open set of models that can becustomized to their needs.
1 : What is the difference between mapped and dynamic model of engine, motor and generator? How can you change model type?
Ans:
a. The difference between mapped and dynamic models of engine, motor and generator is as follows:
In the mapped model
1) parameters are given through the lookup table. This data comes from the experiments, which can be used only to verify the conditions given.
2) It is also known as Global based model.
In the Dynamic model
1) we have to give each parameter of each block or parameters ndividually and we can change any parameters according to our need and conditions.
2) It is known as Real time based model
In Engine
Engine performance could be simulated wih the array of data interpreted in the system. whereas all conditions such as engine operation, power, efficiency could be measured accordingly.
In Motor
Motor specifications such as rpm, maximum efficiency, Heat and such specifications are to be enteed for simulating the results.
In Generator
Specifications of Battery Torque, Battery Current, Motor Torque and others are to be enterd for simulation.
How can we change model type?
As per the screenshot appended below of the Generator of a Hybrid Electric vehicle.
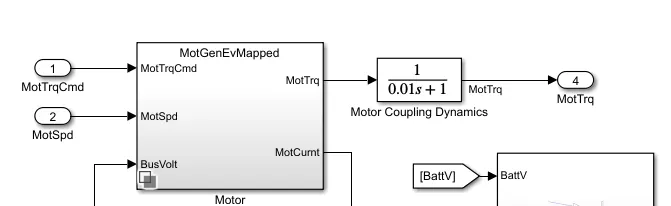
While we enter in the Generator new screen with the below mentioned screen is available
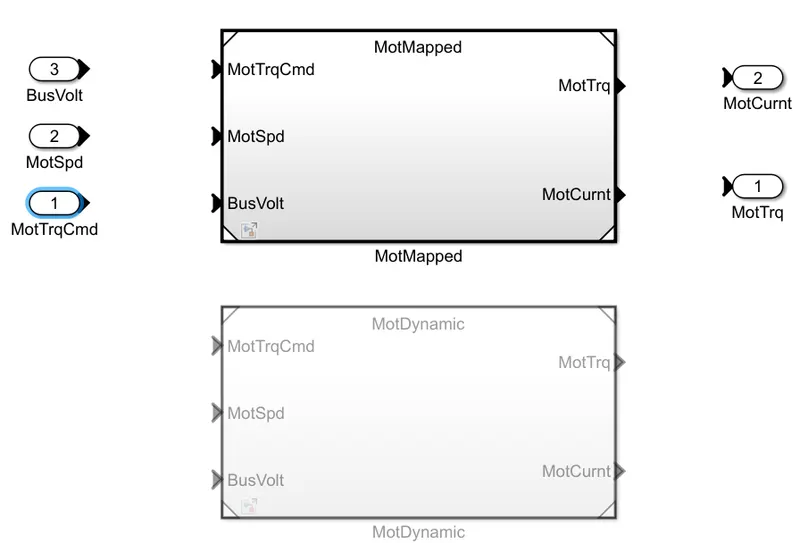
With an option to select between the Mapped Generator and the Dynamic generator. Currently the mapped Generator is configured, if we wish to change this to the dynamic generator then we just need to follow the steps
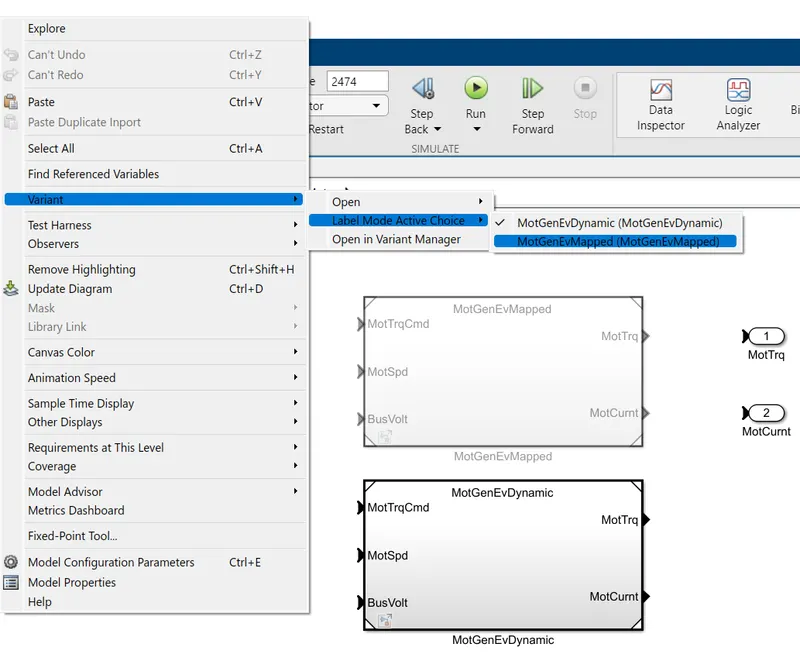
Select Model which you want to configure -> Choose Variant Manager -> Right Click the Model you wish to choose and then Set as Label Mode Active Choice.
2 : How does the model calculate miles per gallon? Which factors are considered to model fuel flow?
The factor consider for including the fuel efficiency are as mentioned below,
img performance calculation
Vehicle Speed
Battery Power
Fuel Flow
Calculation of miles per gallon in 'EV Reference Application' model:-
1) Open 'EV Reference Application' model in matlab and inside the visualisation block we can see the blocks which can see the blocks which are used for calculation of MPG.
2) Now open the performance calculation block as shown below fig.
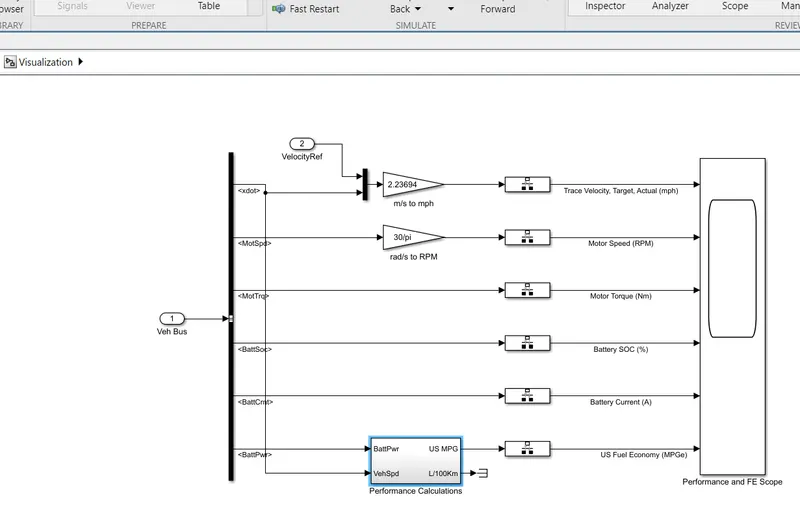
Conversion from Cubic Meter to gallon (M^3 o gallon),
As we know,
- 264.172 US Gallons is 1000L
- 1 Gallon = 33.7 killowatt hours of energy in electric vehicles.
3)Here vehicle speed (x) is multiplied itself and the square rooted. Then value is then integrated (1/s) and converted intometers(m). Then Master is converted into miles in the block (m to mile) then it is divided by US Gal to get US MPG.
4) For US Gallon we need to divide by battery power divided by 1000 and then dividede by 33.7 . Then the meter is converted into from sec to hours by dividing with 3600 then it is converted to m^3 per gal.
5) The value is finally converted into Gallon and used as MPG after dividing miles with gallon.
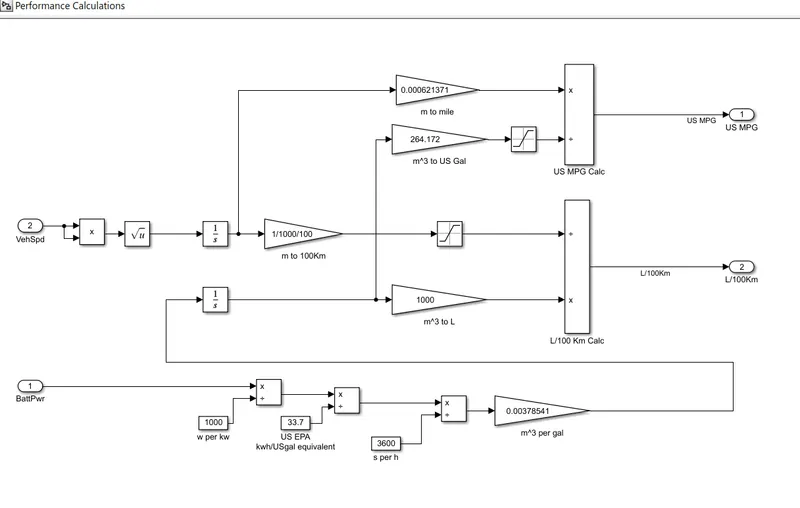
The reference model taken hee for consideration is HEV and as it operates on both the battery and fuel Injection Engine.
The final output/Fuel Efficiency is calculated by keeping in consideration of the Battry Output, Fuel Output and the Vehicle Speed/Kilometers Driven.
Therefore the fuel efficiency is calculated and it is converted after the saturation thus the FE is calculated.
Factors considered in the model fuel flow are Fuel Economy and Fuel Consumption.
Fuel Economy:
The fuel economy of an automobile relates to distance by a vehicle and the amount of fuel consumed. Consumption can be expressed in terms of the volume of fuel to travel a distance, or the distance traveled per unit volume of fuel consumed. Different methods are used to approximate the actual performance of the vehicle.The energy in the fuel is required to overcome various losses (like wind resistance, tire drag, and others parameters) encountered while propelling the vehicle, and in providing power to vehicle systems such as ignition or air conditioning. Driver's behavior can affect fuel economy such as sudden acceleration and heavy braking waste energy.
The Major factors that are considered in the Fuel Economy speed
- Engine Speed
- Motor Torque
Fuel Consumption: Fuel Consumption is the inverse of fuel economy. It is the amount of fuel consumed in driving with a given distance.
3 : Run the HEV ReferenceApplication with WOT drive cycle. Change the grade and wind velocity in the environment block. Comment on the results.
Hybrid Electric Vehicle:
- A Hybrid electric vehicle (HEV) is a type of hybrid type that combines a conventional Internal combustion engine(ICE) system with an electric propulsion system.
- The presence of electric powrtrain is intended to achive either better fuel economy than a conventional vehicle or better perfomance.
- Example of HEV is Toyato Prius.
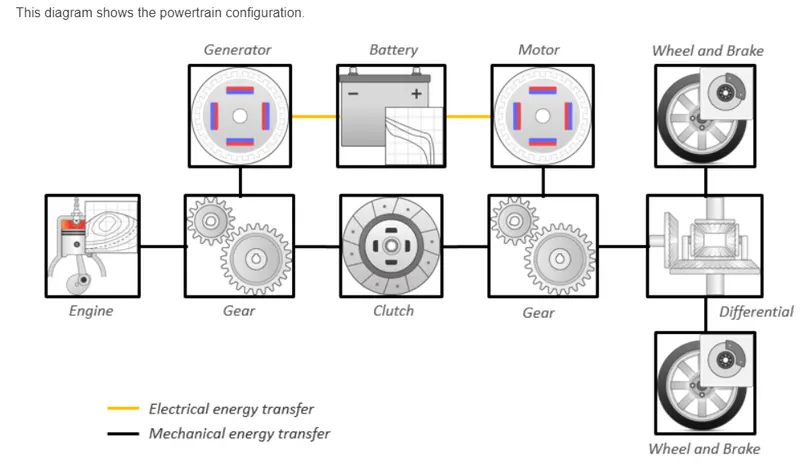
This diagram shows the powertrain configuration.
 image
image
HEV Reference ApplicationModel:-
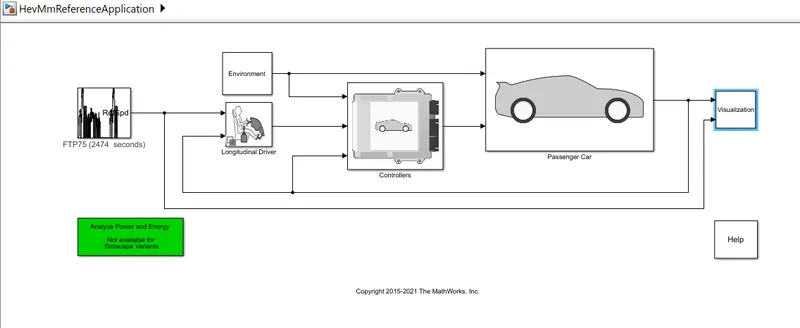
Description:-
1) Open 'HEV Reference Application model' in MATLAB.
2) It consist of various Subsystem as similar to 'EV Reference Application' but the compelexity is more in 'HEV Reference Application model'.
Case 1:-
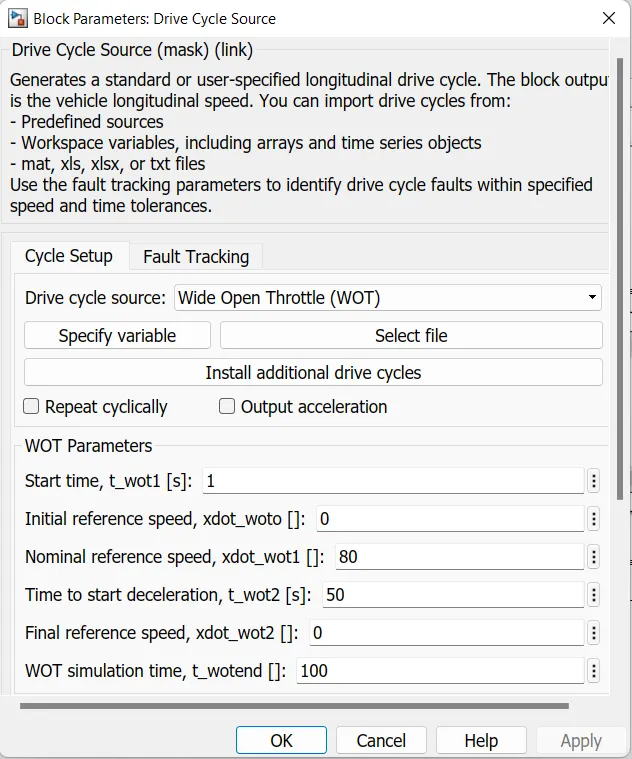
The default driver cycle is FTP75 with 2474sec.Now change it to WOT driver cycle as below with WOT simulation time as 100sec and click on 'OK'.
Performance Scope - WOT Cycle
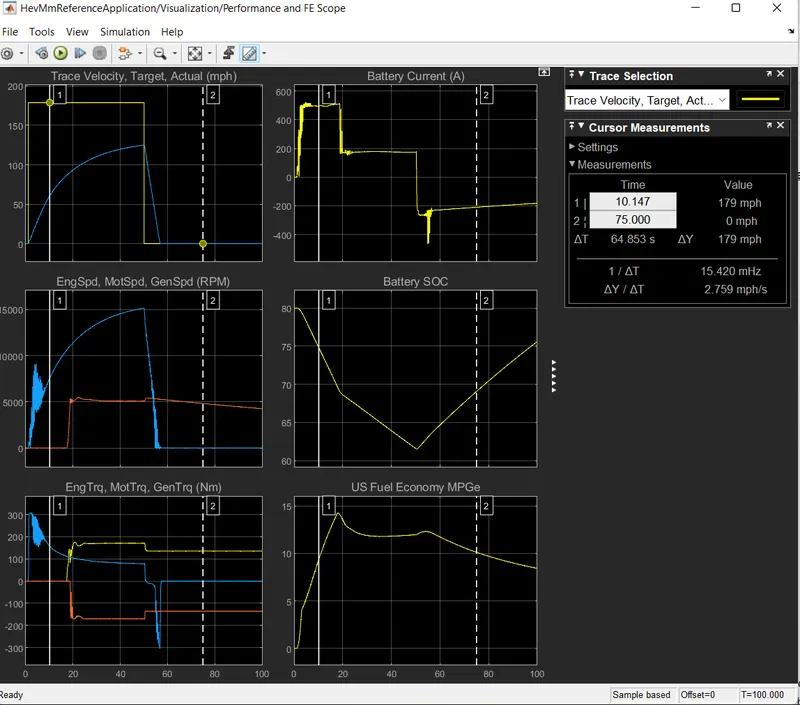
Observations:
1. Plot 1 (Trace Velocity Target vs Actual)- Through this plot it is denoted that the desired velocity has not been met by the actual vehicle velocity. The desired velocity was ranging at near about 140 mph but the actual velocity achieved was near to 110 mph.
2. Plot 2 (Engine speed, motor speed)rpm- This plot gives the detailed analysis for the achieved Engine and Motor speed in rpm. The contribution of both the power Generating sources for meeting the required velocity.
3. Plot 3 (Engine Torque, Motor Torque and Genrator Torque)Nm - This plot gives the detailed analysis of the engine, Motor Torque and Genrator Torque.
4. Plot 4 (Battey Current) A - This plot denotes the power produced by the battery and the readings are in Ampere.
5. Plot 5 ( Battery SOC ) - This plot denotes the State of Charge of the battery,this denotes the range of charge used for the achievement of velocity.
6. Plot 6 (US Fuel Economy) MPGe - This is the Fuel efficiency or the Range of he drive and the same is denoted in Miles Per Gallon equivalent.
Case 2:-
WOT Cycle with changes in Grade and Wind Velocity
The variable input for the change in these aspects are as given below,
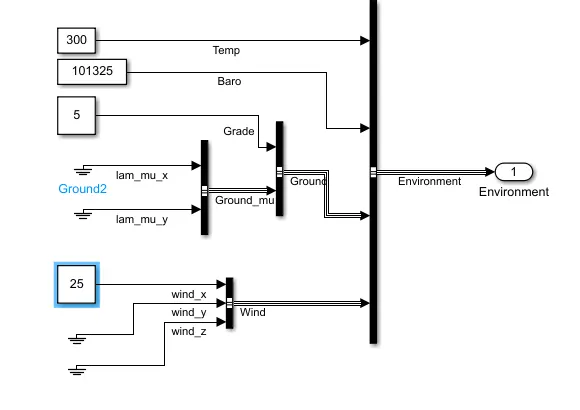
The Observations from the results as compared to the normal situations are mentiond below,
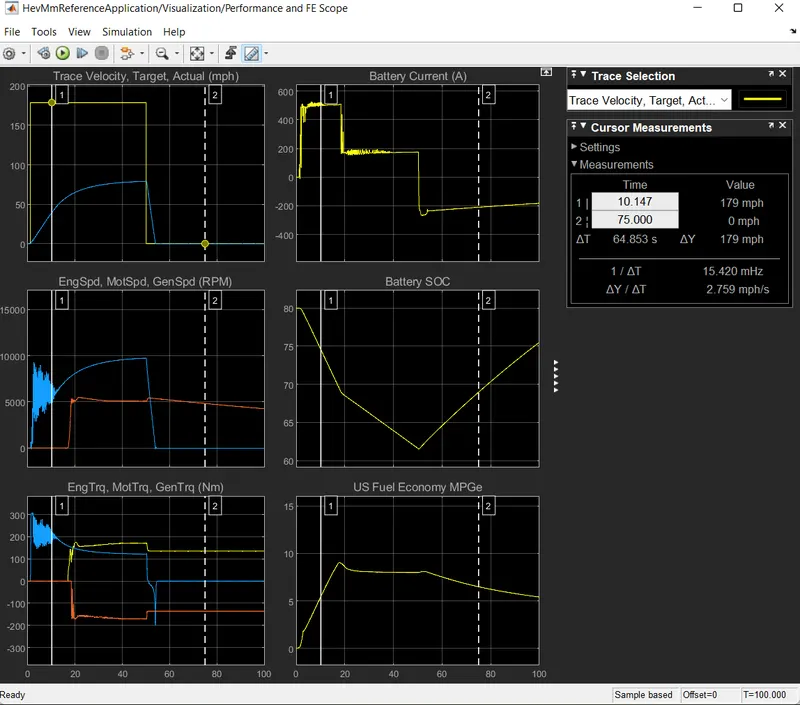
Comments/ Comparison of the results obtained.
1. Plot 1 (Trace Velocity Target vs Actual)- This is clearly visible that as the grade and the wind velocity is increased compared to the normal state the vehicle is not able to reach the target velocity.
2. Plot 2 (Engine speed, motor speed)rpm- In this plot comparing with the normal plot the Engine Speed has reduced to a steep slope on the negative side as compared to the normal situation the grade is increasing the load on the engine and thus the targeted Engine Speed is not met.
3. Plot 3 (Engine Torque, Motor Torque and Genrator Torque)Nm - There are multiple variations in all these aspects and the same is visible in both the results of Normal and with the Grade and Wind Velocity.
4. Plot 4 (Battey Current) A - Battery current has been fluctuating at a higher ranges as compared to the normal after the vehicle is reaching near to steady / stable space the fluctuation starts and is simulated.
5. Plot 5 ( Battery SOC ) - The battery State Of Charge remains more or less siilar in both the cases and are resulted at 65% after the end of the WOT cycle.
6. Plot 6 (US Fuel Economy) MPGe - The average fuel economy differ in the range of 6 & 8 mph in both scenarios.
4 : To compare the simulated result of hybrid and pure electric powertrains are keeping all other parameter same.
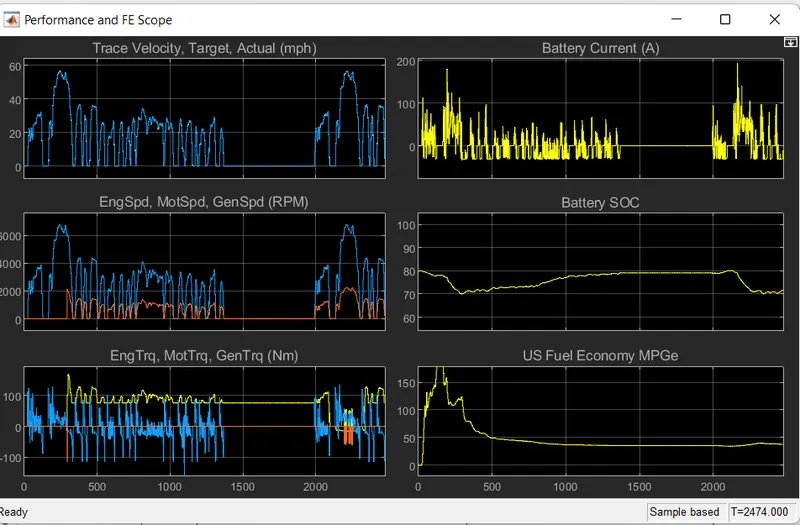
Case 1:- HEV Multimode Reference Application
1) Open HEV Reference Application model in MATLAB.
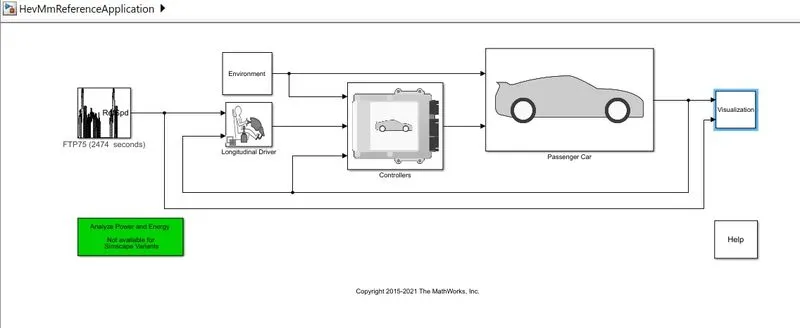
2) The model consist of Environment, Drive cycle, Longitudinal Driver, Passenger and Visualisation Susystem.
3) Open the environment block and change the grade value to 5 and wind velocity to 25.
4) Now run the simulation with 2474 seconds and go to visualization to see the graph.
Model:-
Result:
Case 2:- EV Reference Application Model
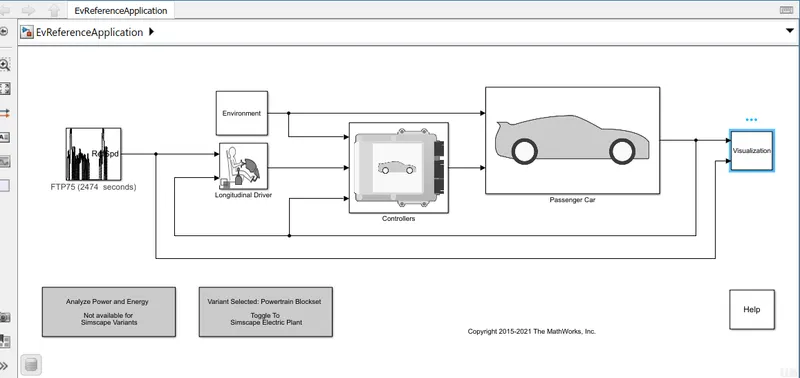
1) Open EV Reference Application model in MATLAB.
2) The model consist of Environment, Drive cycle, Longitudinal Driver, Passenger and Visualisation Subsystem as similar to HEV but as it is a pure electric vehicle the compelexity in the model is less and the rendering time is less.
3) Open the environment block and change the grade value to 5 and wind velocity to 25.
4) Now run the simulation with 2474 seconds and go to visualization to see the graph.
MODEL:-
Result:
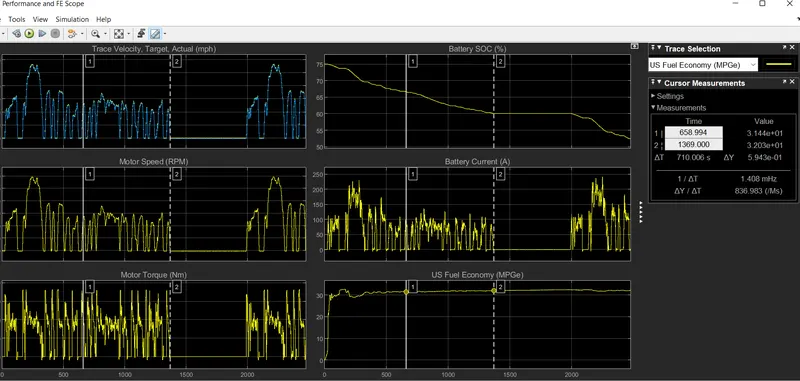
Remark-
The overall difference in both these simulations are their vehicle operations where the EV is completely operated on Battery as the Power Score and on the other hand the HEV has two power sources SI/CI Engine and battery. The results obtained are varied and the parameters are also differenciated accordingly.