Challenge WOT Condition Part-2
Q1. What is the difference between mapped and dynamic model of engine, motor and generator? How can you change model type
SOLUNTION:
Mapped Model uses a set of steady-state lookup tables to characterize engine performance. Mapped engines represent macro engine behaviour as function of commanded load and measured engine speed. Mapped engine models are suitable for analysis and design activities that do not require engine subsystem characteristics.
Mapped model can be simply referred to a static system
Dynamic model decomposes the engine behavior into engine characteristics that are separated into lower-level components. By combining components in this way, the models capture the dynamic effects. Dynamic model can be considered as micro level solver which uses actual component data to characterize engine performance.
The dynamic engine model is usually slower while operating.
Q2. How does the model calculate miles per gallon? Which factors are considered to model fuel flow?
Miles per Gallon is a fuel economy rating determined by how far a vehicle can travel on a gallon of fuel. In this case calculation of battery power and vehicle speed in miles per Gallon is used to compare the value with engine fuel consumption.
The vehicle speed and battery power are input to compare the fuel economy of engines with battery. In order to do that battery power to gallon and vehicle speed to miles following are the steps .
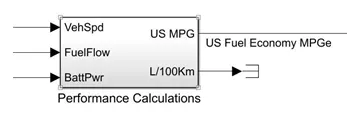
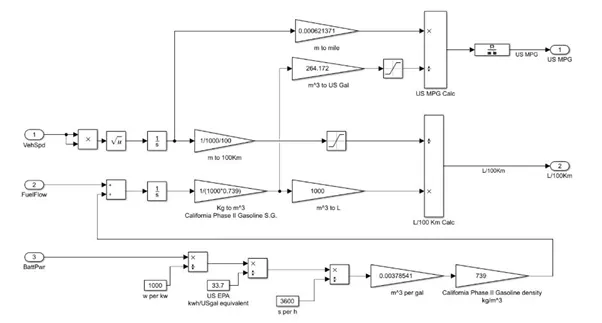
- Vehicle speed is integraed to obtain the distance > converted into kilo-meter and miles by multiplying and dividing with the appropiate value
- Battery power > converted into kw> Kw/gal equivalent value>KW-sec. The volume flow rate of the value is expressed into m^3 > intergrated w.r.t time to obtain volume of fuel.
- Factors considered to model fuel flow are Vehicle speed and Battery power
Q3. Run the HEV Reference Application with WOT drive cycle. Change the grade and wind velocity in the environment block. Comment on the results.
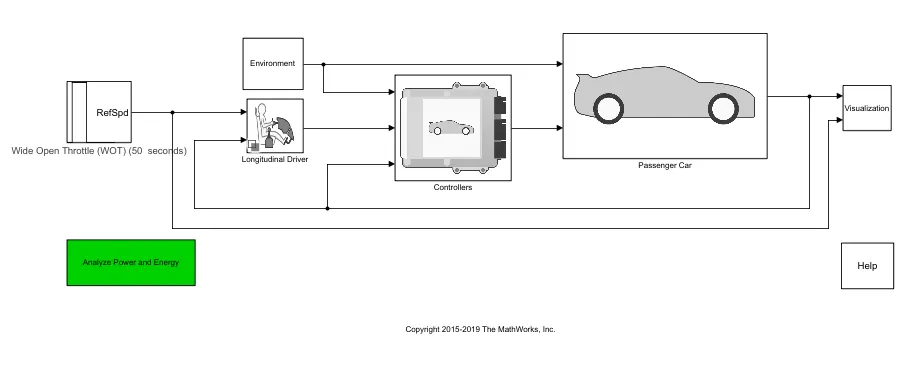
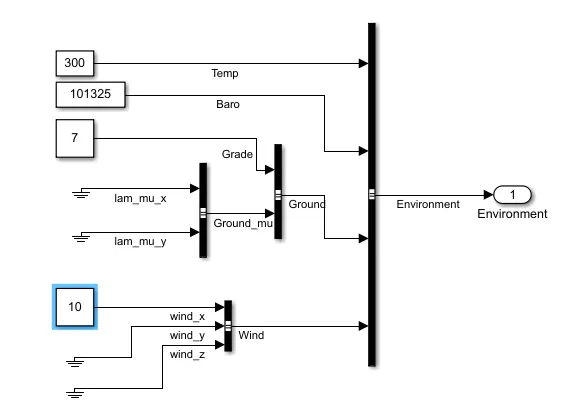
Gradeability=7%
Wind Velocity=10
Total Simulation time=50sec
RESULTS:
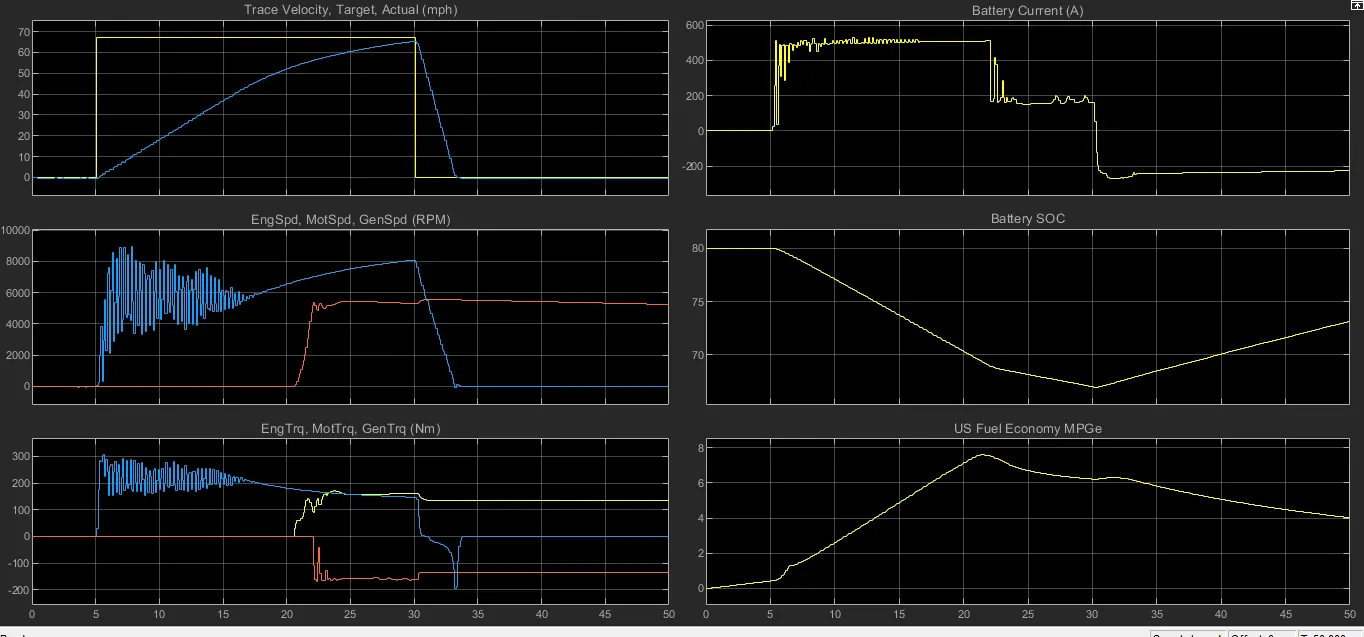
There is a difference between actual velocity curve and the input curve due to the limitation on maximum power available from Energy source
The max 500 A of current can be delivered due to limitation factor
During deacceleration negative torque is obtain.
Q4 Keeping all other parameters same, compare the simulated results of hybrid and pure electric powertrains.
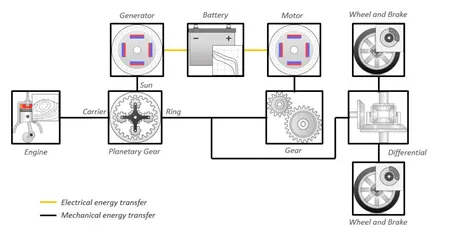
HEV:
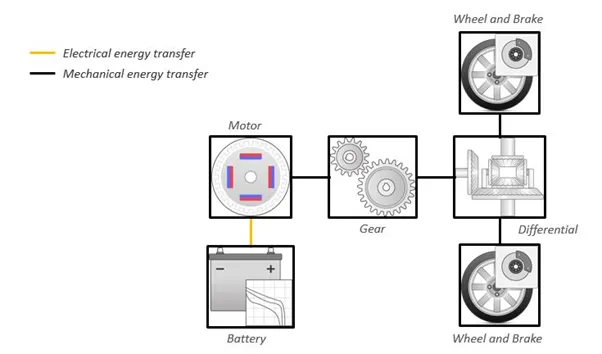
EV:
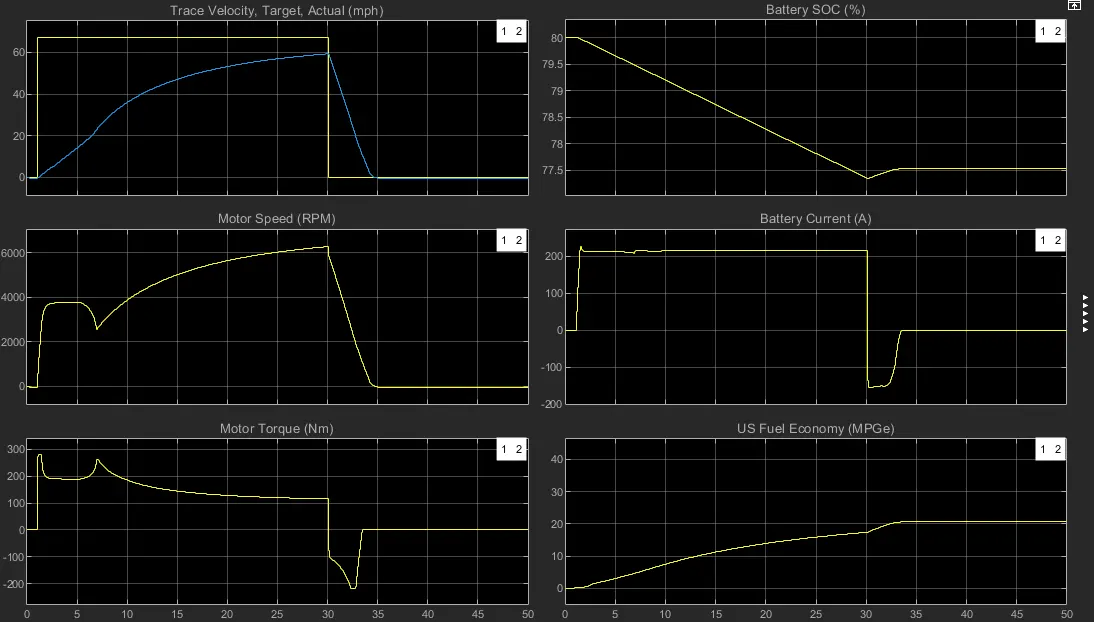
EV SIMULATION RESULT:
CONCLUSION:
| Hev | EV | |
| Grade(DEG) | 7 | 7 |
| Wind Velocity (m/s) | 10 | 10 |
| Maximum speed(mph) | 70 | 60 |
| Deceleration time(s) | 30 | 30 |
| Max Battery Current Drawn | 500 | 200 |
| Battery SOC | 80%-69% | 80-77.5% |
| Fuel Economy | 8 | 20 |
Ev takes more time to reach the top speed.
US Fuel economy of EV is higher than HEV.
The Discharging rate in the EV is lower compared to the HEV and the Battery SOC is also higher in the EV.