Week-4 Challenge WOT Condition Part-2
Q.1.
MAPPED MODEL:
engine: The Mapped SI Engine block implements a mapped spark-ignition (SI) engine model using power, air mass flow, fuel flow, exhaust temperature, efficiency, and emission performance lookup tables. The engine performance could be simulated with the array of data interpreted in the system, whereas all conditions such as engine operations, power, and efficiency could be measured accordingly.
motor: The Mapped Motor block implements a mapped motor and drives electronics operating in torque control mode. The output torque tracks the torque reference demand and includes a motor-response and drive-response time constant. The motor specifications such as rpm, maximum efficiency, heat, and such specifications are to be entered for simulating the results.
generator: in the map to generator block the specifications for battery torque, battery current, motor torque, and others are to be entered for simulation.
DYNAMIC MODEL:
A dynamic model represents the behavior of an object over time. It is used where the object's behavior is best described as a set of states that occur in a defined sequence.
Engine: The model decomposes the engine behavior into engine characteristics that are separated into lower-level components. By combining components in this way, the models capture the dynamic effects. Engine performance will be simulated as per the original engine specifications of the designated vehicle. All the results are obtained with real-time details.
motor: dynamic modeling of an induction motor is defined as the representation of the dynamic characteristics of an induction motor using mathematical equations. Hence, to model an induction motor we need to derive the mathematical equations that show the relationships of the motor. The actual details of rpm, maximum efficiency, heat, and such specifications are considered and the results are obtained.
generator: The dynamic modeling of the generator includes various types of specifications and details that are considered as per the actual and dynamic state and the results of the same are then obtained.
| Mapped | Dynamic | |
| Features | In map models the data used for operation and simulation add to be entered in a form of a lookup table which would then be configured with the operational parts and the analysis would be formed. | In the dynamic model it understands the behavior of the part and then it behaves accordingly it gives detailed analysis for the variations entered by us in the specifications whereas it simulates according to the real and dynamic operations. |
| Advantages | If the detailed specifications or the lookup table data is available with us the simulation becomes easier and it gives the result on the basis of data interpreted it is also known as a global-based model | it operates dynamically depending on the situation of operation detailed data and specifications are not required and the simulation gives a detailed analysis of the components simulated it is also known as a real-time-based model. |
| Disadvantages | more data has to be collated and some assumptions might also have to be taken. | Could not simulate as per our customized specifications. |
How to change the model type:
- In the powertrain block set module, we first need to select the vehicle time and see whether it is a full electric full engine or the type of hybrid vehicle
- After the start, the Simulink model appears by showing the workflow block of the model
- In that, we need to go to the passenger block electric plant* EV motor or generator block
- After this just right-click and go to the variance label mode active choice motor GenEV mapped or dynamic.
Q.2.
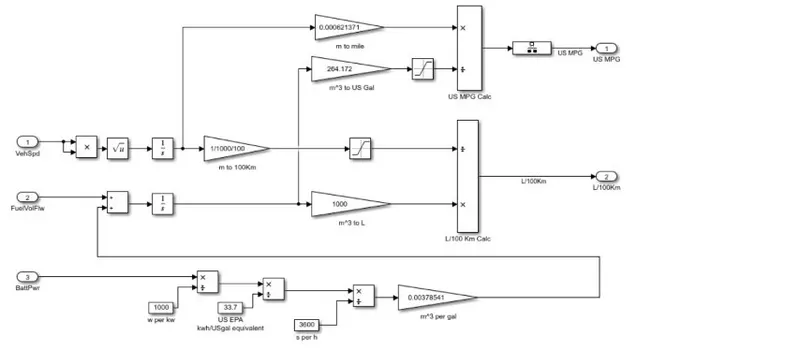
- MPG, or miles per gallon, is the distance, measured in miles, that a car can travel per gallon of fuel. MPG is also the primary measurement of a car's fuel efficiency: The higher a car's MPG, the more fuel-efficient it is.
- A car's MPG can be inconsistent because it is affected by a number of different factors, so it is difficult to get an accurate measurement. The factors responsible are mentioned below:
- Vehicle Speed
- Traffic
- Road conditions
- Battery power
- Fuel flow
- That's why the EPA runs tests over a standard set of courses, then averages the results to calculate a vehicle's official MPG.
- MPG is an important metric to know about any vehicle that you're considering purchasing. It tells you about the difference in cost between operating different vehicles by giving you a sense of how much money you're likely to spend on fuel. This becomes especially important when fuel prices are higher, since every bit of savings counts for your budget.
- While MPG can help you compare different vehicles, it doesn't tell you anything about real-world fuel prices. However, you can easily calculate approximately how much you'll spend on fuel at different price levels, depending on how much distance you drive on a regular basis.
We can convert l/100km to MPG by dividing 282.5 by the car's l/100km. Conversely, divide 282.5 by a car's MPG to get its fuel consumption in l/100km.
Q.3.
Hybrid electric vehicle: an automobile or other vehicle that is powered by an internal-combustion engine and an electric motor whose battery is charged by the engine and by regenerative braking that converts the vehicle's kinetic energy into electricity called the hybrid electric vehicle.
HEVs combine the benefits of high fuel economy and low tailpipe emissions with the power and range of conventional vehicles.HEVs use fuel as a primary source of power and do not require an external electrical source to recharge their batteries. A true HEV has both an internal combustion engine (ICE) and an electric motor. A hybrid vehicle utilizes a 12-volt lead-acid battery and gasoline like a traditional vehicle while also pulling energy from an electric battery.
Reduced noise emissions resulting from substantial use of the electric motor at idling and low speeds, lead to roadway noise reduction, in comparison to conventional gasoline or diesel-powered engine vehicles, which result in beneficial noise health effects (although road noise from tires and wind, the loudest noises at highway speeds from the interior of most vehicles, are not affected by the hybrid design alone). Example - Toyota Prius.
HEV-WOT drive cycle (input data)
Cycle time - 60 seconds
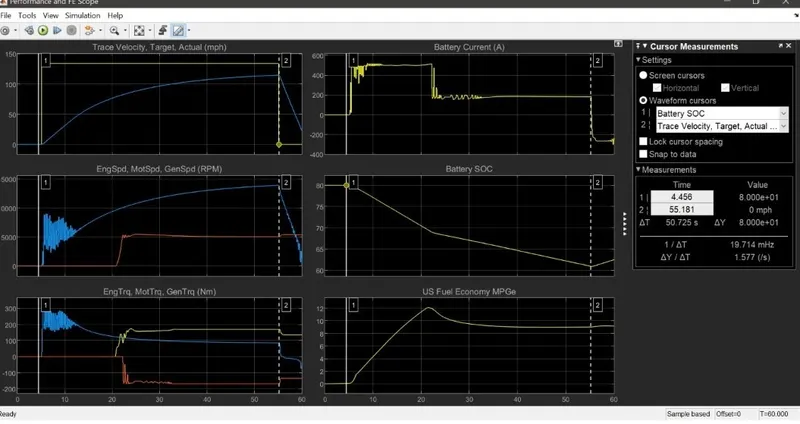
Plot 1
we have got the desired velocity. The desired velocity was ranging near 140 mph but the actual velocity achieved was near 100 mph.
Plot 2
This plot gives a detailed analysis of the engine and motor speed in rpm.
Plot 3
This plot gives a detailed analysis of the motor torque, engine, and generator torque.
Plot 4
This plot shows the power produced by the battery in Ampere.
Plot 5
This plot gives the SOC (State Of Charge) of the battery, which denotes the charging range used to achieve the velocity.
Plot 6
This plot denotes the driving range or the fuel efficiency which is denoted by the Miles Per Gallon equivalent.
Changing the grade and wind velocity,
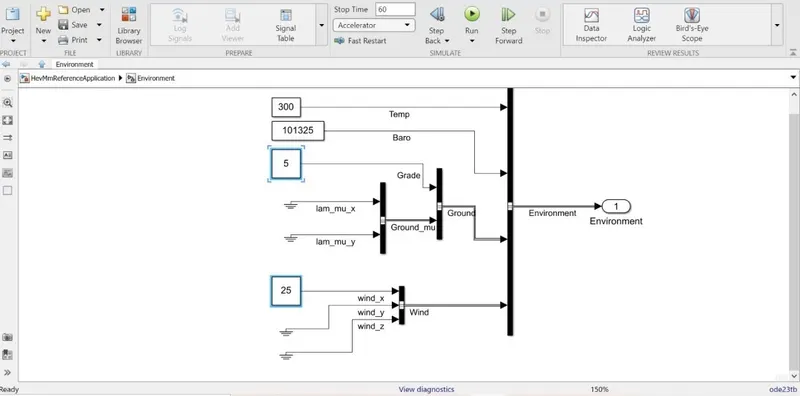
accordingly, we get the result as below:
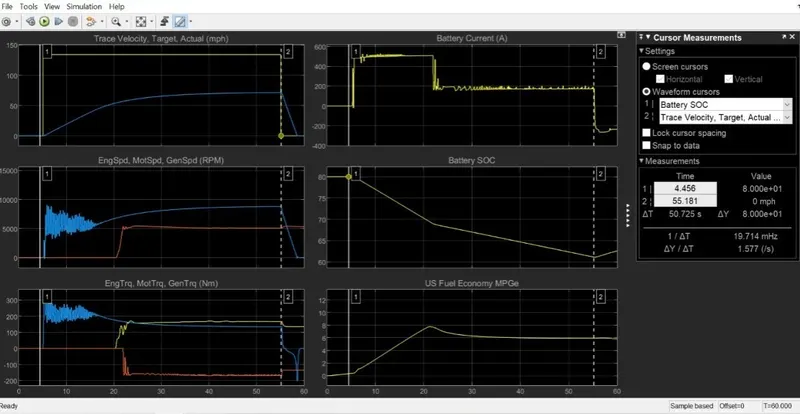
Plot 1
This plot gives the actual vs trace velocity target. As the grade and wind velocity increase compared to the normal state, the vehicle does not reach the velocity target.
Plot 2
This plot denotes the engine and motor speed. As compared to the normal plot, the engine speed here reduces to a steep slope on the negative side and as compared to the normal situation, the grade increases the load on the engine and hence the target engine speed is not met.
Plot 3
This plot gives the engine torque, motor torque, and generator torque, which have multiple variations that are visible in both normal and grade and wind velocity.
Plot 4
This plot gives the battery current that has been fluctuating at a higher range as compared to the normal after the vehicle is reaching near to a stable place, the fluctuation starts and is simulated.
Plot 5
This plot denotes the SOC of the battery which remains almost the same in both cases and comes out to be 65% at the end of the WOT cycle.
Plot 6
This plot denotes the fuel economy in which the MPGe - that average fuel economy differs in the range of 6 and 9 mph in both the scenarios.
Q.4.
As given in the question, keeping all the parameters same, we will compare the simulated results of hybrid and pure electric power train
Vehicle simulated for EV
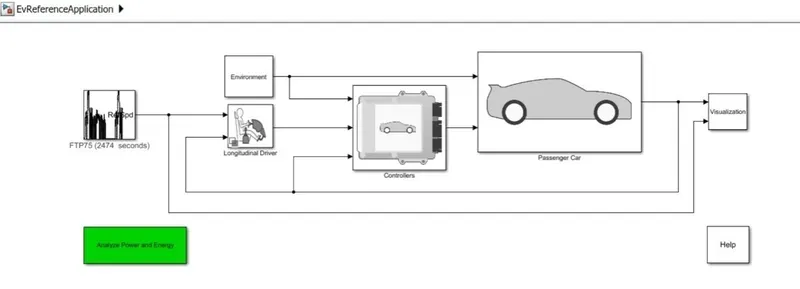
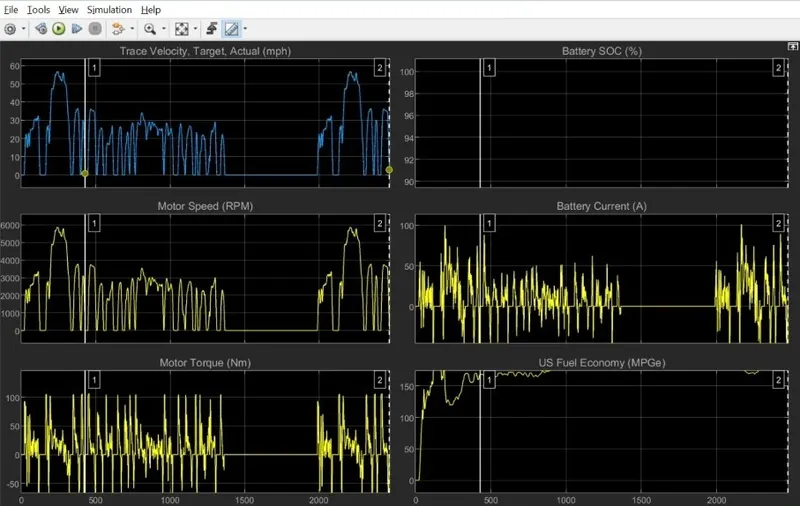
The result obtained is as follows.
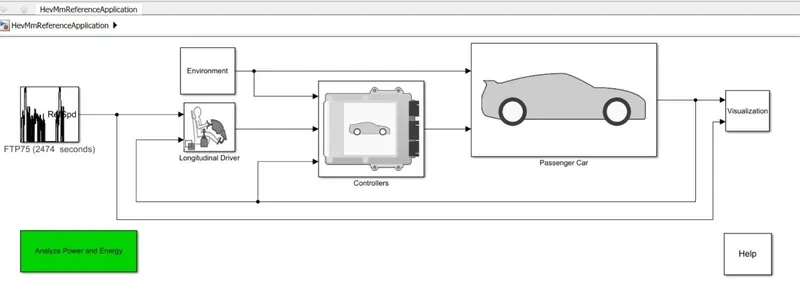
Simulation for HEV is as follows:
The result obtained os as follows:
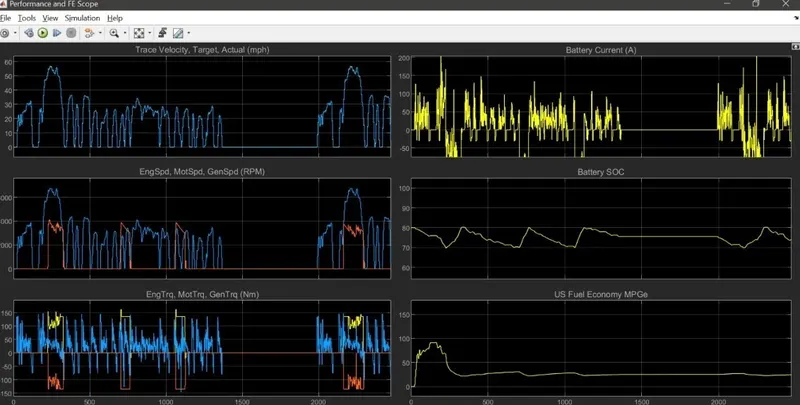
hence EV is completely operated on the battery as the power source and on the other hand, the HEV has 2 power sources engine and battery. The results obtained are varied and the parameters are also differentiated accordingly.