Week-3 Challenge: ADVISOR Tool
Advisor tool definition :
Advanced Vehicle Simulator (ADVISOR) was first developed in November 1994 at the National Renewable Energy Laboratory (NREL). It was designed as an analysis tool to assist the US Department of Energy (DOE) in developing technologies for hybrid electric vehicles (HEV) through the Hybrid Electric Vehicle Propulsion System contracts with Ford, General Motors, and Daimler Chrysler. Its primary role is to highlight the system-level interactions of hybrid and electric vehicle components and their impacts on vehicle performance and fuel economy.
ADVISOR was created in the MATLAB/Simulink environment. MATLAB provides an easy-to-use matrix-based programming environment for performing calculations while Simulink can be used to represent complex systems graphically using block diagrams. ADVISOR uses three primary graphical user interface
(GUI) screens to guide the user through the simulation process. With the GUIs, the user can iteratively evaluate the impacts of vehicle parameters and drive cycle requirements on the vehicle performance, fuel economy, and emissions.
The GUIs facilitate interaction with the raw input and output data that is present in the MATLAB workspace. The vehicle model is depicted graphically using Simulink block diagrams to define the connections between components. The model then reads the input data from the MATLAB workspace during the simulation and outputs the results to the workspace to be viewed in the results window.
Advantages of ADVISOR
- Rapid analysis of the performance of the car getting analyzed.
- Estimate the fuel economy of conventional and hybrid electric vehicles that have not yet been built, which saves a lot of energy and time.
- It uses a backward flow i.e driving cycle to energy storage.
- The vehicle models are mostly experimental, i.e, relying on drivetrain input/output relationships measured in the laboratory.
- Only lookup tables and no built-in MATLAB models.
This tool is installed and the file is added to MATLAB. In the command window when the advisor command is given, the advisor tool is opened. By clicking start, the default setting of the advisor is shown.
It has 3 windows,
- The vehicle input window
- Simulation parameter window
- Result window
Q.1
According to the instructions given in question 1, For the EV_defaults_in file, the cargo mass is set to 500 kg with all other default conditions.
we get the calculated mass as 1508 kg, as shown in the figures below.
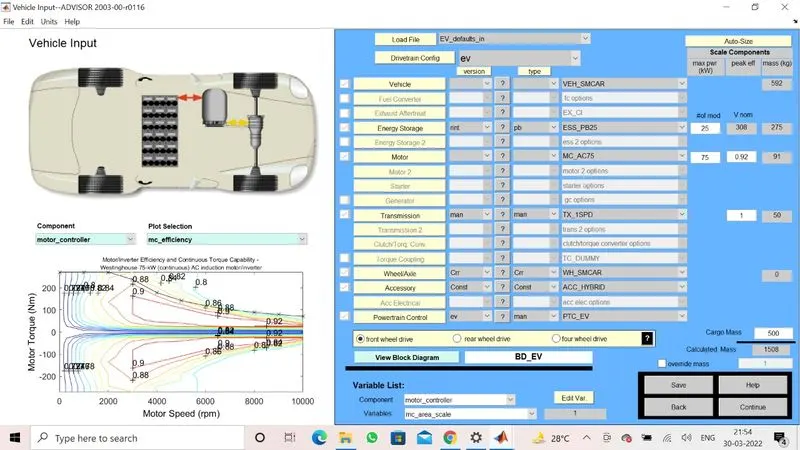
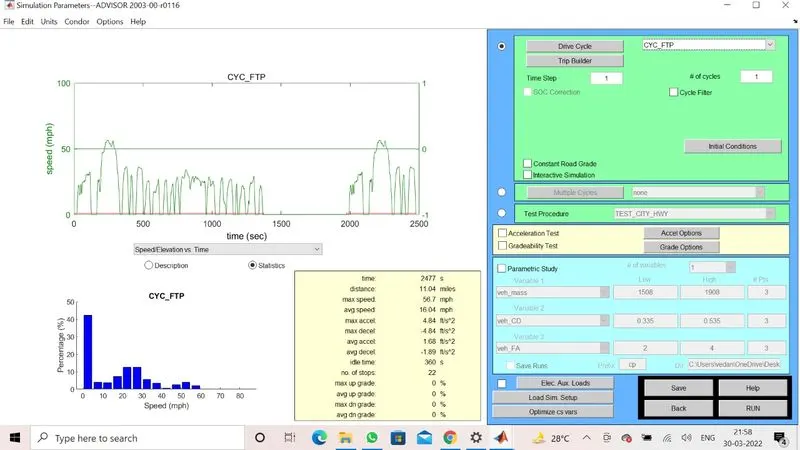
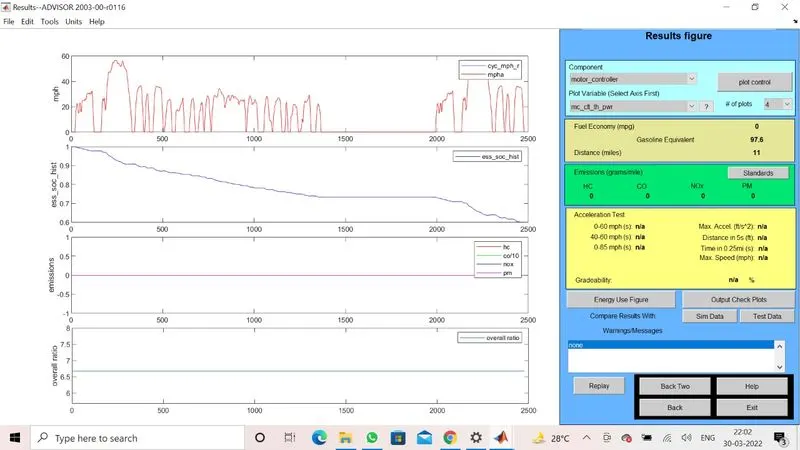
The distance traveled is 11 miles = 17.703 km i.e almost 40% of the SOC is used.
Now increasing the no. of cycles to 2 we get the following outcome.
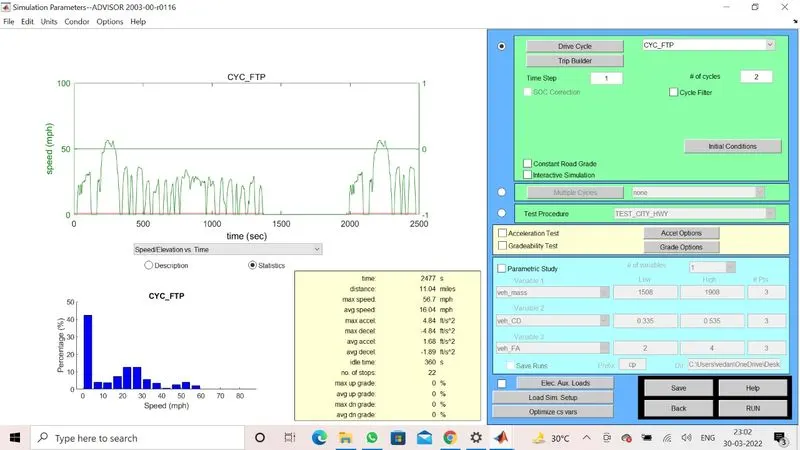
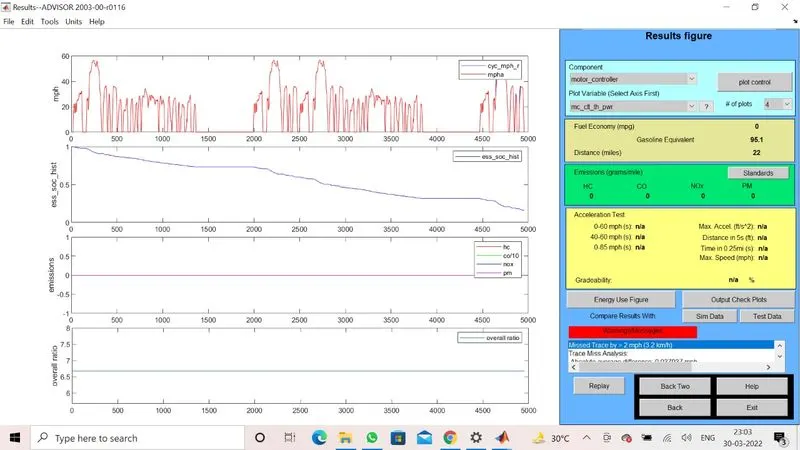
here the distance travelled is = 22 miles = 35.406 km.
In this cycle more than 50% SOC is used.
now again increasing the no. of cycles to 3, we analyze the cycle as given below.
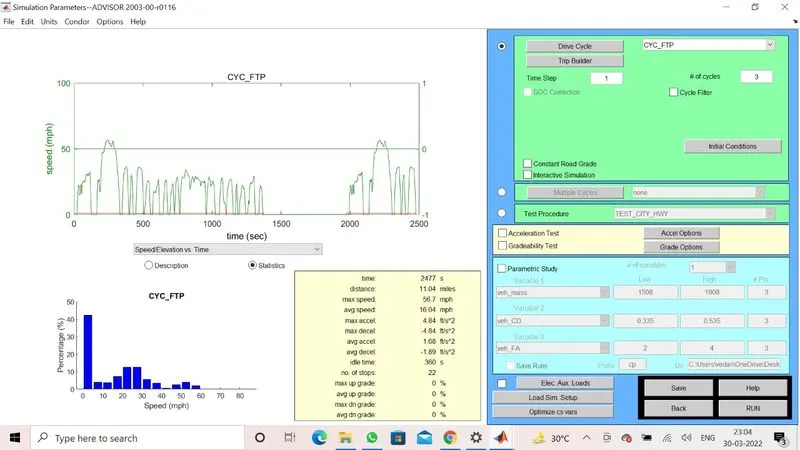
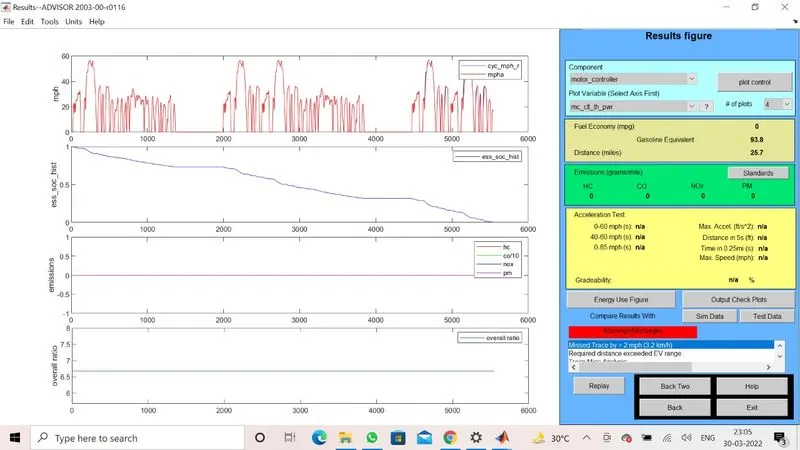
as we can see, the distance traveled is = 25.7 miles = 41.36 km.
Conclusion
Also, the SOC is fully used, no more driving cycles can be produced. Hence we can conclude that
the minimum distance traveled by car is 17.703 km and the maximum distance traveled is 41.36 km.
Q.2. In the above case, try changing the battery capacity and repeat the simulation.
By changing the battery capacity from 25 to 40, the simulation is shown below
also as we need a 45 km distance to be covered, we can use 3 drive cycles.
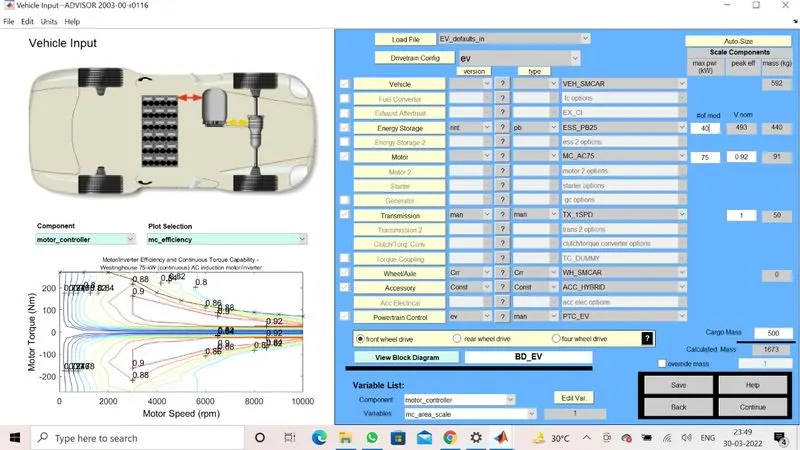
simulating with 2 drive cyces
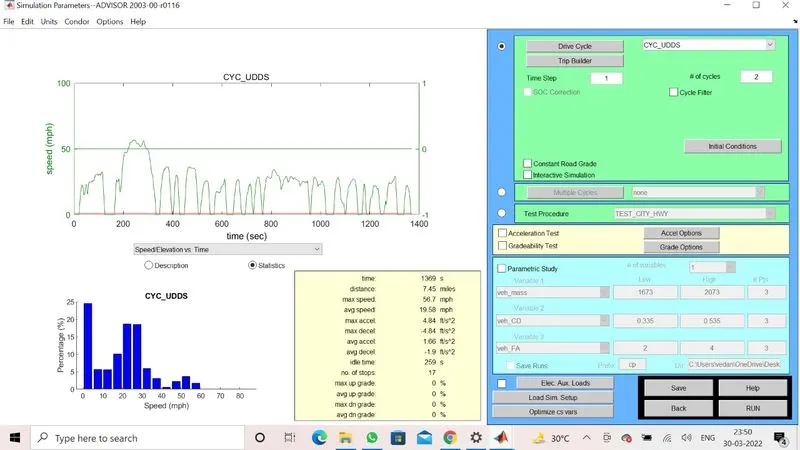
result
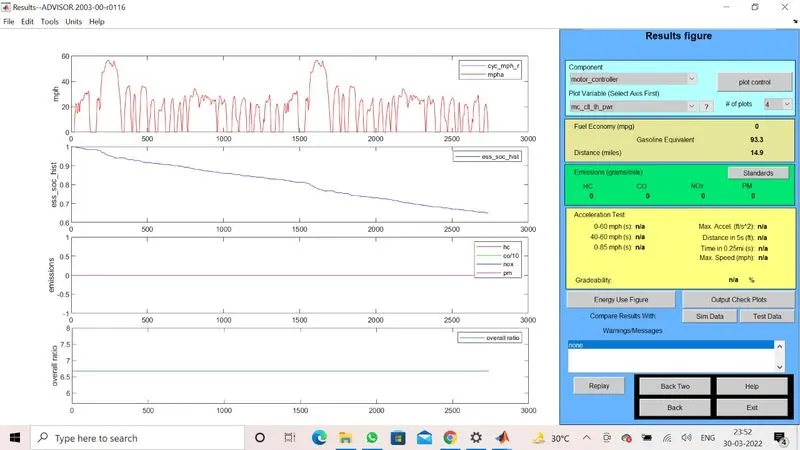
we have the distance traveled = 14.9 mile = 23.979 km
Now the result for simulation with 3 drive cycles is given below.
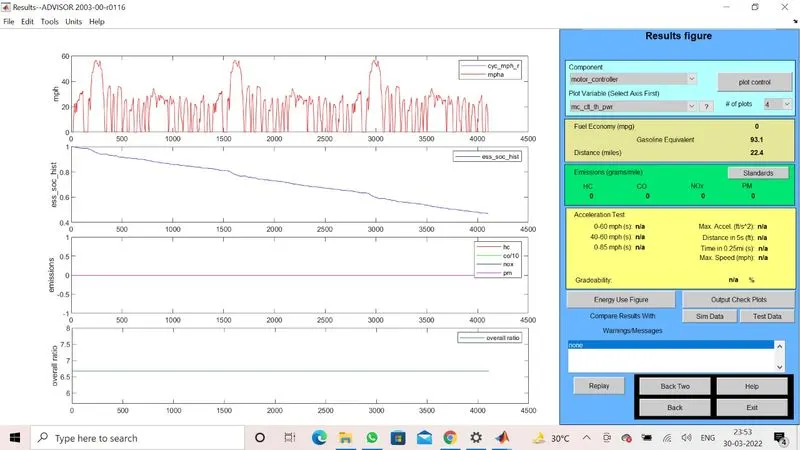
we have the distance traveled = 22.4 miles = 36.049 km.
Q.3.
Perform gradeability test with PRIUS_Jpn_defaults_in file
Compare your results in a table and conclude.
solution:
To perform a gradeability test on the PRIUS_Jpn_deafaults_in we need to select the given model in the advisor tool and its data will be shown as below.
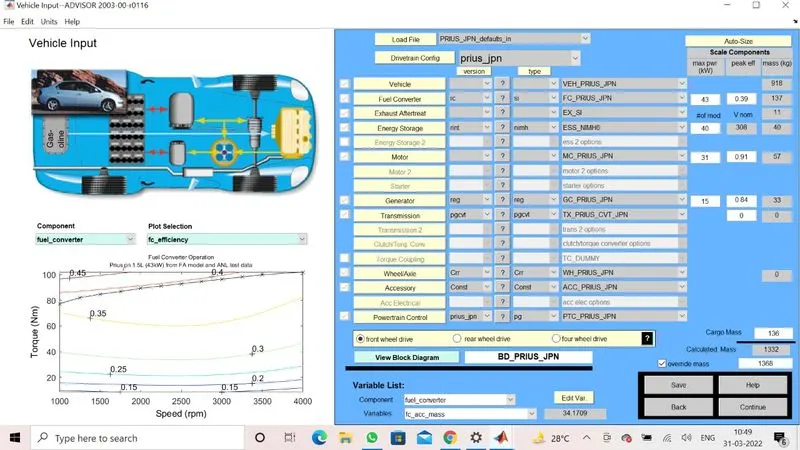
Then we click on the continue button to go to another window. In this window we can see the grade options where we will set the speed of the car from 20 to 45 and run the simulation to get the results.
1. For speed =20 miles/h or 32.2 kmph
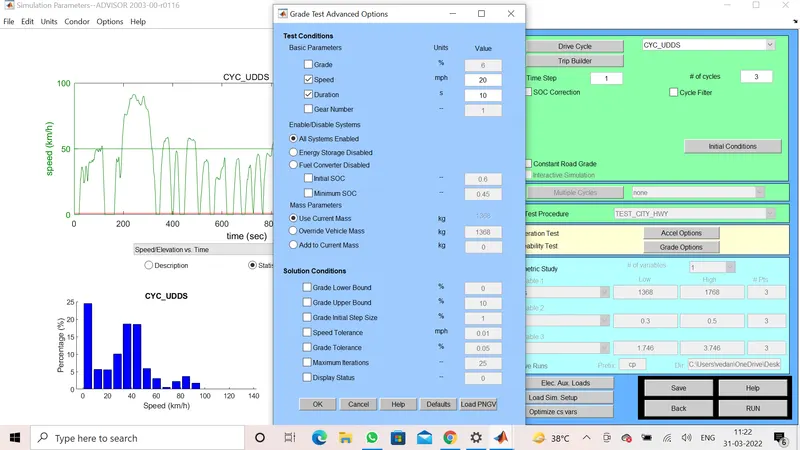
Gradeability = 19.8 %
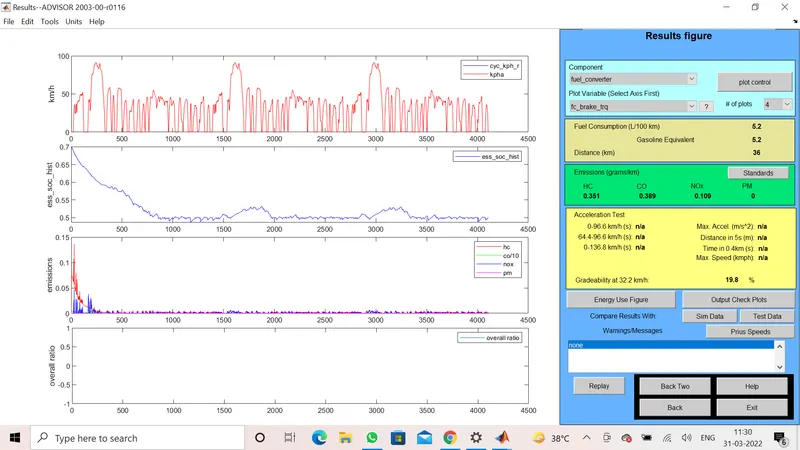
2. For speed = 25 mph or 40.2 kmph
Gradeability = 16.5%
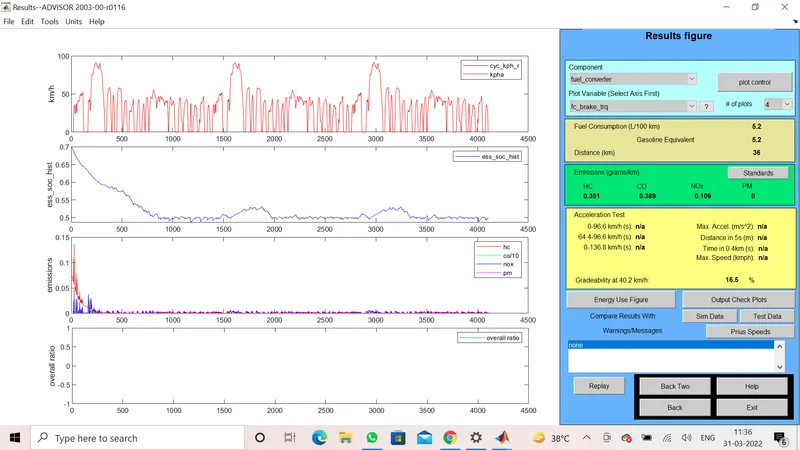
3. sor speed = 30 mph or 48.3 kmph
Gradeability = 14.7%
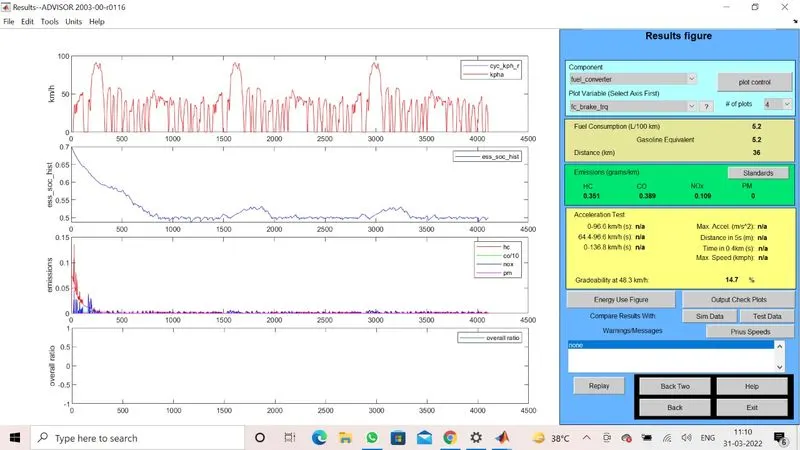
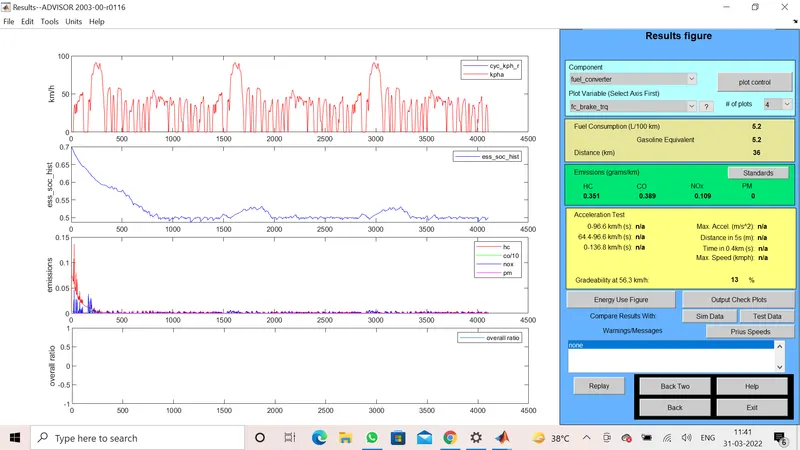
4. For speed = 35 mph or 56.3 km/h
Gradeability = 13%
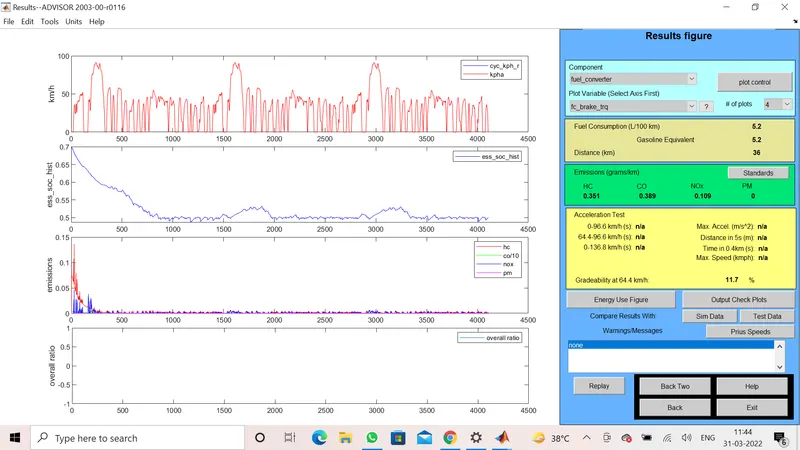
5. For speed=40 mph or 64.4 km/h
Gradeability = 11.7%
6. For speed = 45 mph or 72.4 km/h
Gradeability = 10.7%
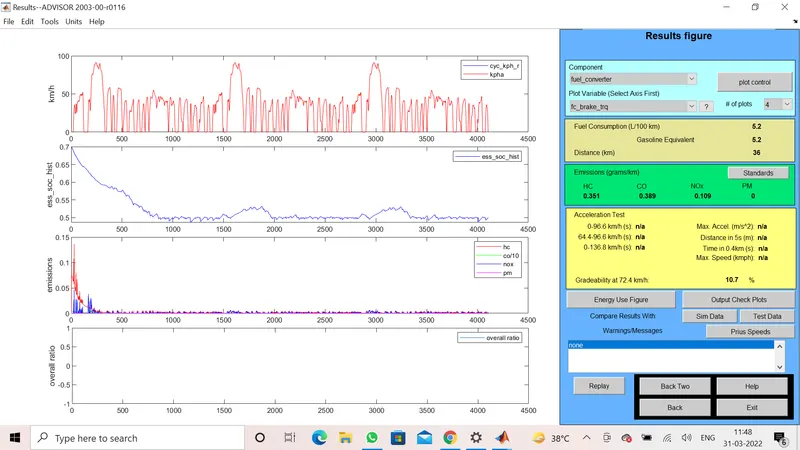
hence we can see that as the speed increases, the gradeability decreases.
conclusion table
| sr. no | speed km/h | Gradeability % |
| 1. | 32.2 |
19.8 |
| 2. | 40.2 | 16.5 |
| 3. | 48.3 | 14.7 |
| 4. | 56.3 | 13 |
| 5. | 64.4 | 11.7 |
| 6. | 72.4 | 10.7 |