Week-4 Challenge WOT Condition Part-2
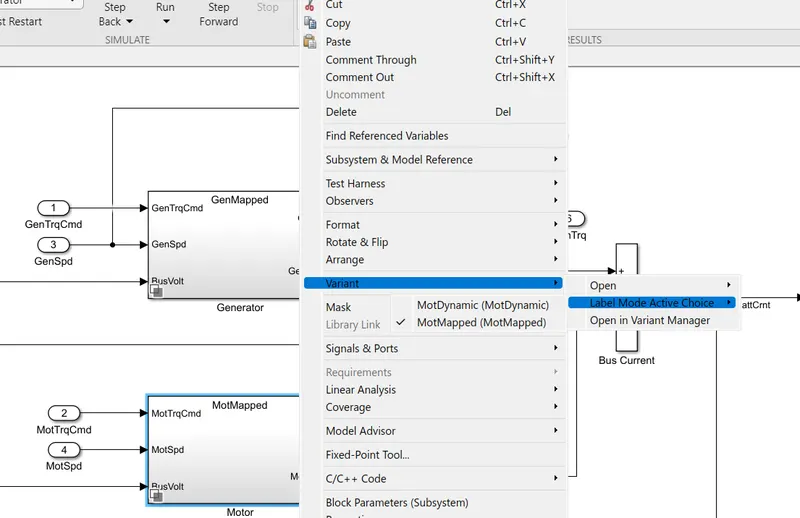
- What is the difference between mapped and dynamic model of engine, motor and generator? How can you change model type?
|
Mapped Model |
Dynamic Model |
|
In mapped model, the parameters are stored as steady state look-up tables. |
In dynamic model, the entire model is separated in to lower-level components called subsystems and the parameters for each subsystem has to be entered by the user. |
|
Look up tables are created based on expert knowledge and experiments which characterize the model performance. This type of model is also called global based model. |
By Combining elements in this way, the model captures dynamic effects. This model is also known as real-time based model as the actual details (for egs: a particular vehicle) are used for simulations. |
|
This model is used for quasi steady-state simulations. |
This model is used to analyse the impact of individual components on the overall performance. |
Changing the model type:
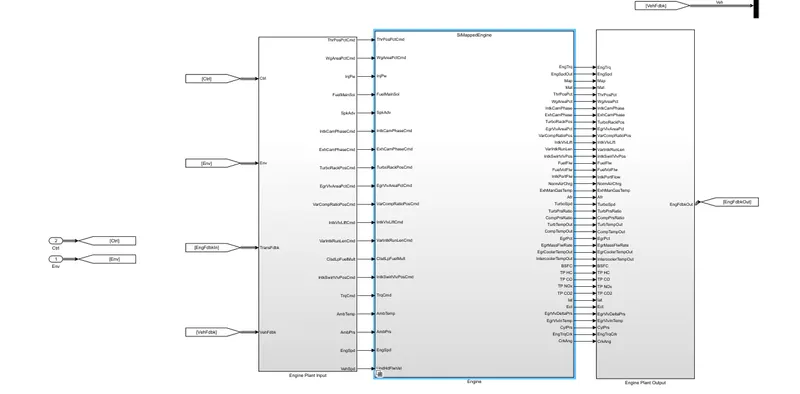
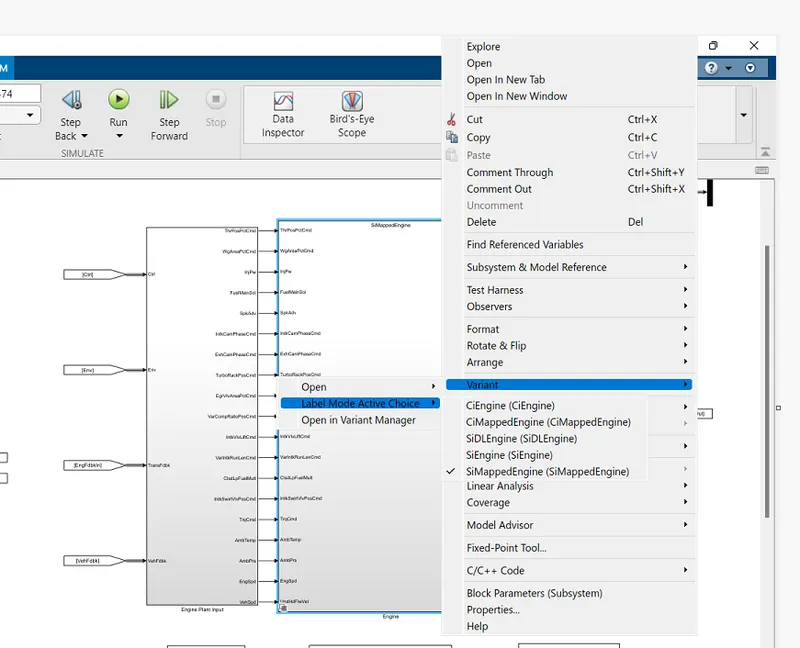
Engine
Select passenger car--> Right Click on subsystem engine --> choose variant --> select label mode active choice --> And select SiEngine(SiEngine)
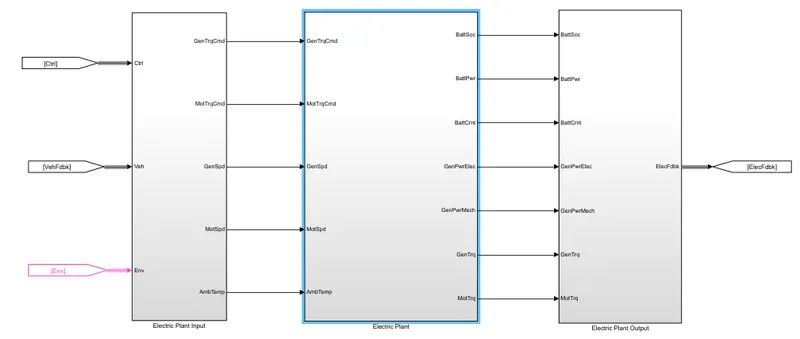
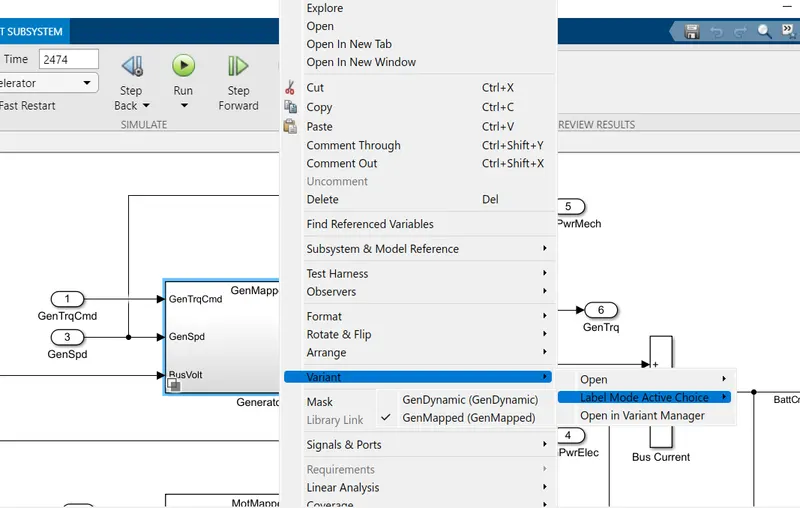
Generator:
Select passenger car--> Click on subsystem Electric Plant --> Right click on GenMapped --> choose variant --> select label mode active choice --> And select GenDynamic (GenDynamic)
Motor:
Select passenger car--> Click on subsystem Electric Plant --> Right click on MotMapped --> choose variant --> select label mode active choice --> And select MotDynamic (MotDynamic)
2. How does the model calculate miles per gallon? Which factors are considered to model fuel flow?
Miles per gallon gasoline equivalent refers to the fuel efficiency of electric vehicles that compares how far a car can go with how much energy is in a gallon of gasoline.
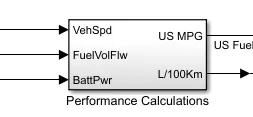
For calculating miles per gallon, the main inputs are:
- vehicle speed
- fuel volume flow
- battery power
Steps:
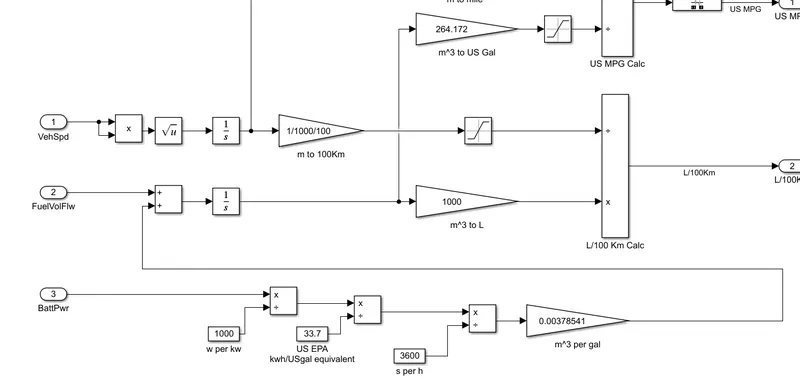
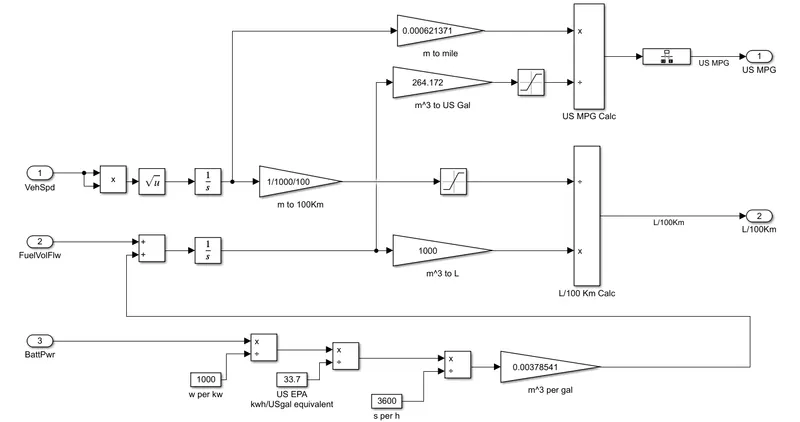
a) convert battery power in watts to m^3 per gal

- convert battery power in watts to kW by dividing it by 1000. Assume time taken as 1 hr.
- Now convert kwh to kwh/USgal by dividing kwh by 33.7 (1 gallon = 33.7 kwh).
- Divide kwh/USgal by 3600 (1 hour = 3600 seconds) and multiply it by 0.00378541 to convert it in to m^3 per gal ( 1 US gallon = 0.00378541 m^3).
b) Since we have considered a hybrid electric vehicle, we have to add battery power with fuel volume flow and integrate it
so that we get the resultant in m^3.
- Multiply the resultant in m^3 with 264.172 to convert m^3 to US gallons.
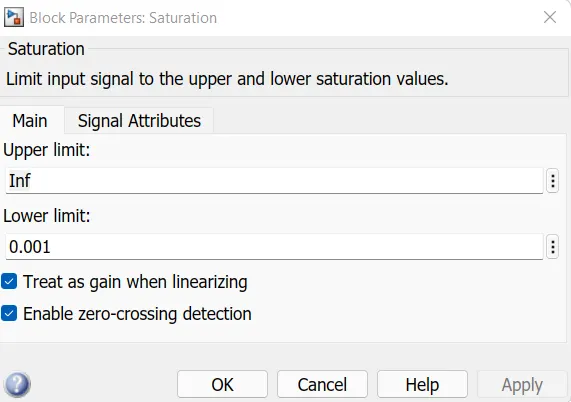
- Saturation block is used to limit input signal between upper and lower saturation values.
c) Vehicle speed is squared to avoid negative values (during deceleration) and its square root is taken so that we will be having a positive value for velocity ---> Velocity is integrated to get the distance in metres --->The distance in metres is converted to miles by multiplying it by 0.000621371(1 metre = 0.000621371 miles).
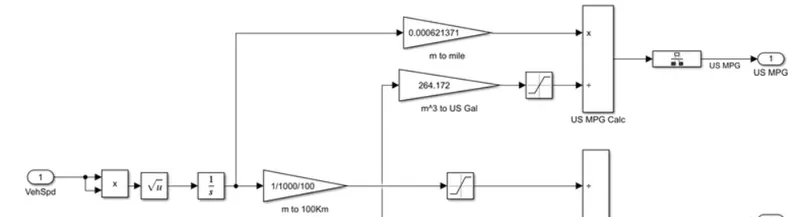
d) Divide the distance in miles by calculated US gallons ---> we get US miles per gallon
3. Run the HEV ReferenceApplication with WOT drive cycle. Change the grade and wind velocity in the environment block. Comment on the results.
First simulate the HEV with WOT drive cycle with 0 grade and 0 wind velocity.
The nominal reference speed is chosen as 50 miles per hour, time to start decceleration is chosen as 60 secs and the WOT simulation time is chosen as 100 secs.
The results of simulation are as shown below:
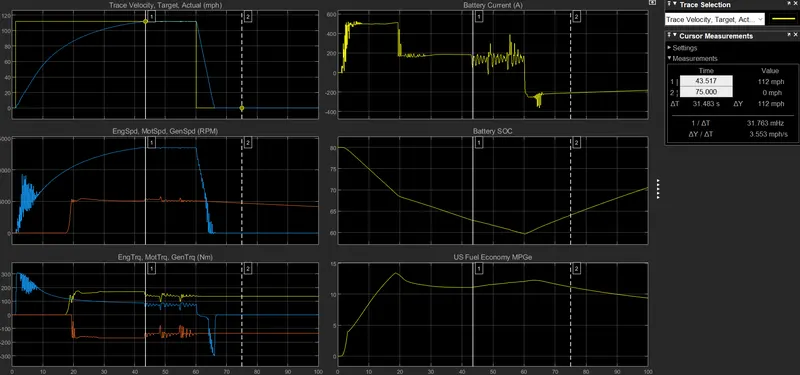
The vehicle has reached the maximum speed of 112 mph in 43.517 secs.
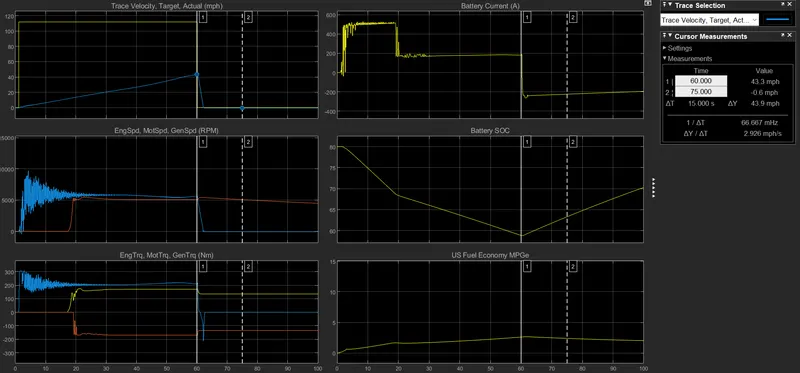
Now simulate the HEV with WOT drive cycle with grade of 15 degree and wind velocity of 7.5 m/s.
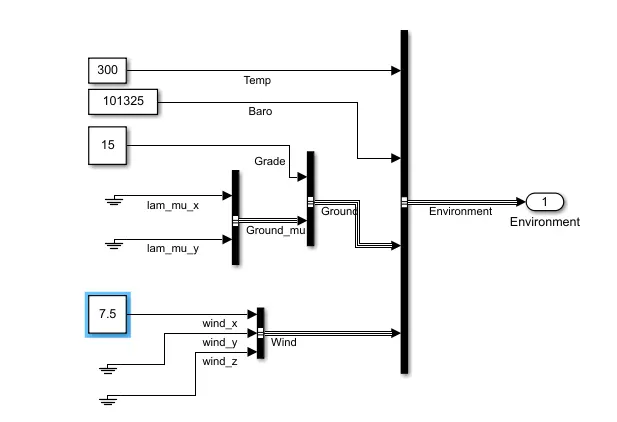
The nominal reference speed is chosen as 50 miles per hour, time to start decceleration is chosen as 60 secs and the WOT simulation time is chosen as 100 secs (same as in the previous case).
The results of simulation are as shown below:
From the above plots it is observed that:
- The vehicle has reached the reduced maximum speed of 43.3 mph in 60 secs. (maximum speed is reduced)
- As grade and wind velocity increases, the hill climbing force and aerodynamic drag force increases correspondingly.
- So total tractive force increases and the engine and motor has to provide more torque to meet the increased tractive force which is very evident from the plots.
- As the vehicle has to overcome the hill climbing force and aerodynamic drag force, the US Fuel Economy has decreased gradually.
4. Keeping all other parameters same, compare the simulated results of hybrid and pure electric powertrains.
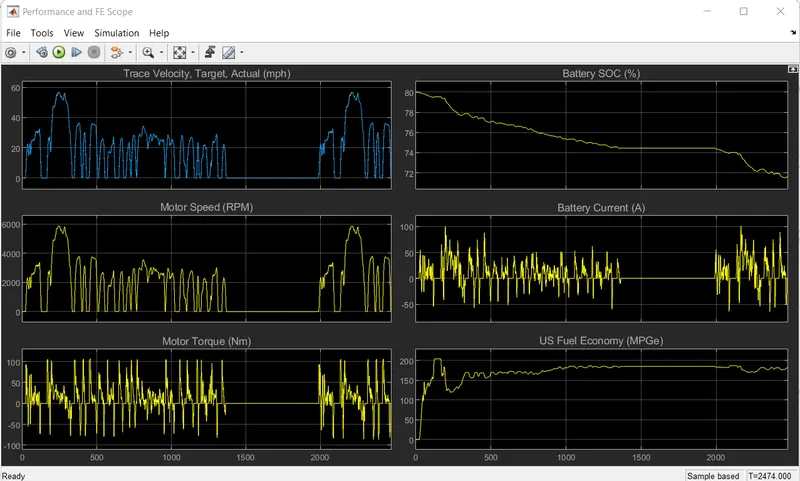
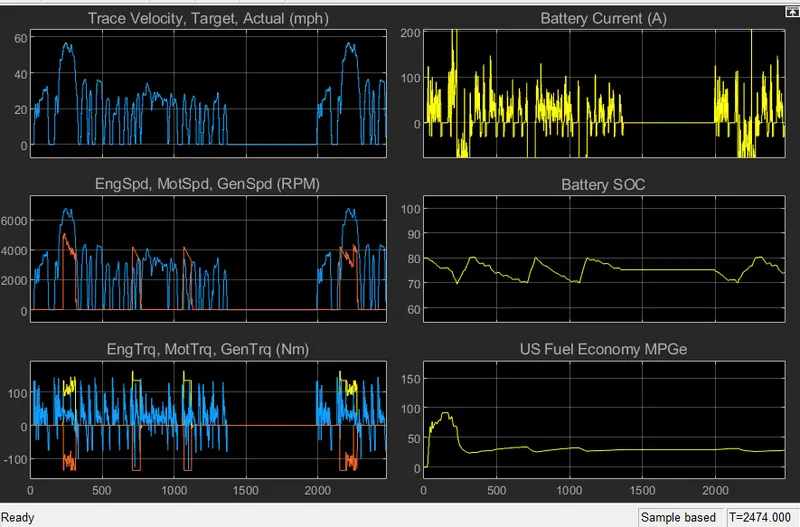
Keeping all the parameters same, hybrid and pure electric power trains are simulated with drive cycle FTP75 for 2474 seconds.
The simulated results are as below:
EV
HEV
From the simulated results, we can come to following conclusions:
- Comparing the battery SOC %, it can be observed that in pure EV battery SOC % decreases continuosly. If the model is simulated with the same drive cycle for more time, there will be a time when the battery charge is depleted. Then the EV has to be plugged in to recharge the battery.
- In HEV, it can be observed that battery SOC % is controlled like thermostat mode (or ON/OFF mode). i.e.,
The battery SOC (peaking power source SOC) has an upper limit and a lower limit. When the battery SOC reaches the upper limit, the vehicle runs with battery power and it continues to run with the battery power till SOC % reaches a lower threshold value. Once it reaches the lower threshold, the vehicle runs with engine power and the battery is recharged. When the SOC of battery again reaches the upper threshold the engine turns off and the vehicle is operated on battery again. This cycle goes on.
- It is very evident that the US fuel economy of pure EV is higher than HEV because of less consumption of fuel in case of EV.