Week-3 Challenge: ADVISOR Tool
1. For EV_defaults_in file, if cargo mass is 500 kg with all other default conditions, can the vehicle travel for 45 km with FTP drive cycle? Conclude your observations.
- Type advisor on command window.
- Set the unit system to metric system.
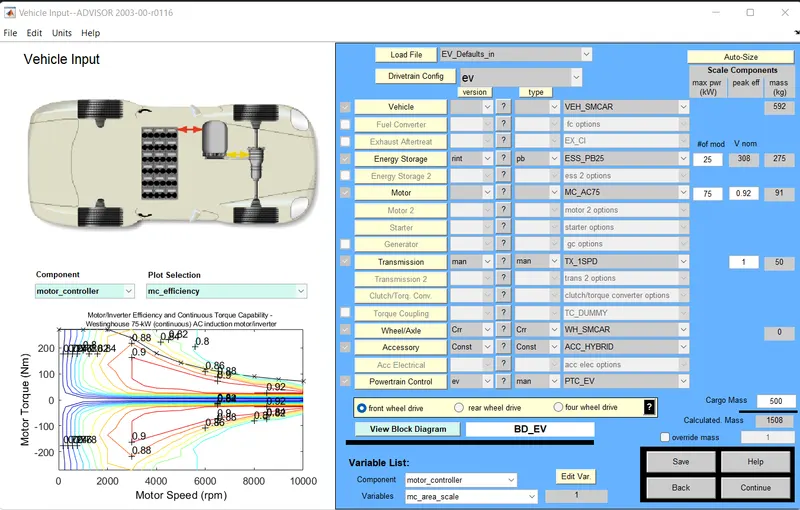
- Load file EV_defaults_in file.
- Change the cargo mass to 500 kg.
- Click on continue.
- Now choose the drive cycle to FTP drive cycle.
- Run the model.
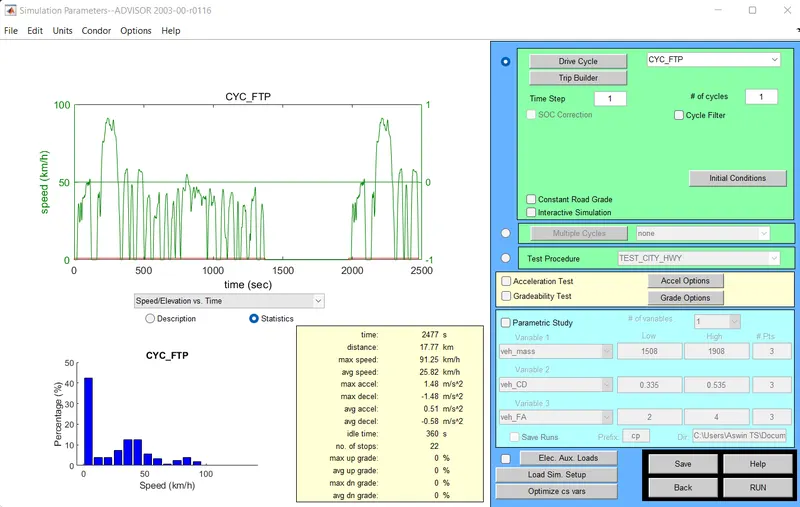
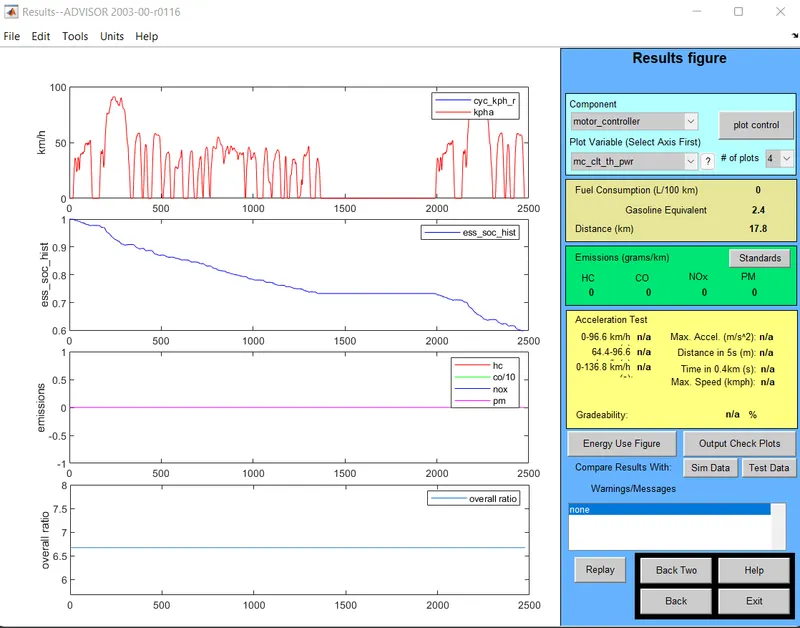
- When we run the model with no of cycles = 1, the distance covered = 17.8km.
- We have to check whether the vehicle can travel 45km. Now run the model with no of cycles = 2.
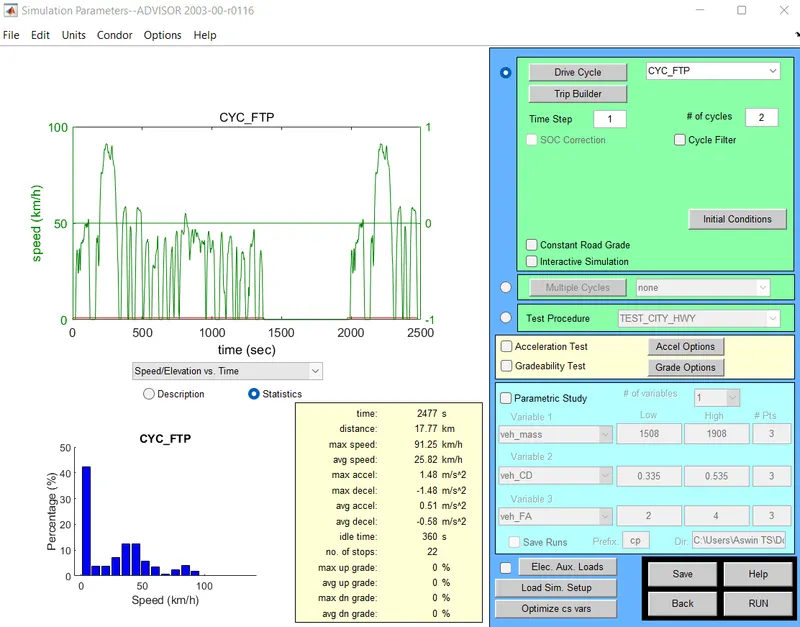
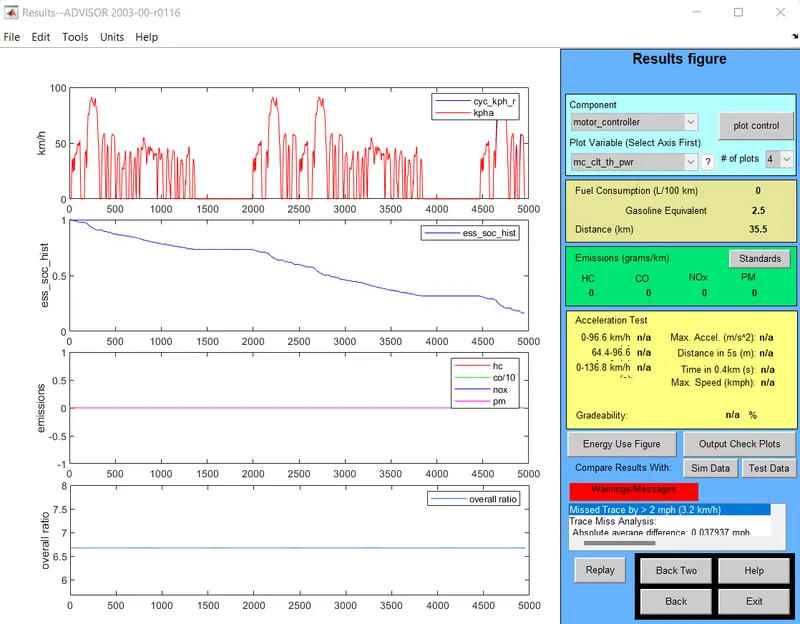
- When we run the model with no of cycles = 2, the distance covered = 35.5km.
- We have to check whether the vehicle can travel 45km. Now run the model with no of cycles = 3.
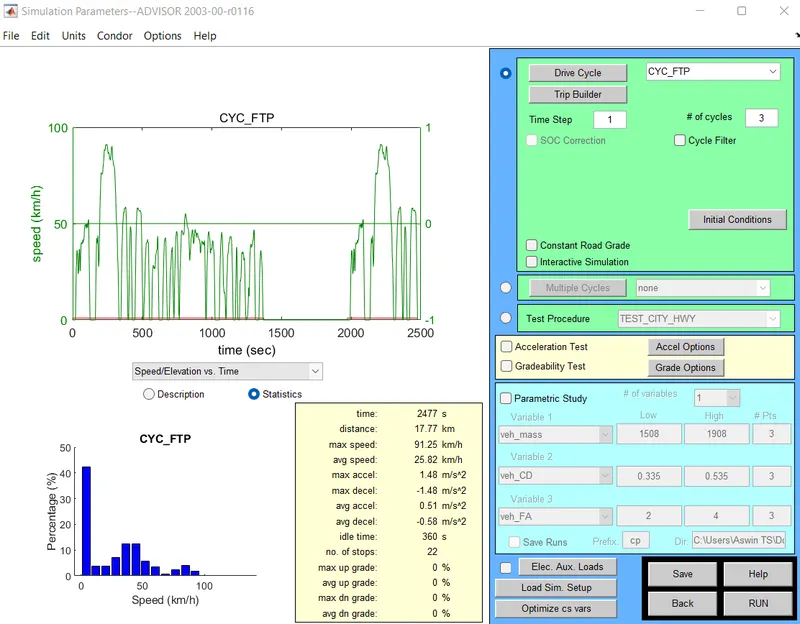
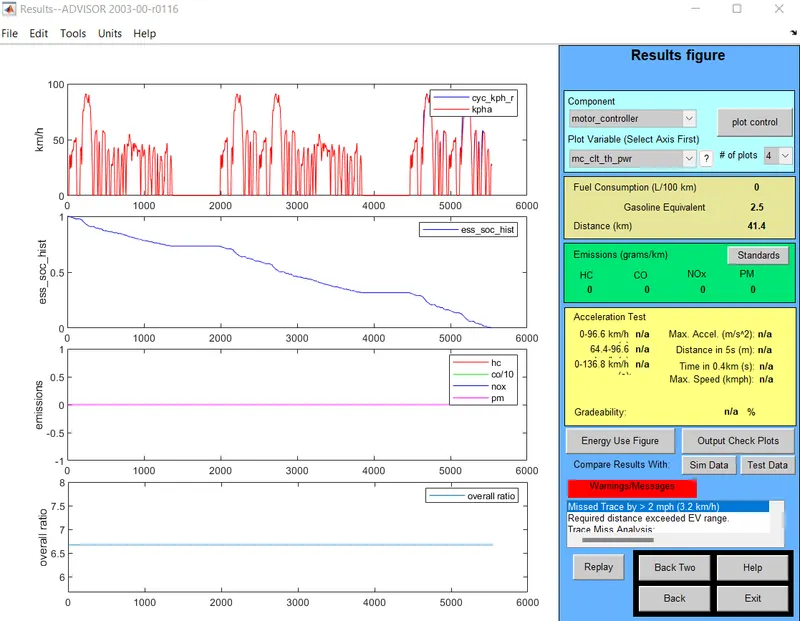
- When we run the model with no of cycles = 3, the distance covered = 41.4km.
- We have to check whether the vehicle can travel 45km. Now run the model with no of cycles = 4.
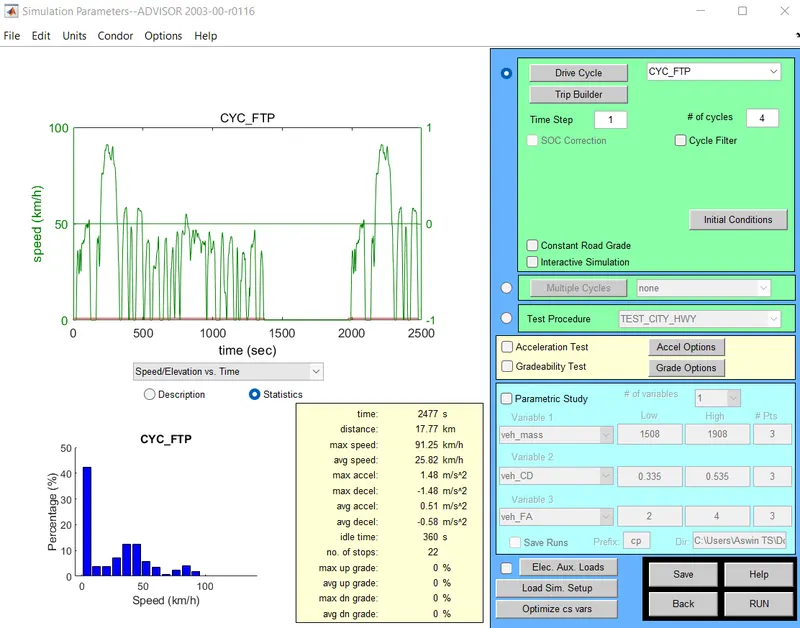
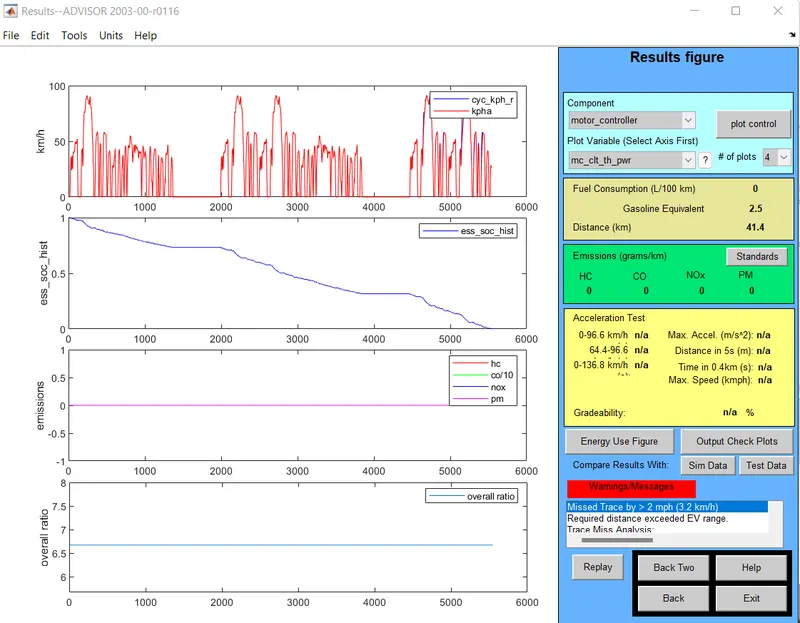
- When we run the model with no of cycles = 4, the distance covered is not increasing beyond 41.4km.
- The distance covered is not increasing beyond 41.4 km eventhough we increase the no of cycles.
- Hence we can conclude that with the present specification and cargo mass of 500 kg, the vehicle cannot cover a distance of 45 km with FTP drive cycle.
2. In the above case, try changing the battery capacity and repeat the simulation.
- Change the no of battery modules from 25 to 30.
- Run the model with no of cycles = 3.
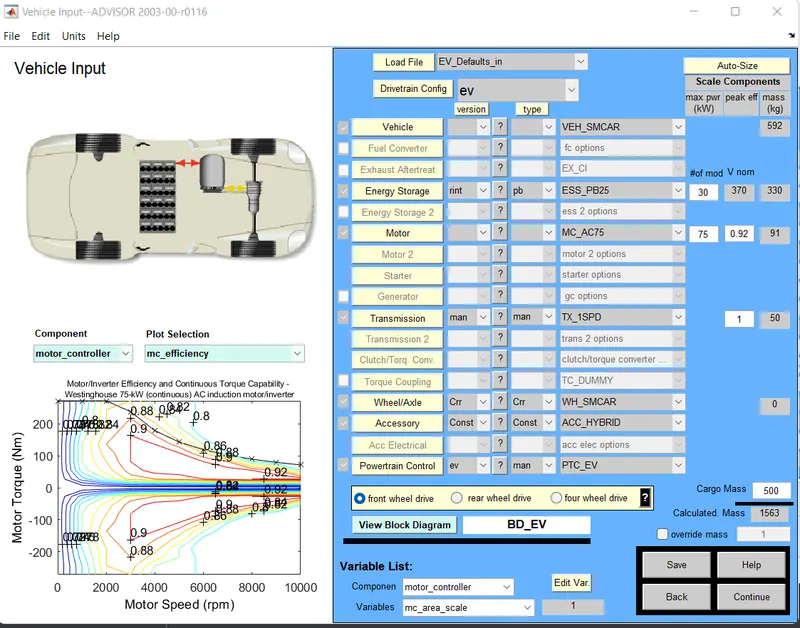
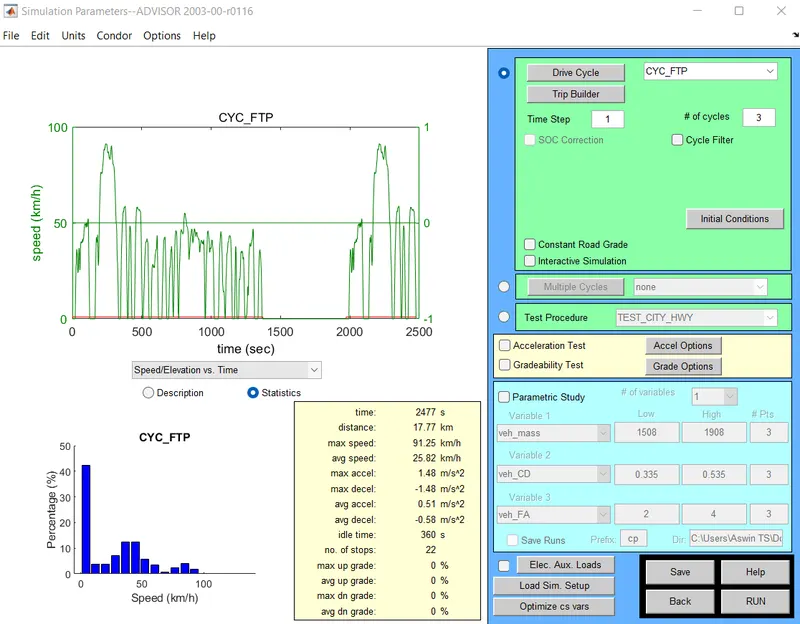
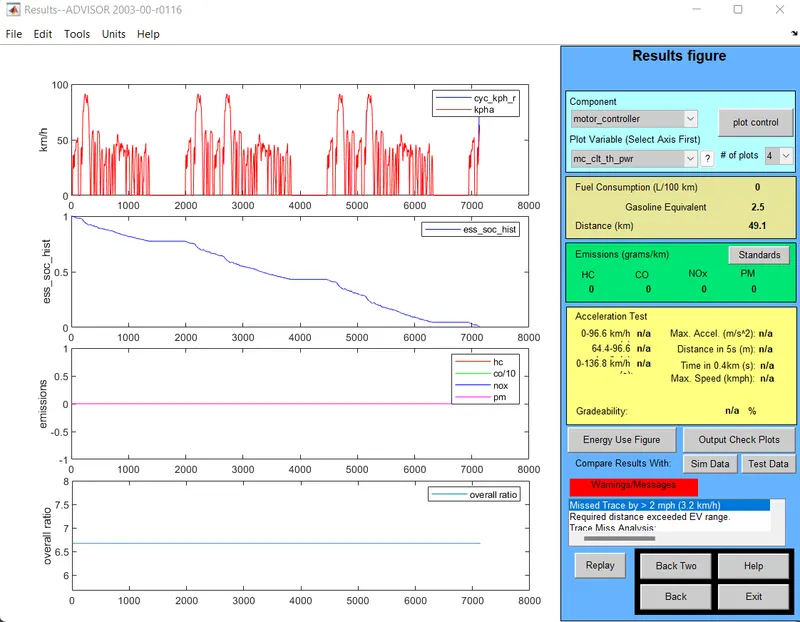
Thus by increasing the battery capacity (by increasing the no of modules from 25 to 30), the vehicle is able to travel a distance of 49.1 km. Tradeoff between battery capacity, no of driving cycles and SOC can be made.
3. Perform gradeability test with PRIUS_Jpn_defaults_in file
Compare your results in table and conclude.
- Choose the file PRIUS_JPN_defaults_in
- Click on continue
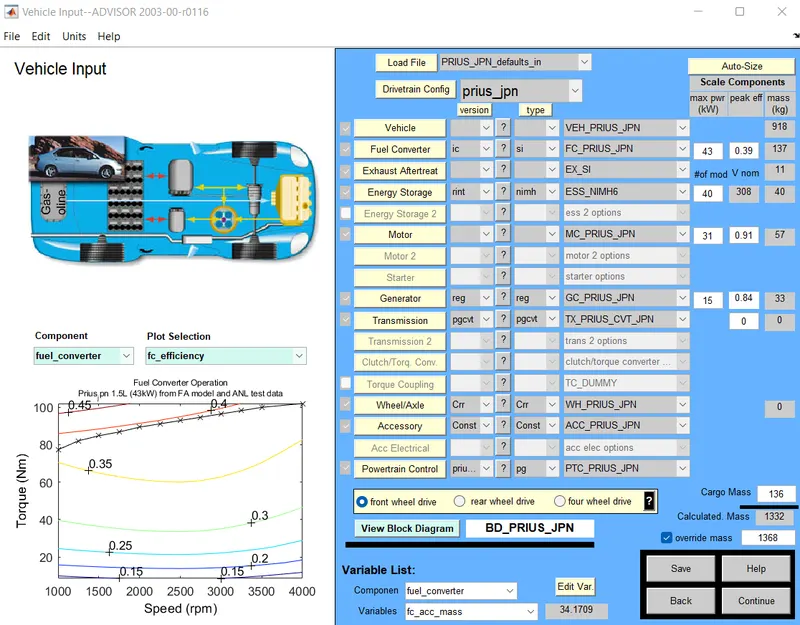
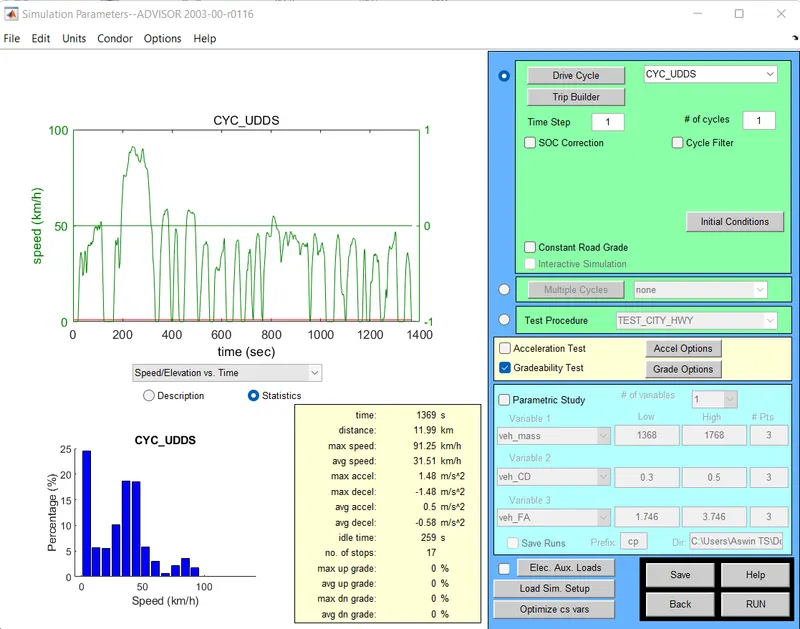
- Choose the default drive cycle and no of cycles (i.e., 1)
- Choose grade options.
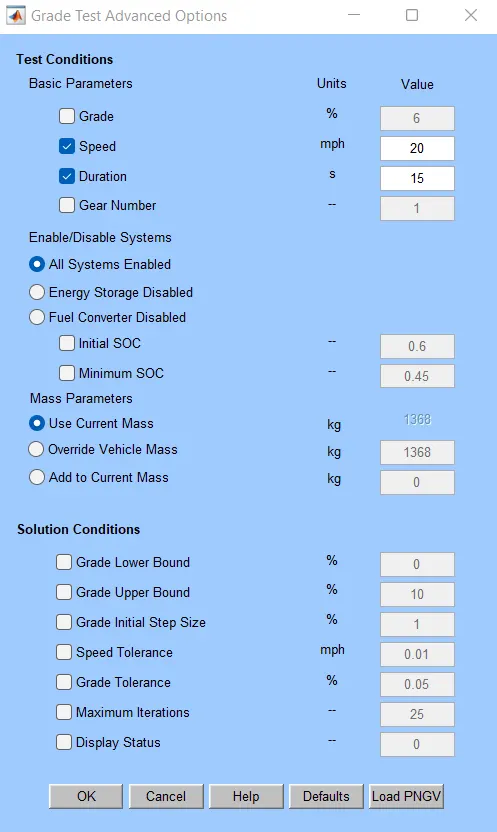
- Choose the required speed and also choose All systems enabled
- Run the model and observe the gradeability.
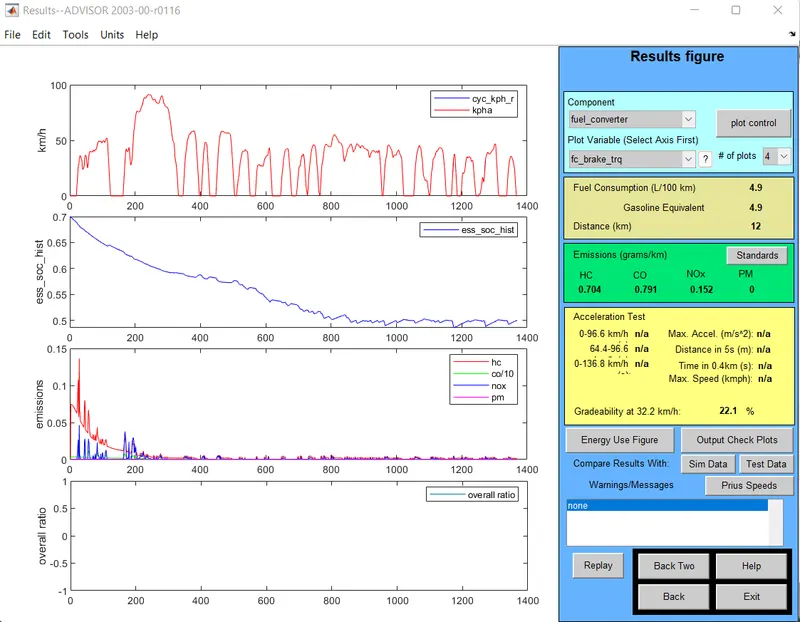
For different values of speed, run the model and note the gradeability. It is tabulated as below.
| Speed (in mph) | Duration (in secs) | Gradeability (in %) |
| 50 | 15 | 11.6 |
| 45 | 15 | 12.6 |
| 40 | 15 | 13.8 |
| 35 | 15 | 15.1 |
| 30 | 15 | 16.9 |
| 25 | 15 | 18.8 |
| 20 | 15 | 22.1 |
| 15 | 15 | 27 |
From the above, it can be concluded that as gradeability increases the speed decreases.