Week-4 Challenge WOT Condition Part-2
- What is the difference between mapped and dynamic model of engine, motor and generator? How can you change model type?
Answer:-
Powertrain Blockset provides two types of combustion engine models:-
- Mapped
- Dynamic
- Mapped Model:-
- In the mapped moels the data is taken from a lookup table characterises the Engine/Motor/Generator performance under certain parameters.
- Mapped engines represent macro engine behavior as a set of lookup tables(Brake torque,fuel flow,air mass flow,exhaust tempereature,efficiency,and emissions) as functions of commanded load and measured engine speed.
- Mapped engine models are suitable for analysis and design activities that do not require engine subsystem dynamic characterstices.
- For example In engine and transmission powertrain matching analysis for fuel economy,emissions,and performance tradeoffs.
- This model leads to faster solving times.
2. Dynamic Model:-
- It combines the results of different compenents to get the dynamic effect.
- Dynamic models are used to if you need a more detailed and component level data and to analyse the impact of individual engine/Motor/Generator components on the overall performances.
- Dynamic engine models are suitable for designing control,estimator,and diagnostic alogorthims that depend on dynamic subsystem states.
- For example In closed-loop AFR control algorithm development.
- Dynamic engines decompose engine behavior into individual component models that account for engine dynamics,most notably intake airflow and turbocharger dynamics.
- Both the SI and CI engine models run in real time for harware in the loop (HIL) testing.
- You can switch between engine model types based on your application.
To Change Model Type:-
- Open the EVreferance application from the passenger car block.
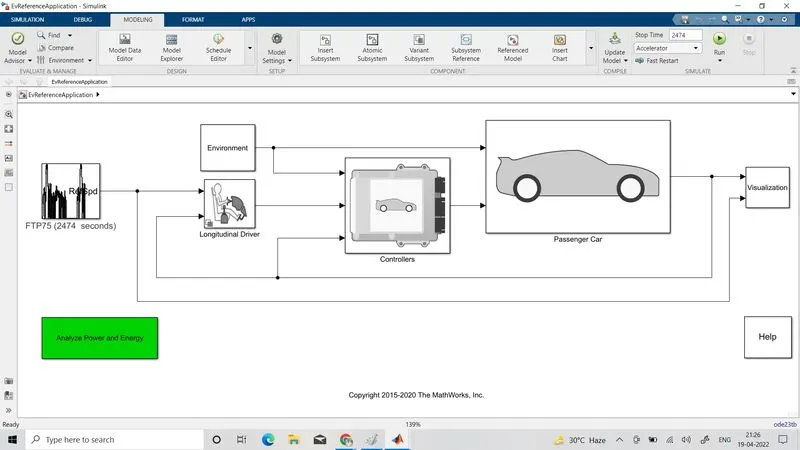
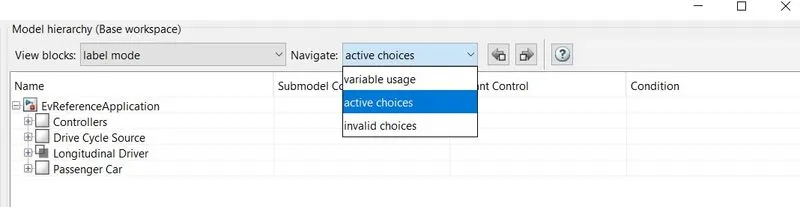
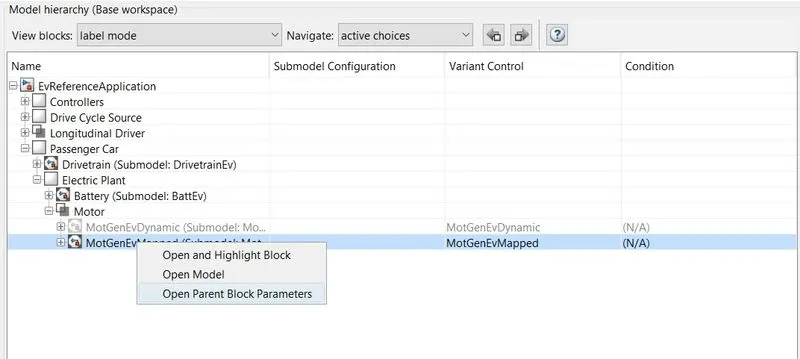
- And right click on MotGenEv click on open block paremeters.
- Here we can change Mapped or Dynamic,We Switch from mapped to dynamic model.
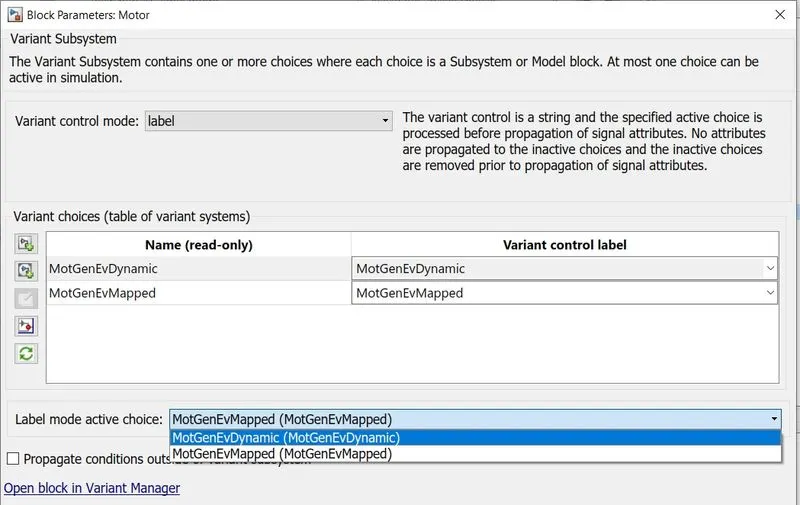
- Similary using the same method we can change from Dynamic to Mapped or vice cersa from Generator,Motor and Engine model.
2)How does the model calculate miles per gallon? Which factors are considered to model fuel flow?
Answer:-
We use the example used in the previous situation as the EVReference Application.
Then click on the EVReference Applications>Visualization>Performance Calculations
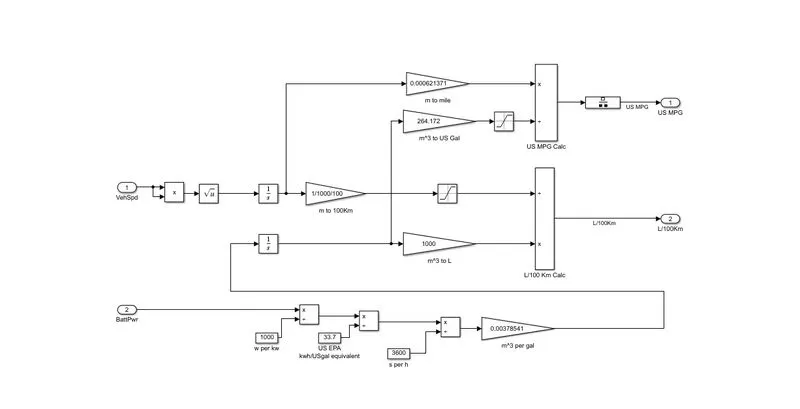
The inputs which can be used as fuels are electricity from the battery and also the normal fuel. (1kwh or 1 unit)battery can run the vehicle for 3.125 miles,then 1 gallon of fuel can be assumed as 33.7kwh of electricity which leads to 105 miles.
On opening the performance calculator block we get:
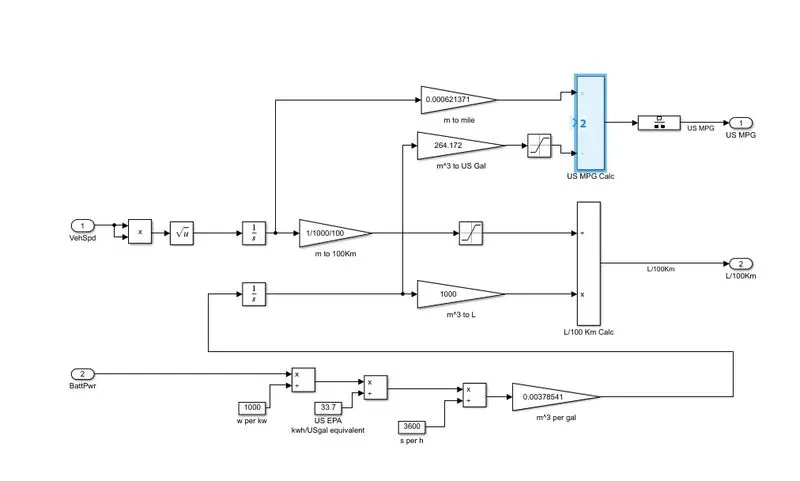
Using the fallowing calculate we can calculate the miles per gallon:
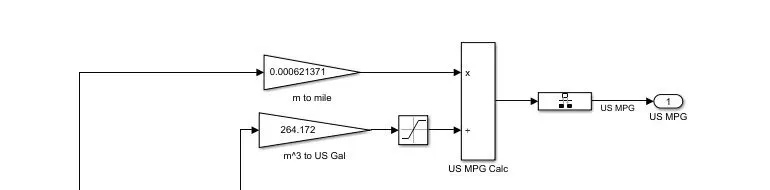
Fig-1

Fig-2
In calculating the fuel flow for the model,the inputs used are vehicle input,Battery power,and also fuel volume flow.
Since 1 gallon is equivalent to 33.7kwh or units.So the batter power capacity is divided by this constant 33.7 and then after getting converted into the gallon equivalent,This battery equivalent gallons is added to the normal fuel flow.
Total distance can be calculated with the speed and time.The distance will be then converted into miles.So using all these above data the fuel efficiency can be easily calculated.
3)Run the HEV ReferenceApplication with WOT drive cycle. Change the grade and wind velocity in the environment block. Comment on the results.
Answer:-
In the command window on typing "autoblkHevStart" We get the required HEV model
We are running this WOT driving cycle,So from the Drive cycle block we change the driving cycle to Wide Open Throttle(WOT).
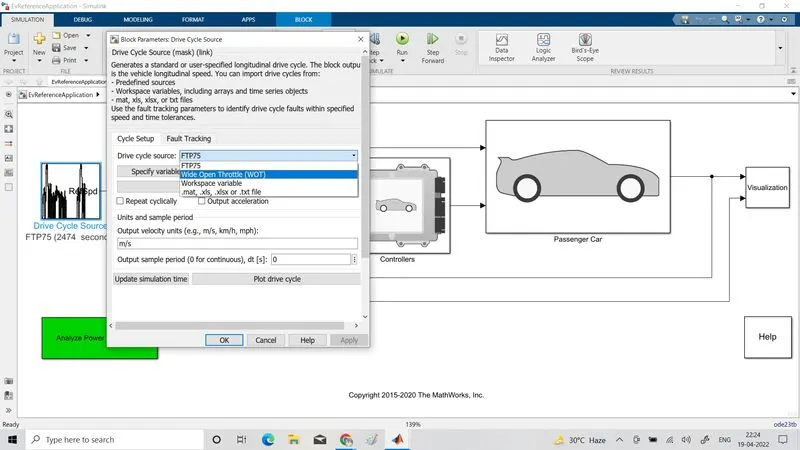
On running the simulation with the defualt parameters,We get the fallowing result as the output.
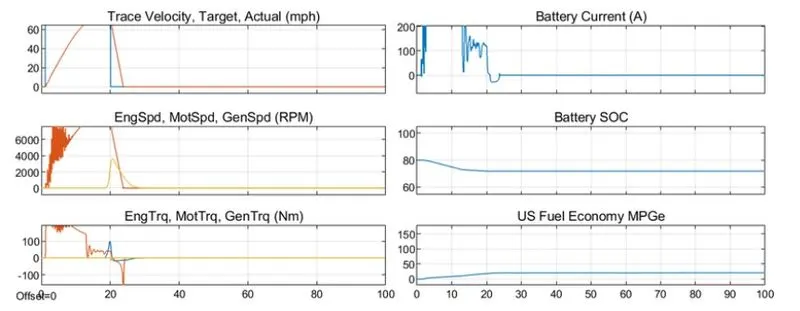
In the first graph trace velocity we compare trace velocity of the idel WOT Cycle to the actual WOT Cycle for the given parameters.
The second graph shows the speed of the motor and generator.We can see a rapid increses in the motor speed after a constant run.Finally it decelerates and becomes zero.
The third graph compares the torque of the motor and generator.Initially motor torque is very high(full throttle)for few seconds and gradually it reduces and both the machines have the same torque.
In the fourth graph we can see battery current,Initially there is a heavy usage of the battery until the engine is ON and the vehicle runs completly on the suppoert of battery.Once the engie is ON,then it is seen that the battery current is redused gradually due to shared usage of fuel.
In the fifth graph SOC is shown,Which gradually decreases with the running of the vehicle.
Now we vhange the parameters like grade and wind velocity:
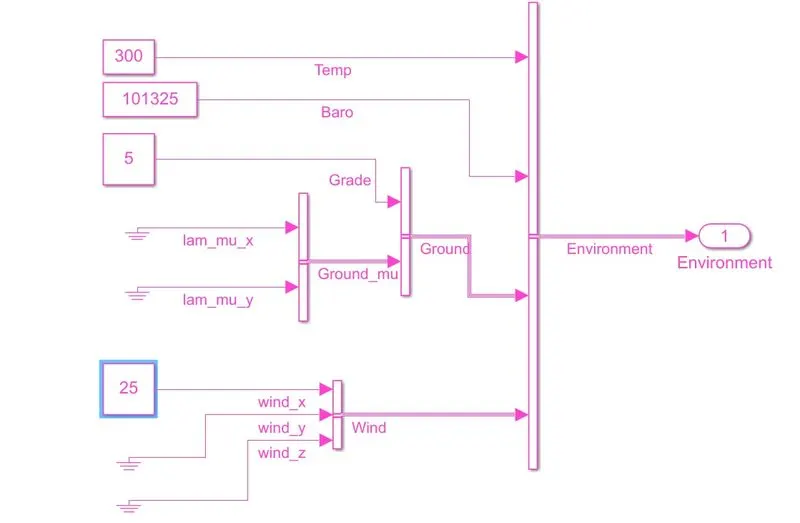
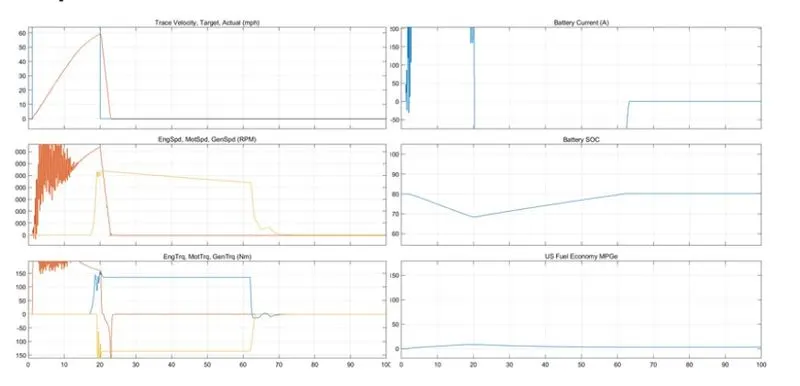
Output of the Simulation:
Grade is changed to 5 degrees and the wind velocity is now 25 m/s.
In the first graph Trace velocity we compare trace velocity of the ideal WOT Cycle to the actual WOT Cycle for the new changed parameters.
The second graph shows the speeds of the motor and generator,We can see a rapid increses in the motor speed after a constant run.Finally it decelerations and becomes zero.It is also that in the fourth graph battery current increases when there is increses in the speed.
Now there as a change in SOC,From theearlier simulation.Here we can see that intially SOC decreeases,But then it gradually increases with the time.This is beacause of the regeneratative braking.
Torque characterstics also show that generator has a negative slope garaph.But motor initially has a very high torque and then gradually decreases.
There is no much improvement in the efficiency of the engine though.
4)Keeping all other parameters same, compare the simulated results of hybrid and pure electric powertrains.
Answer:-
Run HEV Model by typing autoblkHevStart in the command window:
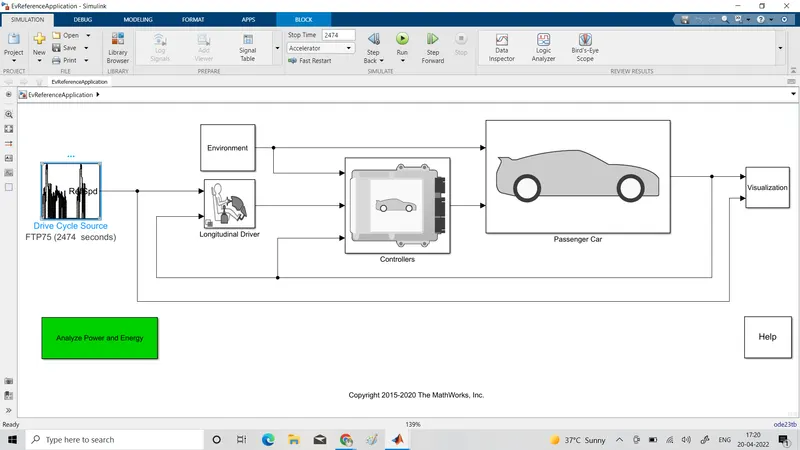
Drive cycle used here is WOT.
OUTPUT SIMULATION:
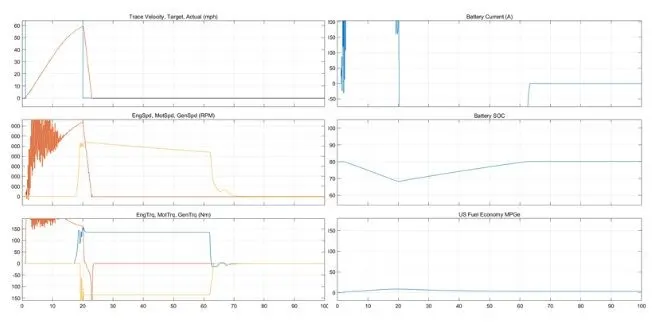
Now we run the EV reference Application by typing autoblkEvStart in the command window:
We run this model also in the same WOT Drive Cycle:
OUTPUT SIMULATION:
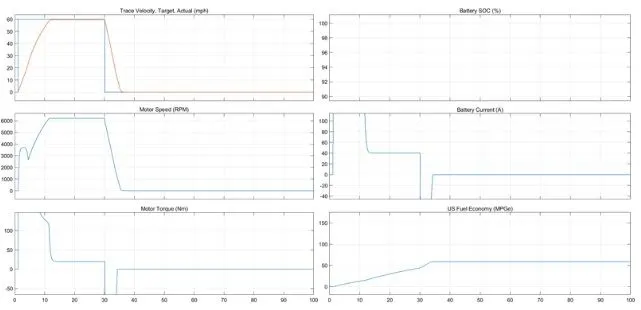
So we have obtained the output of both the EV and HEV reference applications.
On comparing the result and analysing we can see that all the graphs of EV Reference application are very much stable while comparing to the HEV model.
- In the first graph we see the trace velocity,Which are similar in both the systems.
- In the second graph we can see the speed.Speed in EV is onl the motor speed which is veryneat and stable with less distortions,While in the HEV model there is a generator speed also which is very much distorted.
- The third graph shows the torque,Which is also similar to the speed.HEV model has so many distortions but the EV model gives a stable result.It is evident that the peak RPM in HEV model is high compared to the EV model.
- Battery current in HEV is very high initially and then slowly it decreases.This happens because initially the vehicle runs only on the battery and only after the engine starts it helps the motor to run and thus battery current decreases.
- Efficiency of the HEV is less compared to the EV beacause the engine is always less efficient beacause of the heat losses.
- SOC of the EV model is improved by a value of 2% during deceleration, but HEV has something like 15% because of regenerative braking during deceleration.So HEV has a better SOC then EV.