Week-4 Challenge WOT Condition Part-2
PART1: Difference between mapped and dynamic model of engine,motor and generator
Mapped model:
1.The simulation of power train block set model consists of perbuilt data present in lookup table and it dealing with mapped data or mapped model.
2.Mapped model calculation is very fast and simulates the model very fast but it is not accurate
3.Steady state models are examples of mapped models
Dynamic model:
1.The simulation of power train blockset model does not consists of prebuilt data but it takes real time data by calculating the every small individuals like the movement of vehiclwe,drag,speed velocity,wheel braking,etc, which is dynamic data or dynamic model for engine system or motor system or generator system.
2.The dynamic model takes more time for calculates the data but it is very accurate.
- Changing the mapped model to dynamic model or vice versa:
1.Open the power train blockset for the required vehicle
2.Click on passenger car/vehicle block and select electric plant or engine
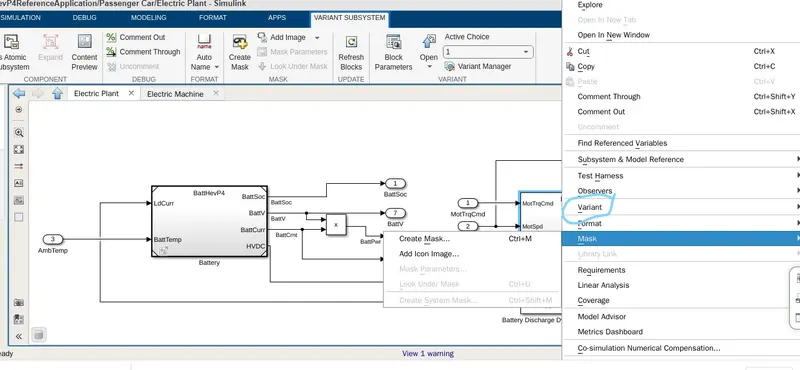
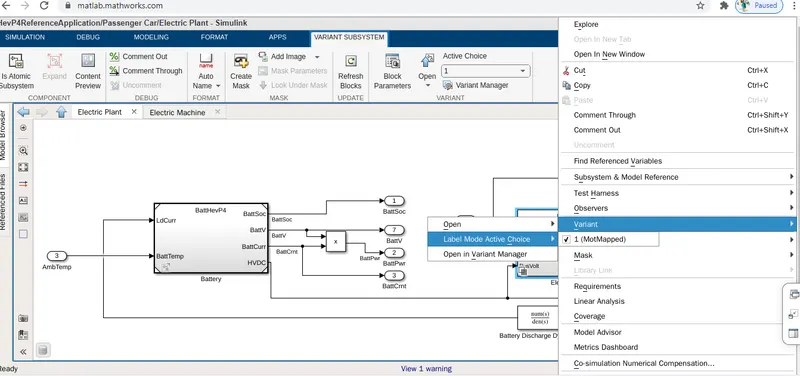
3.Right click on engine or EV motor/generator based on vehicle model and select variant
4.Under variant scroll to label model active choice and choose mapped or dynamic model for the required calculatoiom
5. This is a shortcut method and we cab do the same by using Variant manager
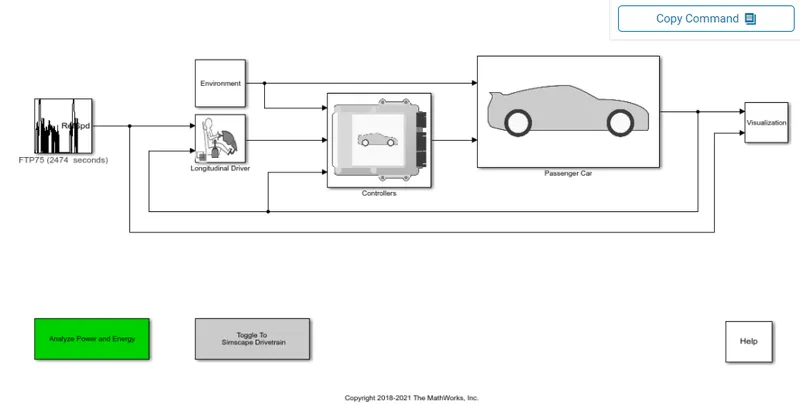
- Open the power train blockset model and it look likes in the above very first image and then click on passenger car, inside it a electric plant present.
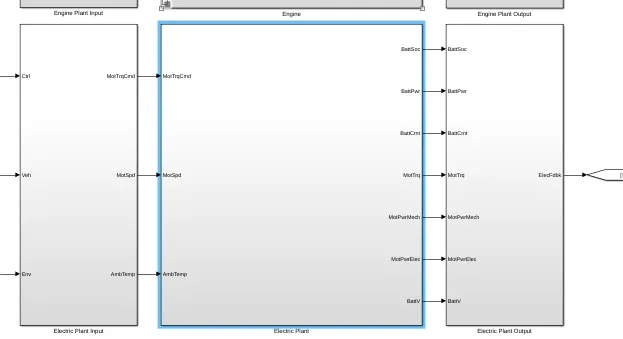
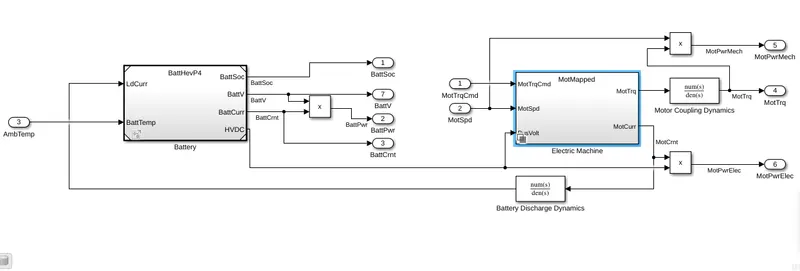
- Click on the electric plant, we can see electric machine and battery inside it.
- Now right click on the electric machine anywhere on it, here we can see some options now select variant and then scroll to label model active choice and change to mapped or dynamic model
PART2: How does a model calculates miles per gallon?
Miles per gallon(MPGe) is a fuel economy unit which determines how far a vehicle can travel for a volume of one gallon of gas or diesel for a conventional IC engine.In the case of an electric vehicle, this can be measured as how much energy consumed by the battery pack for a unit distance.
Power train blockset is an inbuilt model and this below block can be found in the visualisation block which shows the performance calculations for the fuel economy.
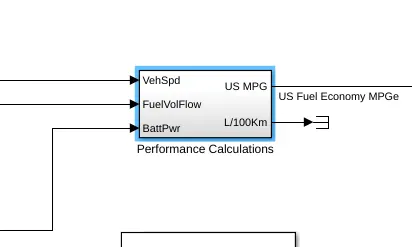
Get into the above block we can find the actual MPGe calculations.
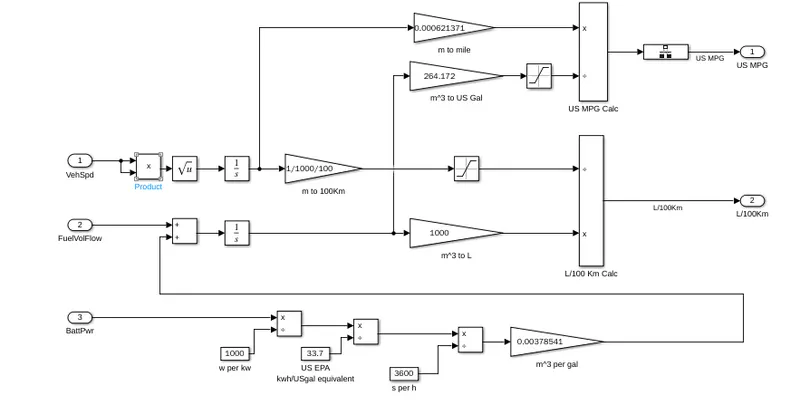
Here three inputs are taken into consideration for fuel flow
1.Vehicle speed
2.Battery power
3.Fuel voulme flow
vehicle speed is in mps which is converted into mph by multiplying with 0.000621. By using vehicle speed and time we can caluculate distance in miles.
Similary kilogram of fuel is converted into cubic meters by multiplying with 1/(1000*0.739).
Then cubilc metres is converted into the gallons by multiplying with 264.172.The mile value and the gallon value is used to find MPGe ofthe vehicle.
one gallon of gas is equal to 33.7kwh energy consumed by a battery so convert the battery power to kw by multipying with 1000 and divided it with 33.7 then we can get battrey power in gallons(33.7kwh=1gallon).Here the fuel equivalent of energy is added to the fuel flow.
From the above diagram which is hybrid electric model visualisation is explored, vehicle speed,battery power and fuel volume flow are the major factors of fuel flow.
PART3: Run the HEV reference application with WOT drive cycle.Change the grade and wind velocity in the environment block and comment on the reesults.
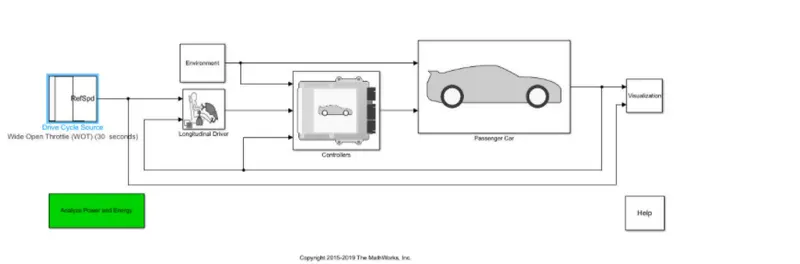
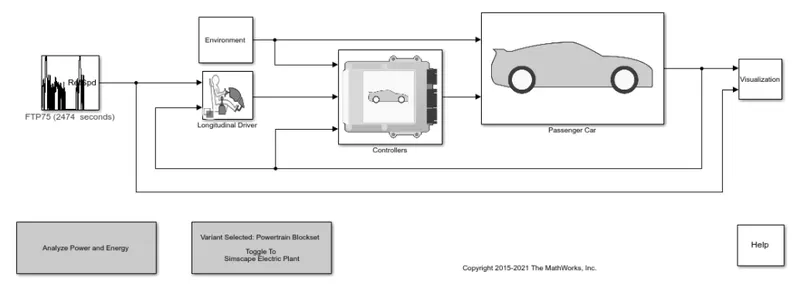
Open the HEV reference model by typing the name HEV reference application in the Help box and then press enter, a window will open which shows different HEV reference applications and open any one of the application.After the opening of reference application, at right side corner a copy command will appear and copy that command and paste that command in the matlab cooment box and press enter.Now the model will open in the simulink.The below image shows the model image of HEV reference application.
WOT without change in grade and wind velocity in the model:
The below model image has FTP75 drive cycle.Change the current drive cycle to WOT drive cycle without changing the grade and wind velocity
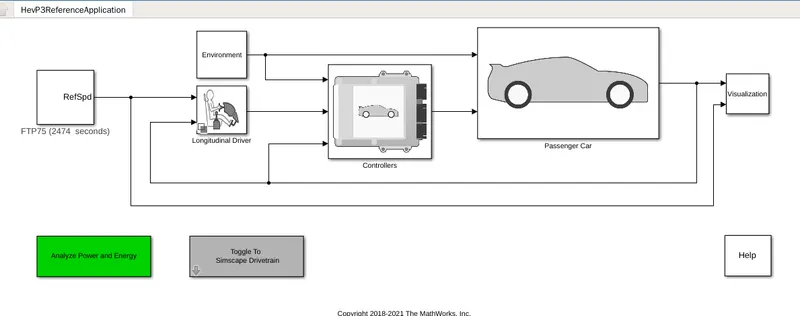
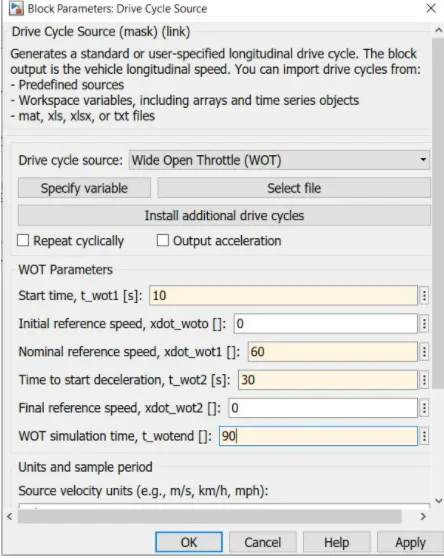
Provide some inputs to the WOT drive cycle like start time, initial reference speed, nominal reference speed etc...
The below plot shows the ouput of the model which has run with its default grade and wind velocity values
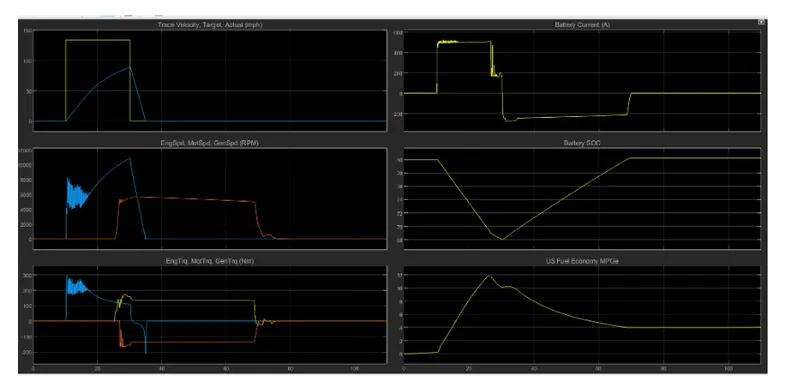
- It has total 6 plots and 1st plot shows the relation of velocity of vehicle with respect to time and velocity is raised when the wot drive cycle has in its peak value.
- The 2nd plot shows the relation among engine speed, motor speed and generator speed with respect to time.All these three worked according to the condition of the vehicle.If the charge drops down to certain predescribed point then starts and run the motor and viceversa.
- The 3rd plot shows the relation of torue among motor, generator and engine with respect to time.
- The 4th plot shows the battery current.Here we fave the full throttle means maximum throttle applied so that currennt here also reaches to its peak values. If the number of cells in the battery increases accordingly battery current will also increases and the accelration will also increases and improvws the 1st plote quite more.
- The 5th plot shows the soc of battery
- The 6th plot shows the fuel economy of the vehicle.
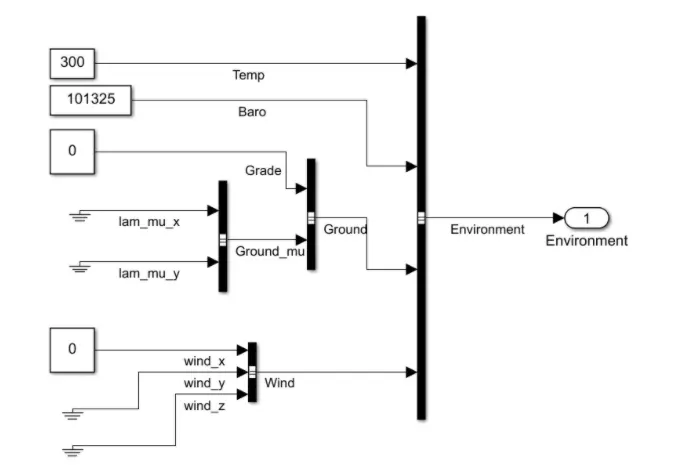
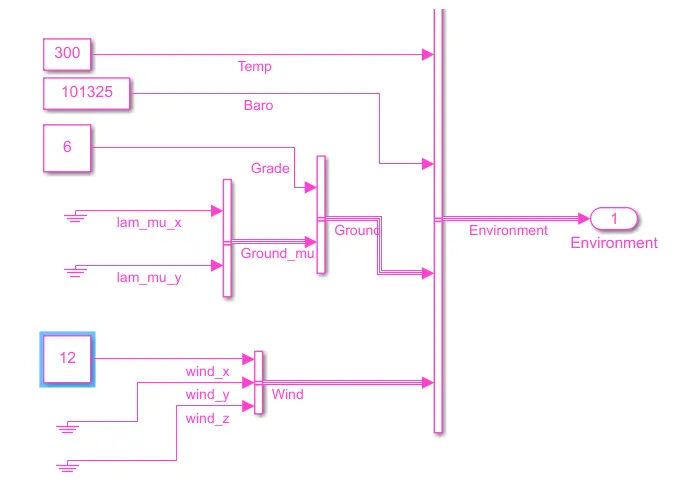
Now change the grade and wind velocity to 6 and 12 respectively but without changing other parametrs
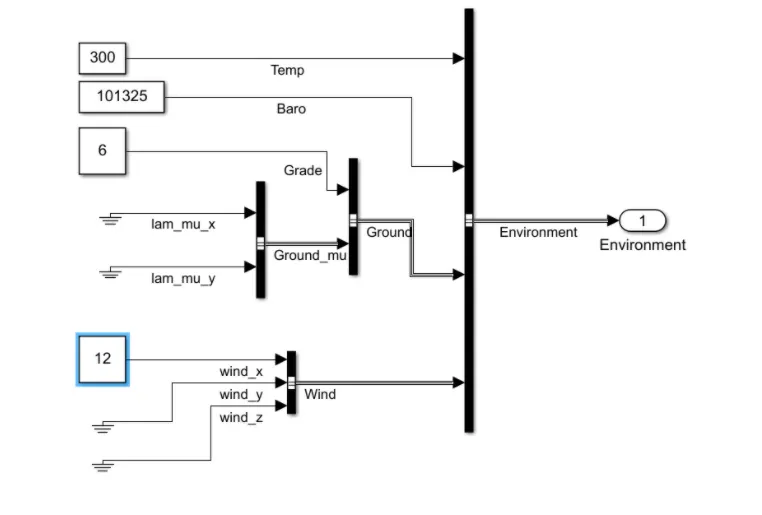
After changing the grade and wind velocity values, we got below results after run the simulation
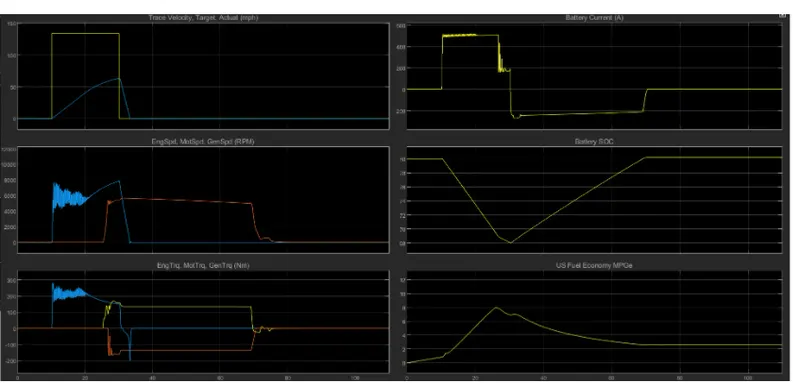
The simulation result is different from the previous one because we changed the grade and wind velocity values in the environment block
We observed the below points when compared these results
- The top velocity has reduced in the second simulation when compared to first simulation.
- The fuel economy has reduced to half and engine speed also reduced in the 2nd simulation and the remaining plots remains constant.
PART4: Keeping all other parameters same, compare the simulated results of hybrid and pure electric powertrains
Pure elctric powerstarin and change the drive cycle to WOT drive cycle with change in grade and wind velocity values in the environment block.
The below image shows the result of simulation
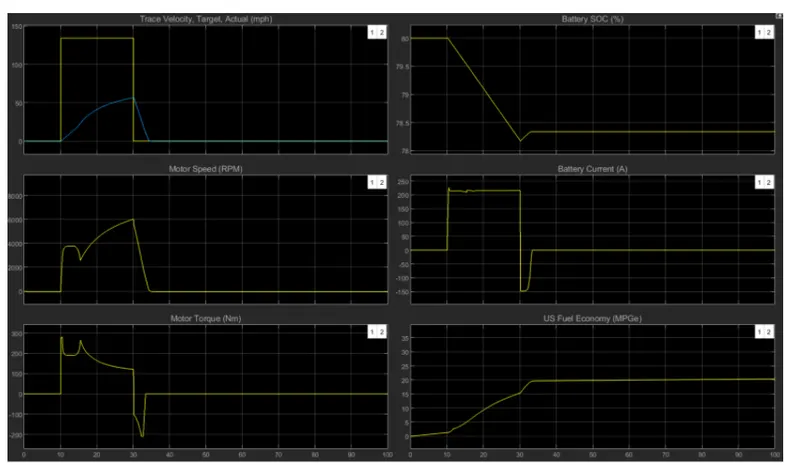
Comparision between HEV and EV
- The fuel efficieny is very much higher in the EV vehicle
- The EV vehicle produces zero emmission
- The HEV vehicle consists of motor , generator and ic engine so that it increases overall weight of the vehicle as compared to EV vehicle
- The discharging rate is very low and soc is also high when compared to HEV vehicle