Week-4 Challenge WOT Condition Part-2
1. What is the difference between the mapped and dynamic model of engine, motor, and generator?
mapped model
when a model has exact data sets and it can be used for a perticular perposed, it can be controlled statically for a pertecular behaviour. this model has predefined values.
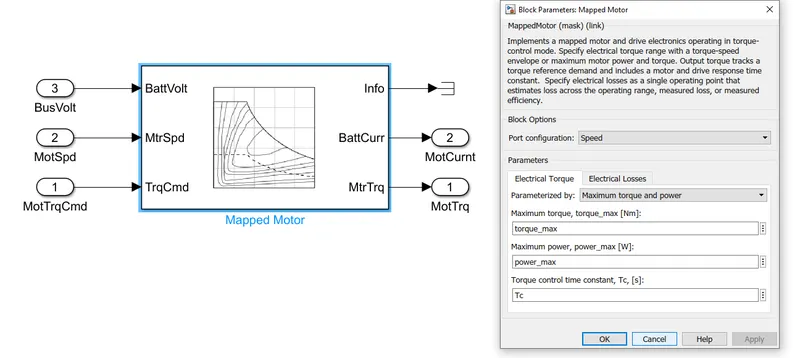
figure 1: mapped motor
above figure is a mapped motor. it is clearly visible that all the parameter is inserted manually like motor torque command, speed of the motor, battery current and other informantion. mapped model is used when stady-state engine simulation. here lookup table is required and for analysis specific characterize of the engine. The charts indicate fundamental engine parameters such as torque, fuel flow rate, BSFC, and engine-out emission particulates.
dynamic model
dynamic model has more component level data and it is used when more fundamental data is needed for analysis. It is used to assess the effect of specific motor elements on actual performance.
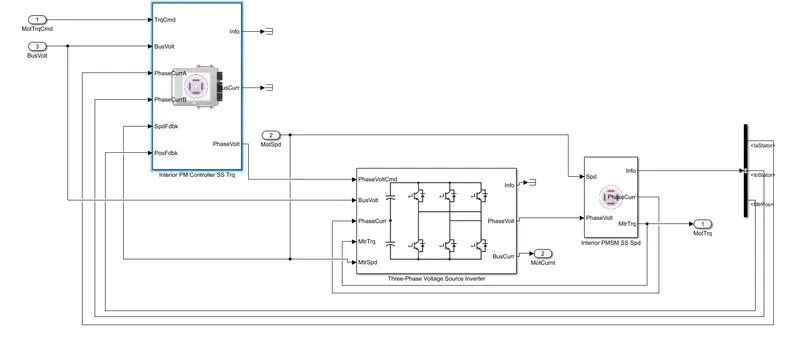
figure 2: dynamic model
here in the figure model more motor component level data is used like interior PM controller and three phase voltage source inverter.
How can you change model type?
by default mapped model is activated but dynamic model can also be acivated. go to modeling tab in the simulink click variant manager from design section. after opening design manger
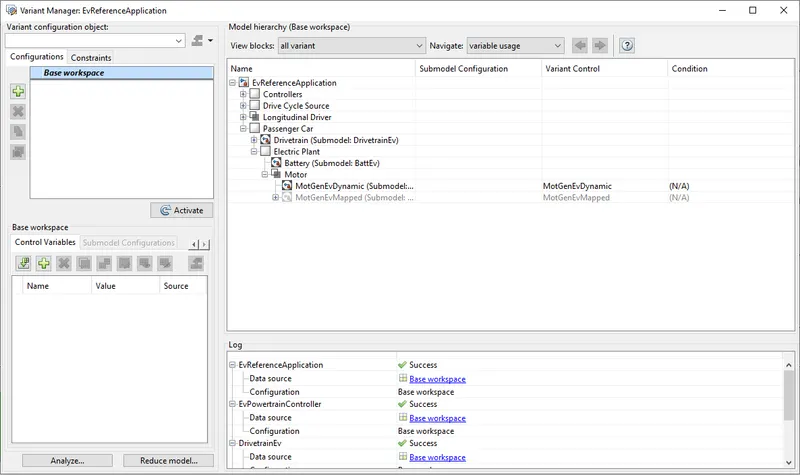
figure 3: varient manager in the simulink
a box will open from there expand motor section. there are two type of model by default mapped is activated. now clike on dynamic model and click on activate button on the left side.
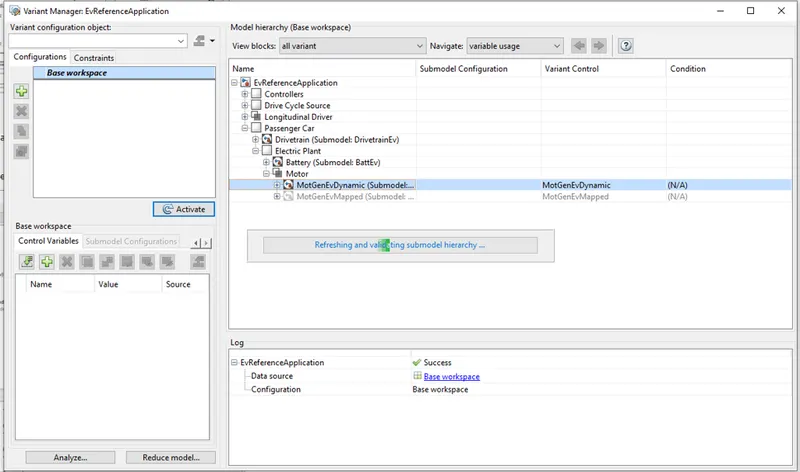
figure 4: activating dynamic model
2. How does the model calculate miles per gallon? Which factors are considered to model fuel flow?
below figure is the block to calculate miles per gallon.
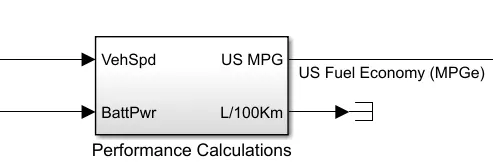
figure 5: smulink blok to calculate miles per gallon
here in the block set it is clear that there are two input comming, first one is vehicle speed and other one is battery power. on the other side desiered output which is US fuel economy calculated.
but in this blockset there are sevaral mathemathical calcultion to calculate the fule economy, which is shown below
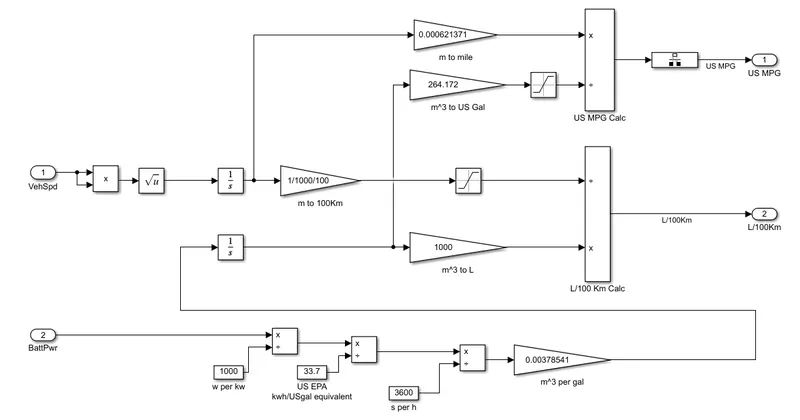
figure 6: performance calculation
at first speed data of the car is used for distance travelled in meter and then converted to meter to mile. on the othre hand battery power input (KWh) and converted into equivalant to gasoline using US EPA by dividing 33.7.
it means 1 gallon of gasoline is equal to 33.7 KWh. after that dividing distance travelled by no of gallon gasoline miles per gallon can be derieved. in HEV this data is used by IC engine to get the to get the required gallon.
3. Run the HEV ReferenceApplication with WOT drive cycle. Change the grade and wind velocity in the environment block. Comment on the results.
open HEV reference application
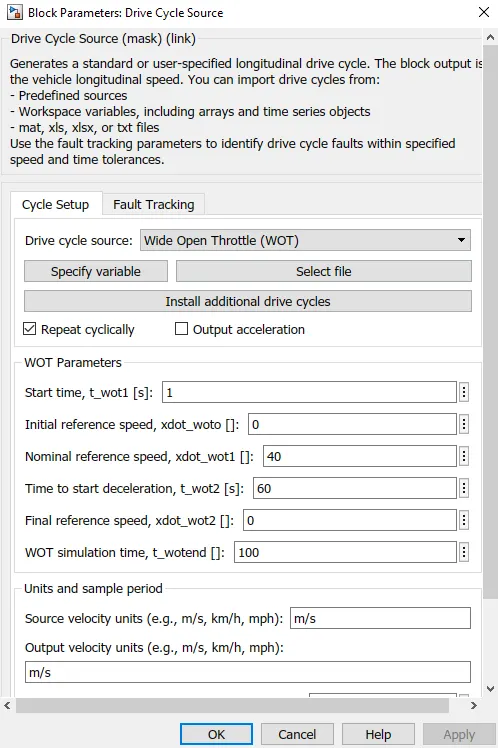
figure 7: drive cycle source
drive cycle source is selected as WOT
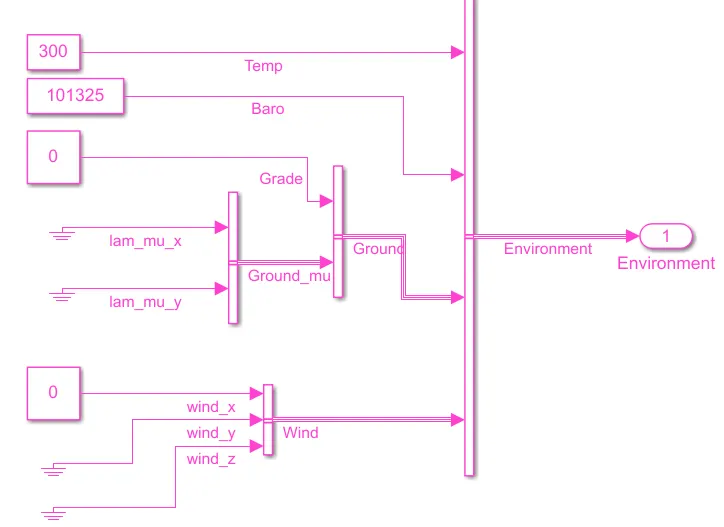
figure 8: environment block
at first grade and wind is = 0
case 1
wind and grade is 0
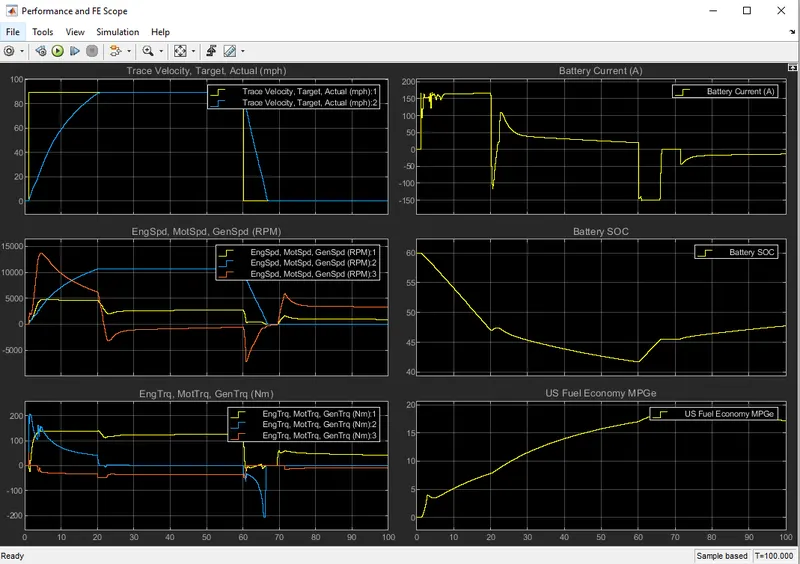
figure 9: output of simulation
case 2
grade = 5 and wind = 10 m/s
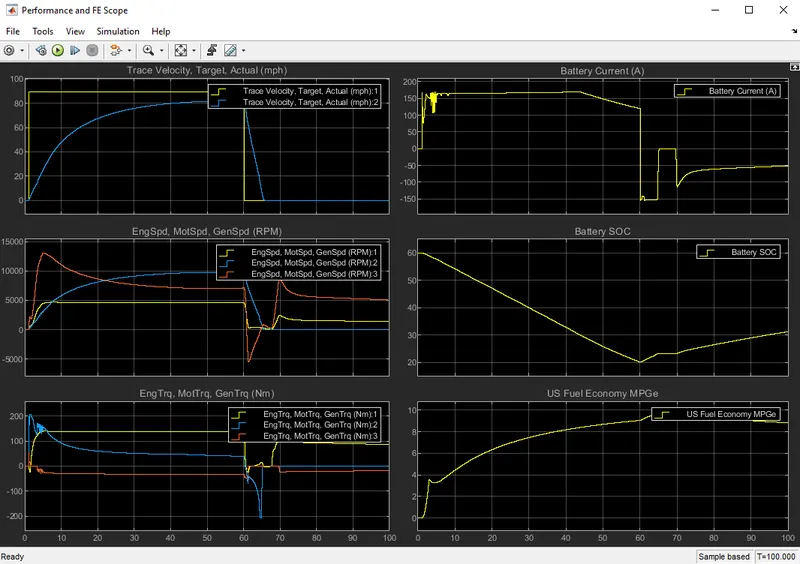
figure 10: output of simulation
case 3
grade = 10 wind= 30m/s
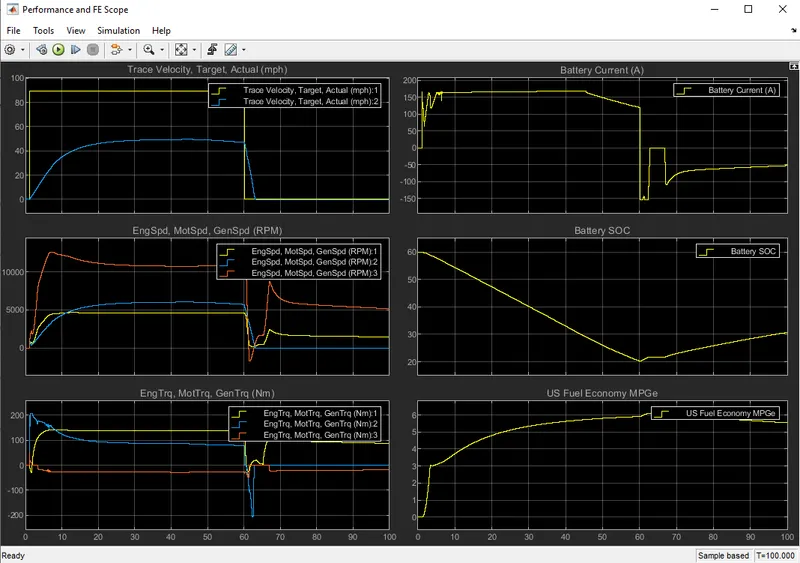
figure 10: output of simulation
so, looking the output a conclution can be made according to the data. at first when grade and wind velocity is 0 speed of the motor give a optimal output. on the other hand increasing grade and wind velocity pick velocity could no be achieved due to aerodynamic force. moreover battery SOC and other parameter alos got reduced with increasing of wind and grade. so when external force is increasing battery needs more power and at the same time battery SOC discharge rate is comparatively high.
4. Keeping all other parameters same, compare the simulated results of hybrid and pure electric powertrains.
simulation time is 100 sec.
Nominal reference speed 26.8 sec
Time to start deceleration 30sec
WOT drive cycle source
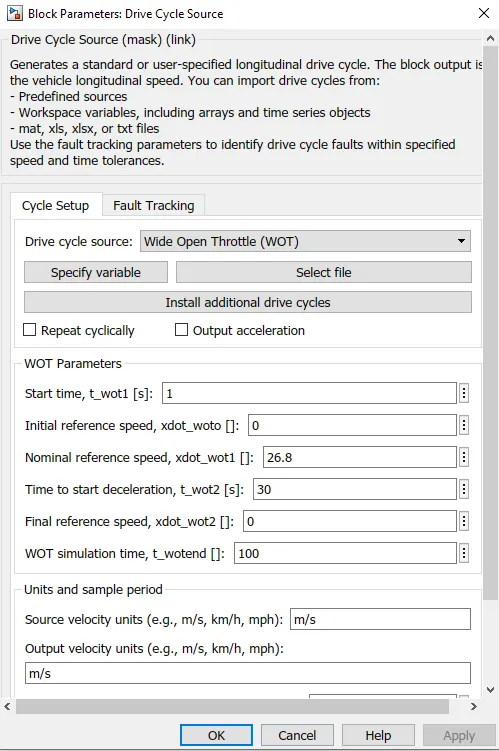
figure 11: drive cycle source
EV model powertrain configaration
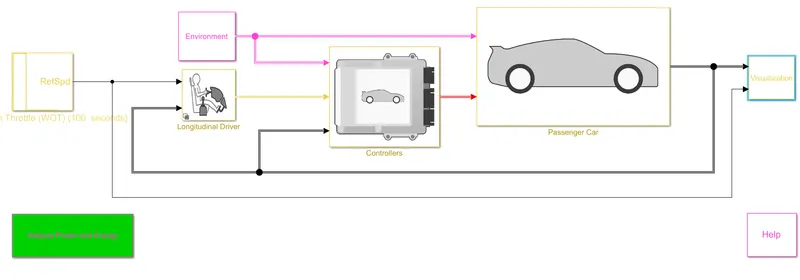
figure 12: simulink model (EV)
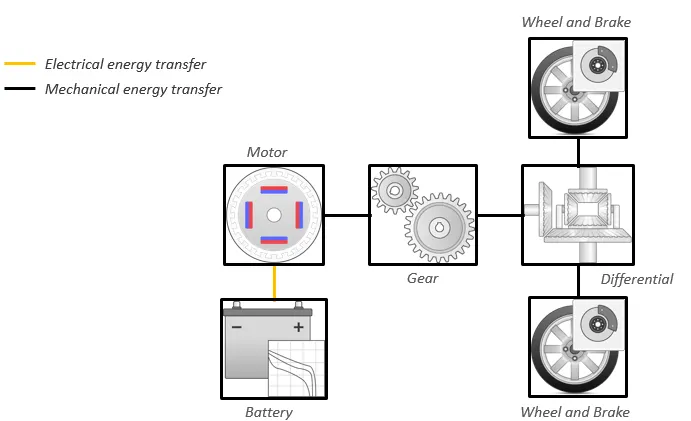
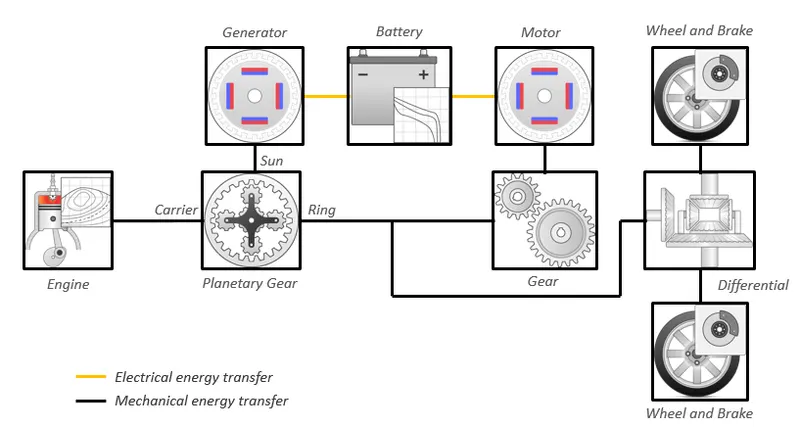
figure 13: powertrain configaration of EV figure 14: powertrain configaration of HEV
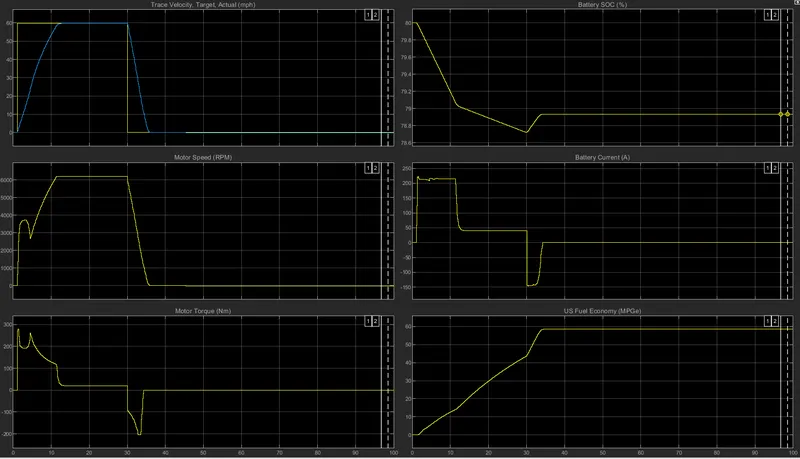
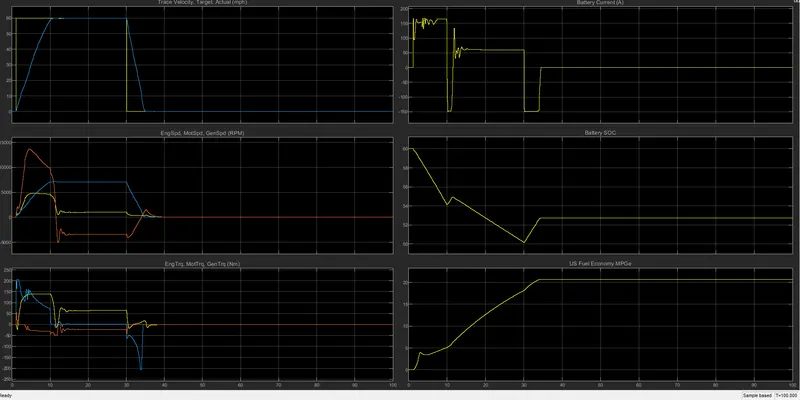
results
for EV
for HEV
conclusion
seeing this result it can be conclude that time taken to reach peak velocity is less in HEV compaired to EV. fuel economy is better in EV as there are no frictional parts like HEV. deceleration time of HEV is also low compaitively EV model.