Week-4 Challenge WOT Condition Part-2
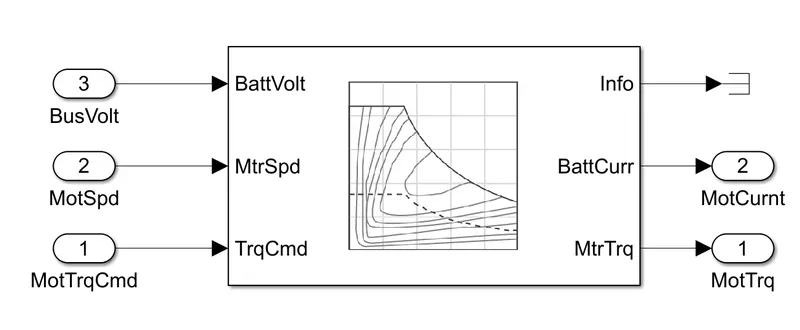
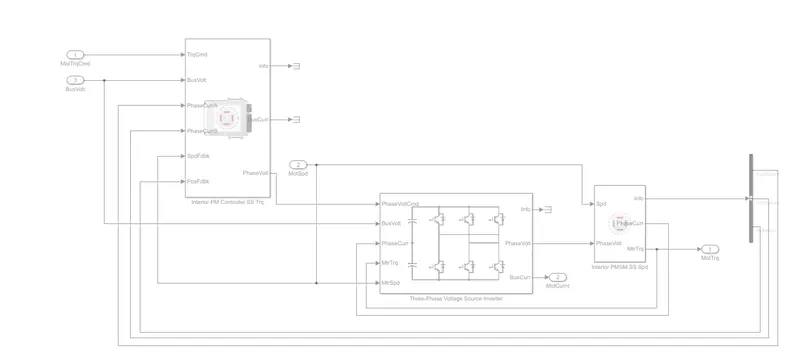
1.What is the difference between mapped and dynamic model of engine, motor and generator? How can you change model type?
| Mapped Model | Dynamic Model |
|
|
|
|
|
|
 |
 |
2.How does the model calculate miles per gallon? Which factors are considered to model fuel flow?
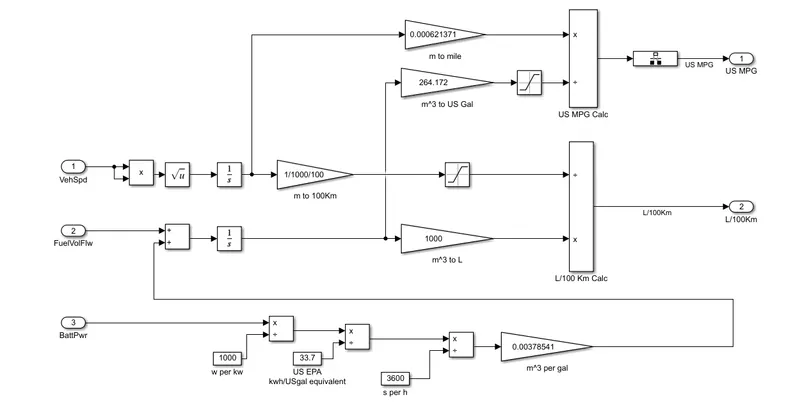
- The above image Shows the subsystem of perfomance calculation
- In IC Engine we can calculate the fule economy by how much distance covered by vehicle and how much petrol or diesel used by the vehicle
- In EV also same but instend of petrol or diesel here we are using energy
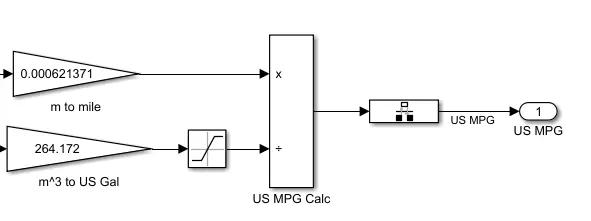
- The input form vehicle speed is converted into miles by multiplying 0.000621371
- Fuel flow taken in mA3 and it is converted into equivalent Gallons by multiplying by 264.172
- For getting miles/gallon divid the inputs miles and gallon
3.Run the HEV ReferenceApplication with WOT drive cycle. Change the grade and wind velocity in the environment block. Comment on the results.
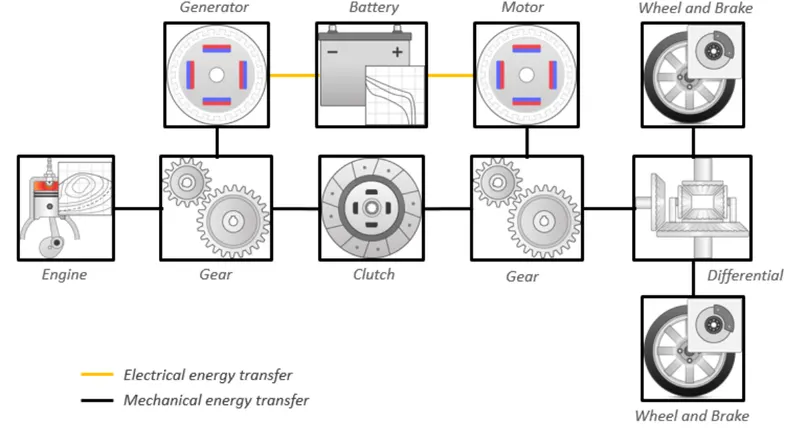
- Hybrid Vehicle means that vehicle using more than one power source for running the vehicle
- The above picture show that the hybrid electric vehicle Configeretion
- And this is a series Hybrid electric vehicle
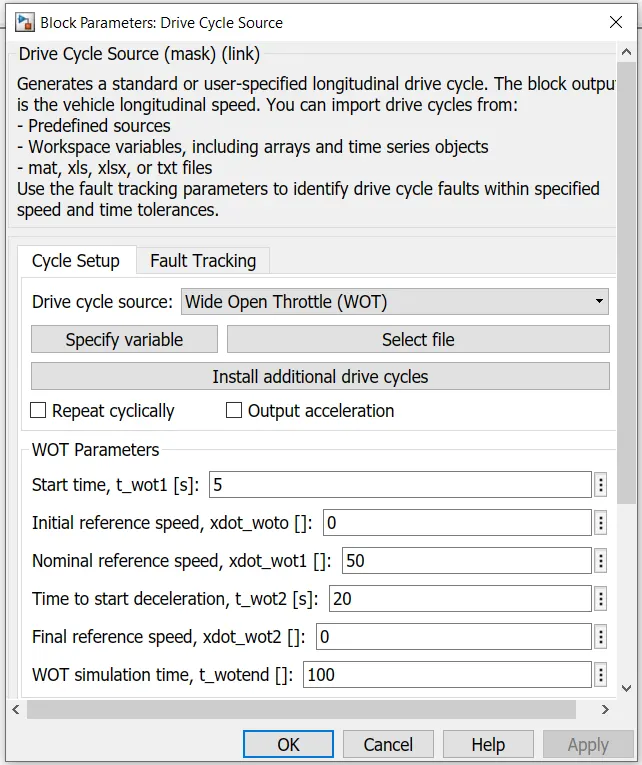
- change the Drive cycle source to the wide open throttle
- The Above image Shows the Drive Cycle Source
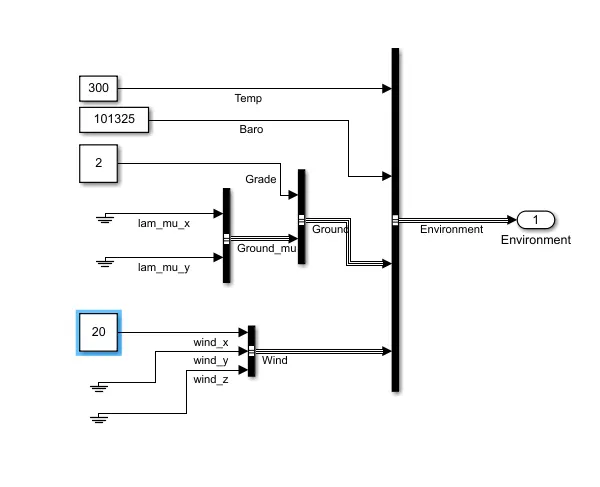
- Now We Are Changing the input environment of the system
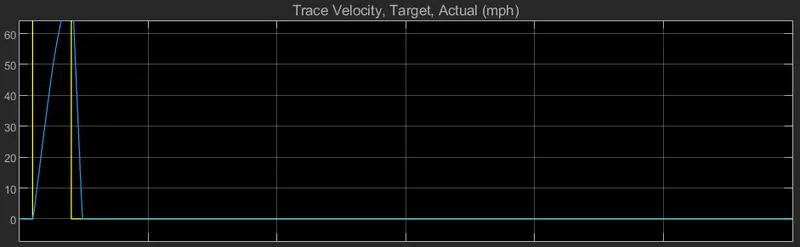
- The Above Image shows the plot Diagram of trace Velocit,Target, actual(mph)
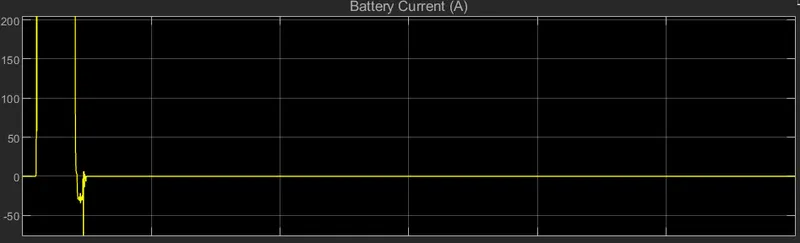
- The Plot Diagram Shows the Battery Current Usage
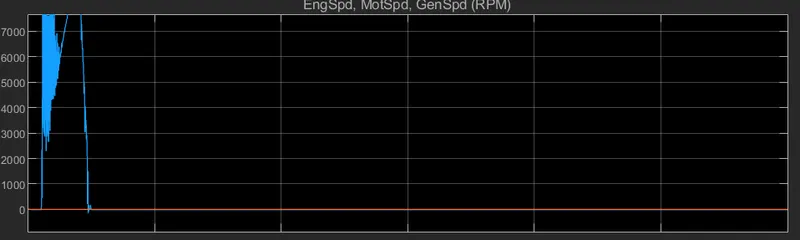
- This plot digram shows the engie speed and Motor Speed ,and generator speed in RPM
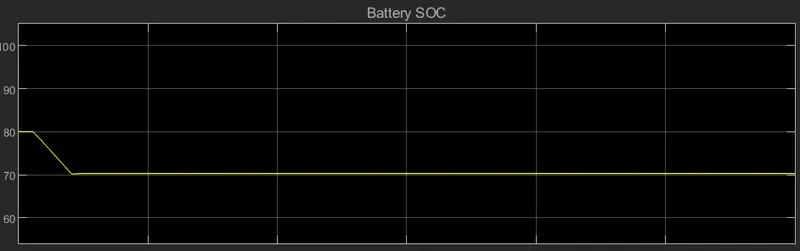
- This plot shows the Sate of charge of the battery
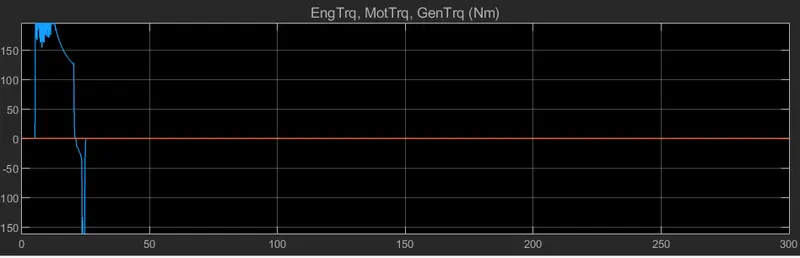
- this plot shows the Enginne, motor, ang generator Torque
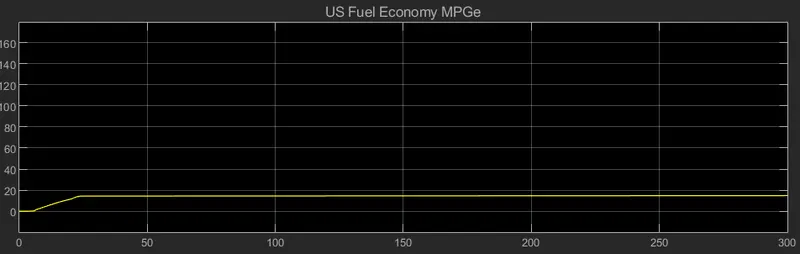
- This Plot Shows the Us fule economy in Mile per galon energy
4.Keeping all other parameters same, compare the simulated results of hybrid and pure electric powertrains.
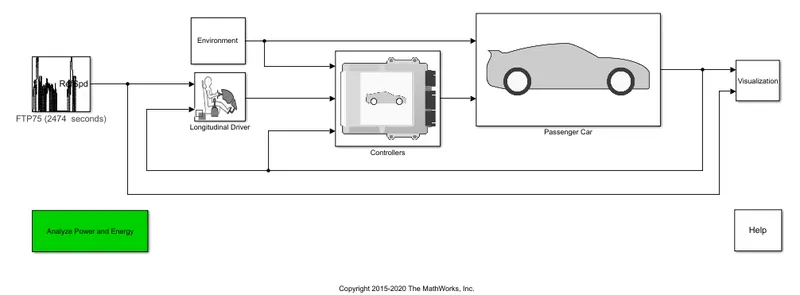
- The above Diagram Shows the model of Pure Electric Vehicle
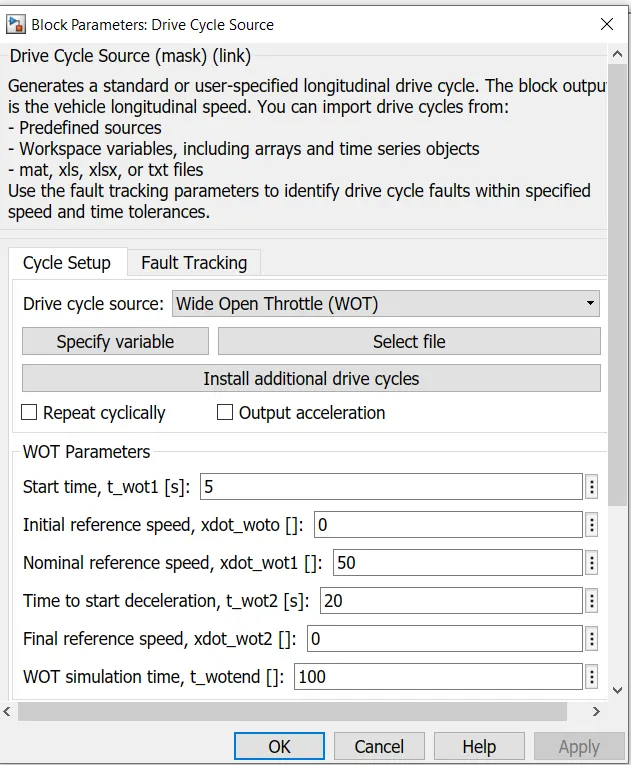
- Now We arw going to change the parameter of drive cycyle same to the HEV
- then we will see the difference between the HEV and Pure EV
The Below Plot Graph Is
- trace Velocit,Target, actual(mph)
- Battery Current Usage
- engie speed and Motor Speed ,and generator speed
- Sate of charge of the batter
- Enginne, motor, ang generator Torque
- fule economy in Mile per galon energy