Week-4 Challenge WOT Condition Part-2
1) Difference between mapped and dynamic model:
Mapped model:The mapped model runs on the data given in the loop-up table and hence it runs faster than the dynamic model
Dynamic model: The model which represents the actual components is the dynamic model
Mapped motor/generator: MotGenEvMapped
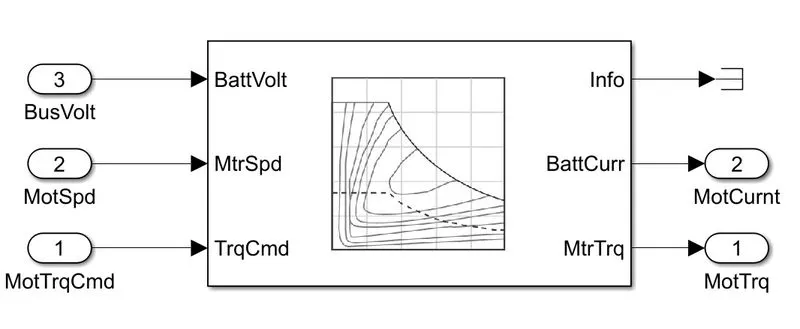
Implements a mapped motor and drive electronics operating in torque-control mode. Output torque tracks a torque reference demand and includes a motor and drive response time constant.
Dynamic motor/generator: MotGenEvDynamic
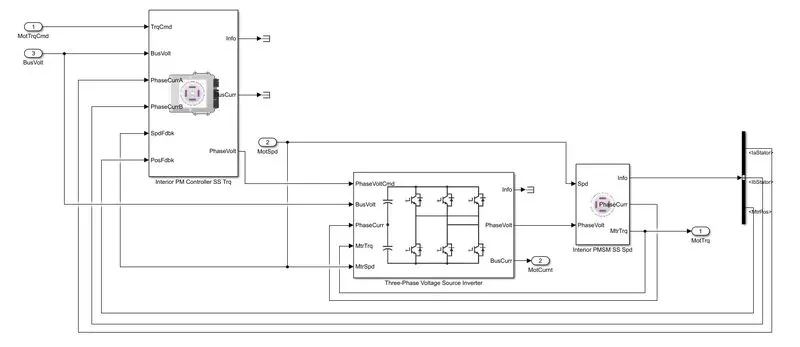
It consists of actual Interior Permanent magnet synchronous motor and motor controller blocks.
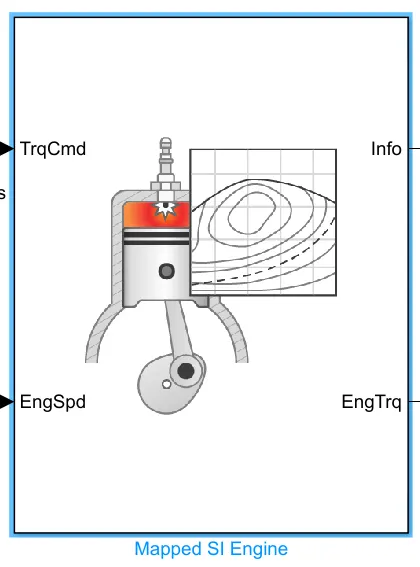
Mapped SI engine:
Implements a mapped (steady-state) spark-ignition engine model using power, air mass flow, fuel flow, exhaust temperature, efficiency, and emission performance lookup tables. We can use the block for hardware-in-the-loop (HIL) engine control design, or vehicle-level fuel economy and performance simulations.
Dynamic SI engine:
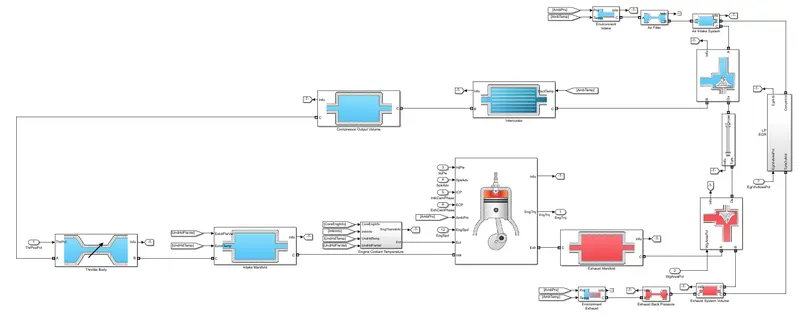
Implements a spark-ignition (SI) engine from intake to exhaust port. The block is used in larger vehicle models, hardware-in-the-loop (HIL) engine control design, or vehicle-level fuel economy and performance simulations. The SI Core Engine block calculates:
- Brake torque, using either the torque structure or simple torque model
- Fuel flow
- Air mass flow, using either the speed-density or dual-independent cam phasing models
- Air-fuel ratio (AFR)
- Exhaust temperature and exhaust mass flow rate
Mapped CI engine:
Implements a mapped (steady-state) compression-ignition engine model using power, air mass flow, fuel flow, exhaust temperature, efficiency, and emission performance lookup tables. The block can also be used for hardware-in-the-loop (HIL) engine control design, or vehicle-level fuel economy and performance simulations.
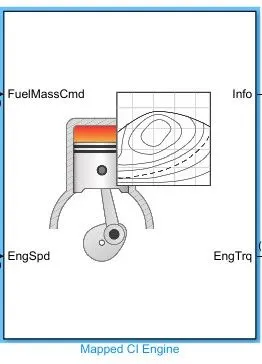
Dynamic CI engine:
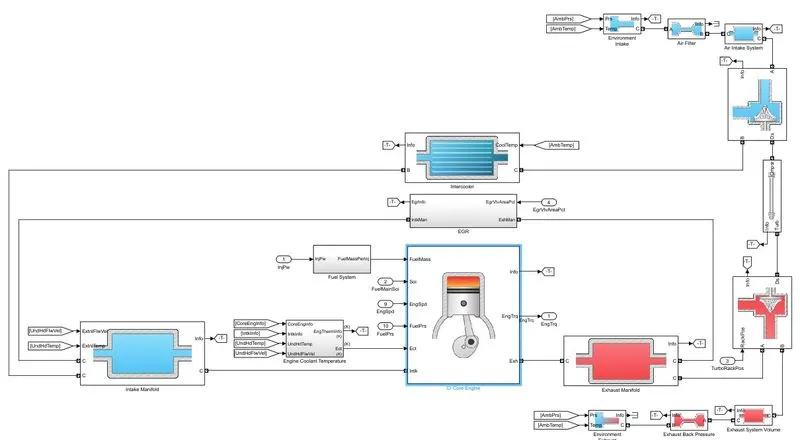
Implements a compression-ignition (CI) engine from intake to exhaust port. The block is also used for hardware-in-the-loop (HIL) engine control design, or vehicle-level fuel economy and performance simulations. The CI Core Engine block calculates:
- Brake torque, using either the torque structure or simple torque model
- Fuel flow
- Air mass flow, including exhaust gas recirculation (EGR), using a speed-density model
- Air-fuel ratio (AFR)
- Exhaust temperature and exhaust mass flow rate
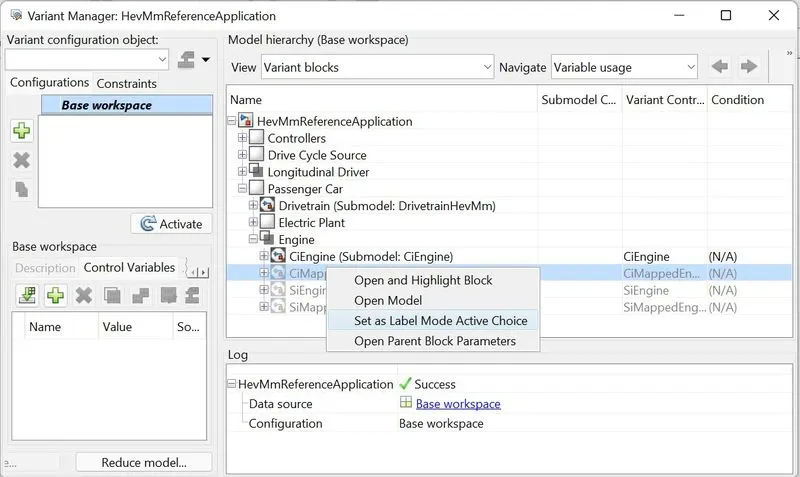
To change the model type: The model type between mapped and dynamic can be toggled by changing the preference in variant manager. View --> Variant manager --> select the required model --> right click --> set as lable mode active choice. The model will be selected.
2)Miles per gallon calculation:
The block for calculation of Miles per gallon (MPG) is shown . Miles per gallon of a car represents how far a car can travel per gallon of fuel consumption.
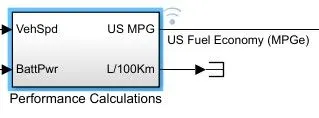
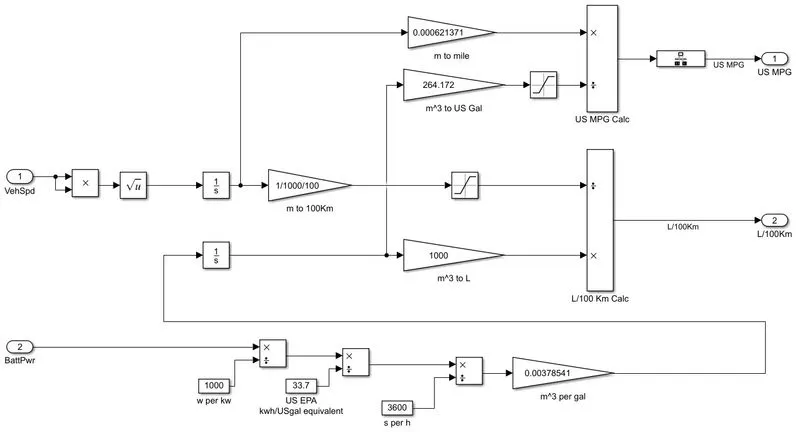
Vehicle speed to distance in miles: The vehicle speed is integrated to obtain the distance in metres. It is then converted to miles with the gain factor.
Battery power to gallons: The battery power in W is first converted to kW and then divided by 33.7 to obtain the per gallon equivalent per second. It is then converted to per gallon equivalent in hours by diving by 3600. The output is multiplied by a gain to obtain m3 per gallon which is again integrated to obtain the output in m3. It is multiplied by a factor of 264.172 to get the US gallon equivalent. Then it is divided by distance in miles to obtain Miles in Gallons (MPG).
The factors that are considered to model the fuel flow are vehicle speed and battery power.
3)HEV ReferenceApplication with WOT drive cycle:
Output with 0 grade and 0 wind velocity:
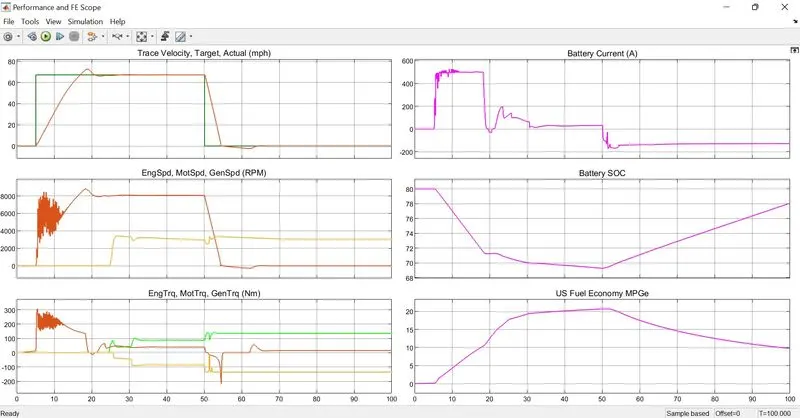
Time to accelerate to reference speed: 20.3 s
Time to decelerate: 4.8 s
Motor speed: 8000 rpm
Engine and generator speed : 3000 rpm
SOC of Battery used for acceleration: SOC decreased from 80% to 71% until it attained constant speed. The rate of discharge was slow once the vehicle attained constant speed.
SOC during deceration: The SOC started increasing from 69% indicating regenerative braking.
Fuel economy: 20 MPG
With wind velocity and grade:
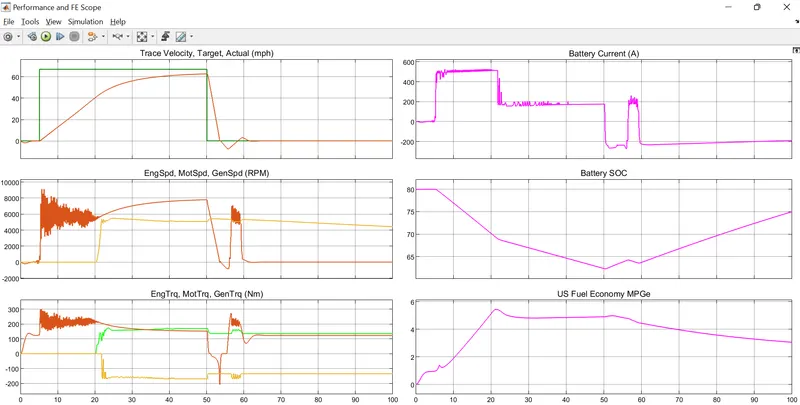
Time to accelerate to reference speed:Attains constant speed at 38 s but due to gradeability and wind velocity the vehicle could not attain the reference speed
Time to decelerate: 3.8 s
Motor speed: 8000 rpm
Engine and generator speed : 5000 rpm
SOC of Battery during acceleration: SOC decreased from 80% to 68% during initial acceleration. The rate of discharge was comparatively less and it decreased upto 62.4% until deceleration.
SOC during deceration: The SOC started increasing from 62.4% indicating regenerative braking.
Fuel economy: 4.8 MPG
4) Comparison of Hybrid and Pure electric powertrains:
Hybrid powertrain output:
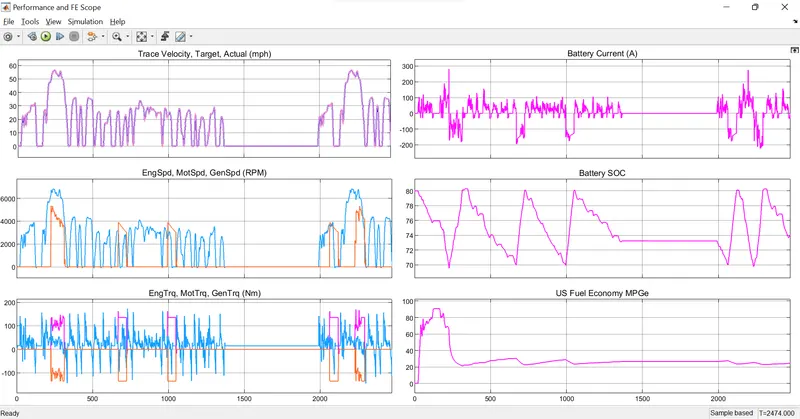
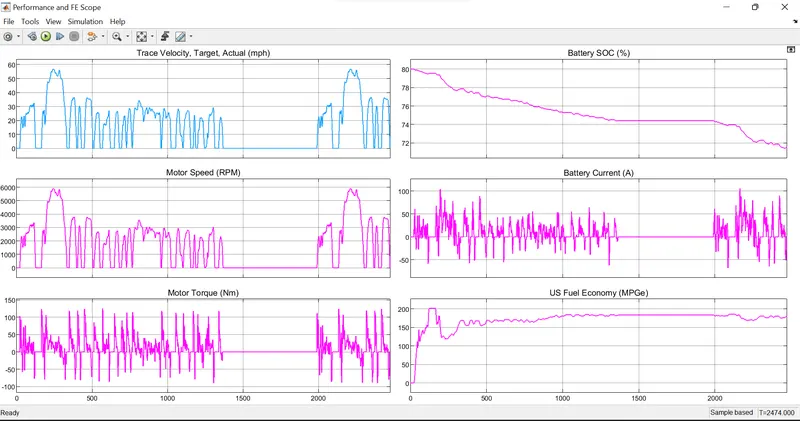
Pure Electric powertrain output:
Comparison:
1) The battery current is negative during each deceleration in HEV indicating regenerative braking. The regenerative braking in HEV provides more power to charge the battery due to the presence of engine torque than the pure EV.
2) The fuel economy in HEV is less when compared to Pure EV. Fuel economy of HEV is 26 MPG whereas for pure EV its 186 MPG.