HEV modeling Assignments - Simulating Wide Open Throttle Condition
1. What is the difference between mapped and dynamic model of engine, motor and generator? How can you change model type?
The Mapped models uses a steady-state lookup tables to characterize the performance of the engine, motor and the generator. For example, the mapped engine represents the engine bahevior as a set of lookup tables (brake torque, fuel flow, efficiency, emissions, etc) as a function of commanded load and measured engine speed. The mapped models are suitable for analysis and design activities that do not require to capture the dynamic characteristics, for example, in engine and transmission matching analysis for fuel economy, emissions, and performance tradefoffs. The mapped models run faster when compared to the dynamic models.
The Dynamic models represents the actual components. It decomposes the model behavior into individual component models to captures the dynamic effects of each component. In this way, the effect of each components on the overall system can be analysed. The dynamic models are suitable for designing control, estimator and diagnostic algorithms that depends on the dynamic behavior of the system.
Example :
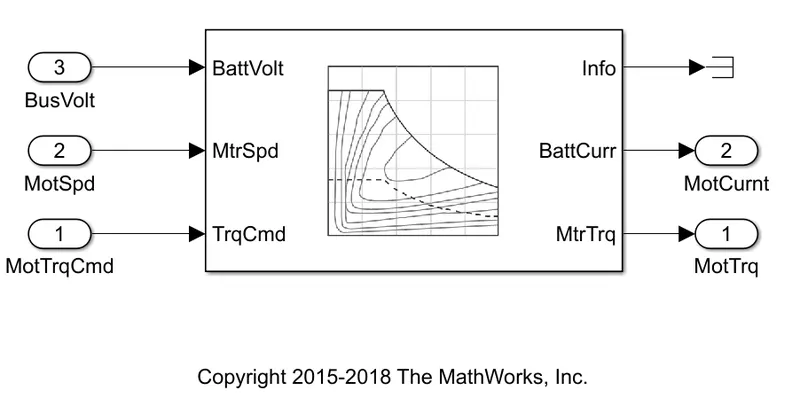
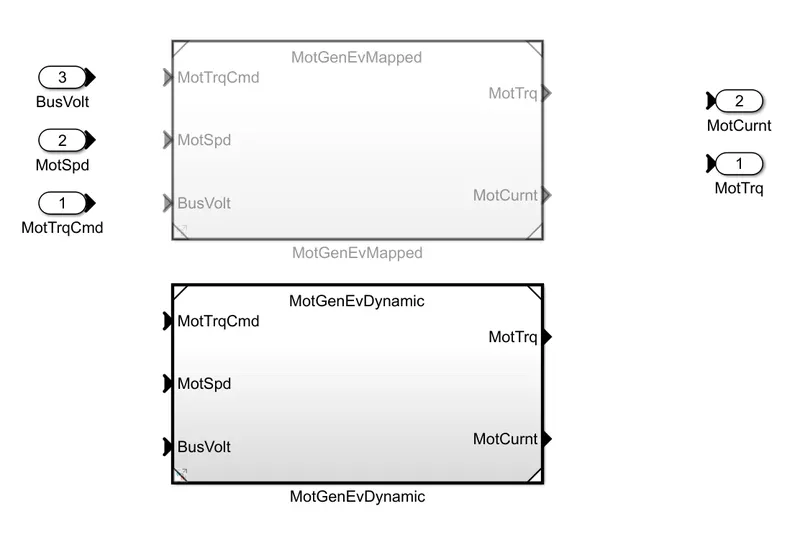
The above diagram is a mapped model of a motor, as it can be observed that the mapped model, has a standard set of inputs ( bus voltage, motor speed and torque command ) ,which is mapped to the outputs required (motor torque and battery current requirement), based on tabular data.
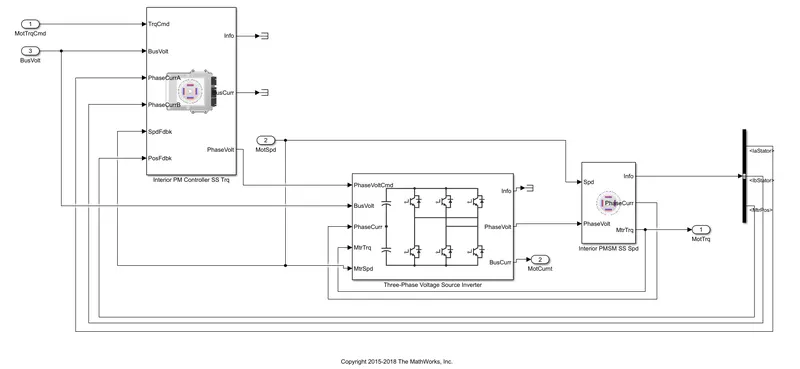
As indicated above, the dynamic model above has the actual motor and motor controller and inverters. The actual compnents are modeled to capture the dynamics of the actual systems, hence its more of a real-time model, and hence takes longer to simulate when compared with the mapped models.
Changing model type :
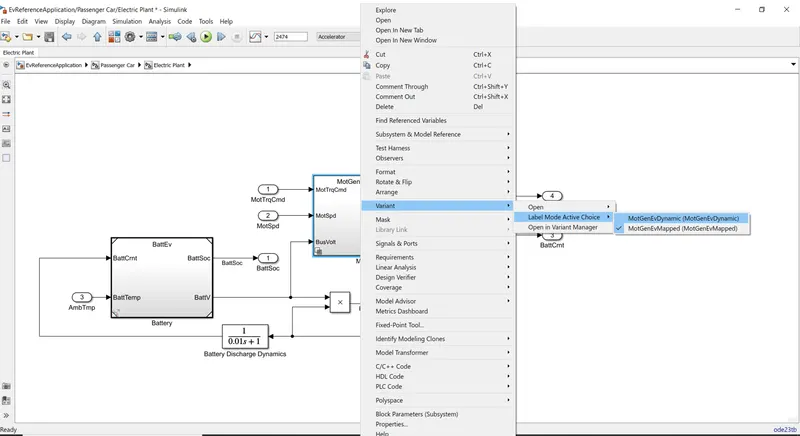
Right click on the component model, say motor/generator in this case.
Select on Variant.
Select the dynamic model if mapped model was previously active, or vice-versa.
Now the Dynamic model will be actived.
Example : Initially, the mapped motor is activated.
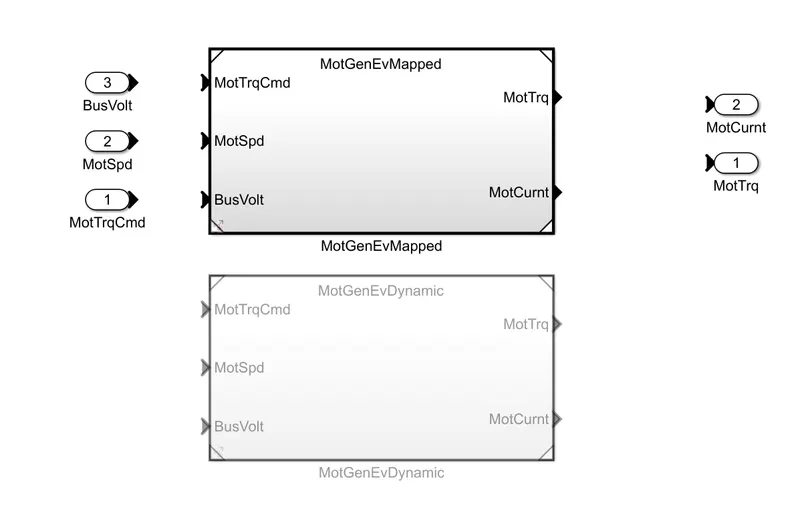
Changing the variant by following the above mentioned steps.
The variant changes from mapped to dynamic model.
2. How does the model calculate miles per gallon? Which factors are considered to model fuel flow?
In the visualization subsystem, the model calculates the miles per gallon equivalent based on the amount of power drawn from the battery. It uses a KWh to US Gallon conversion rate, to convert the elctric energy drawn into its US Gallon consumption equivalent.
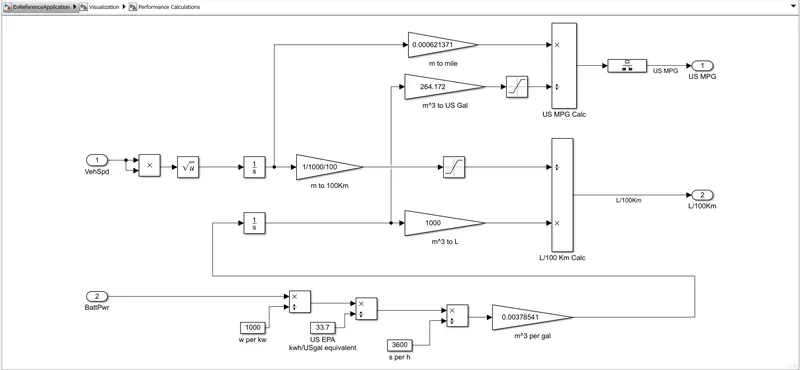
The battery power is given as an input in KiloWatts. Its first converted into Watts. This power is converted into the gallons of fuel consumption based on the conversion rate of 33.7 KWh/US Gal. It means if 33.7 KWh is consumed, then its equivalent to 1 US Gallon of fuel consumption. Following the units, it is observed that we have attained the US Gallon consumed per hour. To convert this into consumption per second (US Gallon/second), it is further divided by 3600 ( 1 hr = 3600 seconds). The consumption units are modified from gallon/second to `m^3`/second. Then further it is integrated to obtain the consumption of energy in terms of `m^3`. This `m^3` is converted into two units - into gallon and another into Litres. In this way, the fuel consumption can be obtained either in MPG or in terms of L/100km. Since, in this case the calculation is about MPG, the conversion of `m^3` to gallons is only concentrated (1 m^3 = 264.172 US gallon).
The distance covered is obtained by integrating velocity over time. This is converted to a suitable unit (miles in this case - 1m =0.000621371 miles). Dividing the distance in miles with the consumption of enregy in terms of US gallons, gives the consumption of fuel in miles per gallon (MPG).
To model the fuel flow, the two input parameters required are battery power consumption and Vehicle velocity.
Apart from these two inputs, the other are unit converions :
- KWh to US gallon conversion ( 1KWh = 33.7 US Gal).
- KW to W (1KW = 1000W) ; Hour to second (1 hr = 3600 sec).
- m to miles (1metre = 0.000621371 miles).
3. Run the HEV ReferenceApplication with WOT drive cycle. Change the grade and wind velocity in the environment block. Comment on the results.
The HEV multimode reference application is simulated using the WOT drive cycle with the default grade and wind velocity settings. In this model, the Wide Open Throttle (WOT) is the input drive cycle, which is given to the longitudinal driver model, which compares the reference speed with the actual vehicle velocity, and accordingly adjust the acceleration and braking actions. This along with hte environmental inputs are given into the controller, which works on a particular control strategy, and gives inputs to the vehicle powertrain accordingly. 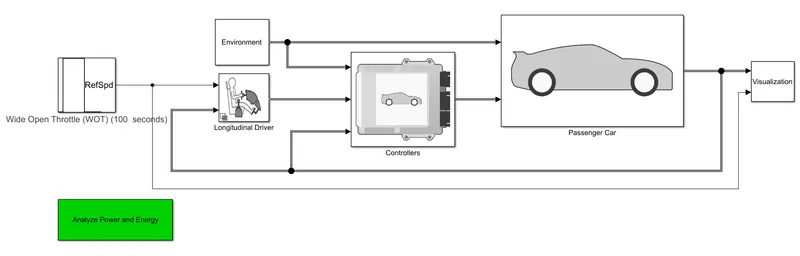
In this case, the grade = 0 and wind velocity = 0. The Wide Open Throttle cycle settings are set as follows :
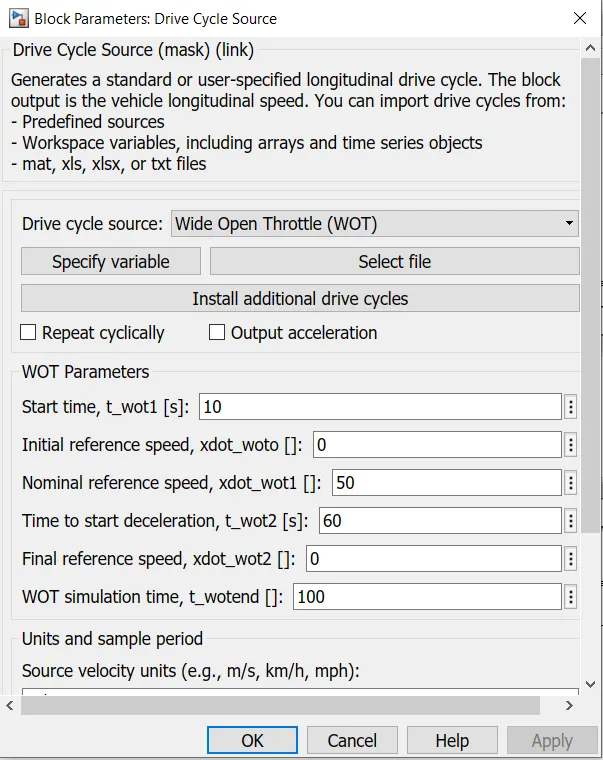
The cycle is simulated for the indicated time (100 seconds), and the default results are as follows :
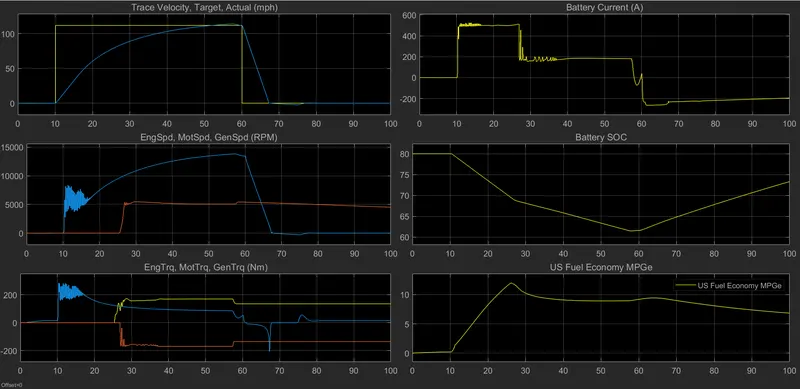
It can be observed that the vehicle reaches its desired speed slowly because of the limitation in the motor and engine power. Hence, the vehicle reaches the requried speed of 111 mph ( ~50m/s), at around 52.3 seconds ( it takes around 42 seconds to reach from 0 to 110 mph). The motor power is limted by the battery current. It can be observed that the battery current has a maximum discharge value of around 500 A. On the other hand, when the vehicle decelerates, the battery charging current is around 260A. The battery SOC decreases from 80% to 61.5% during the wide open throttle acceleration, and on the other hand after 60 seconds the battery SOC increases, indicating that the battery is recharging while the vehicle decelerates.
Case 1 : The Grade of the driving cycle is modified to 5 degrees, while keeping all the other parameters the same.
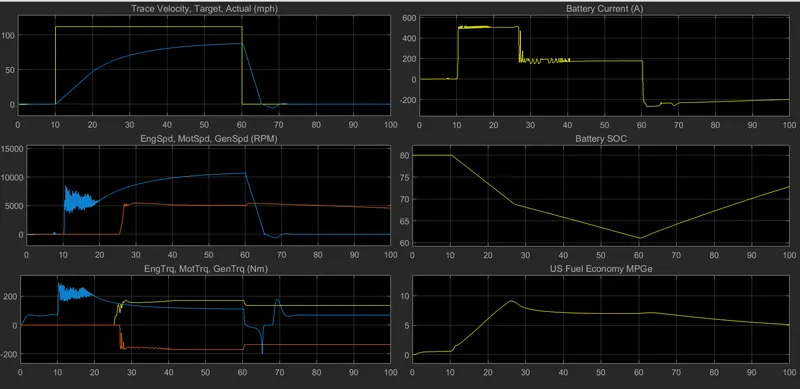
The battery maximum discharge current is the same 500A, and battery charging current is also the same at 260A. The Battery SOC variation plot is almost identical, as the current drawn is the same. The US fuel economy MPG equivalent has reduced. The vehicle speed even after 50 seconds of wide open throttle doesnt attain the reference speed of 50 m/s, it attains only 87.6mph (~39.16m/s). This is because of the increase in grade. The velcoity profile with grade= 0 and grade =5 degrees is compared in the following plots. As the grade angle increases, the gradient forces increases, and hence the total resistive forces also increases. This reduces the resultant acceleration at wide open throttle conditions, and therefore the final velocity attained at a given time also decreases.
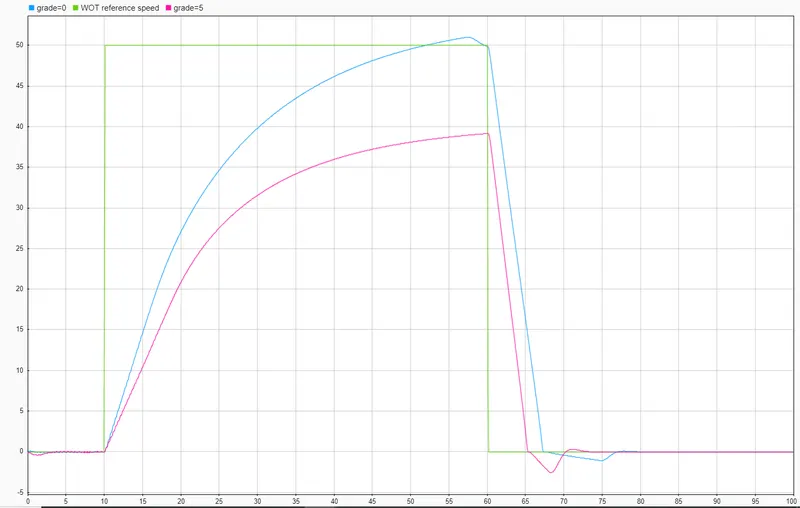
Case 2 : Wind velocity is increased to 10 m/s, while keeping all the other parameters the same.
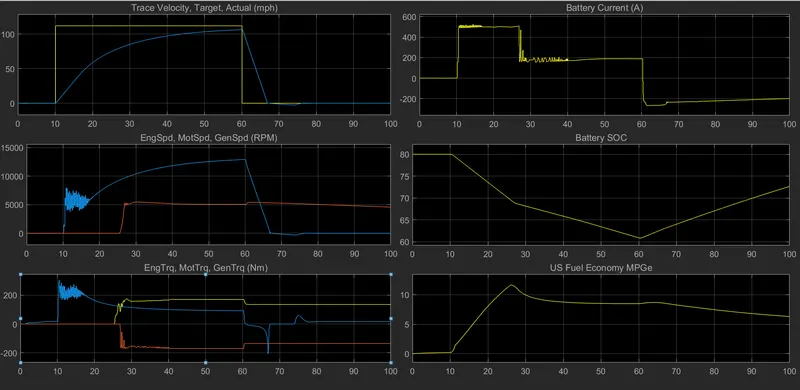
The resultant plots follow the similar trend to when the gradient was increased. The increase in wind velcoity, it impacts the aerodynamic drag resistive forces, and depending on the direction of the wind it impacts the total resistive forces as well. In this case it increases the total resistive forces, due to which during wide open throttle , the acceleration decreases. This in turn causes the final velocity at 60 seconds to reduces from the reference speed. The vehicle reaches the speed of 106 mph (~ 47.4 m/s) at the 60 second mark. The vehicle velcoity profiles are plotted below.
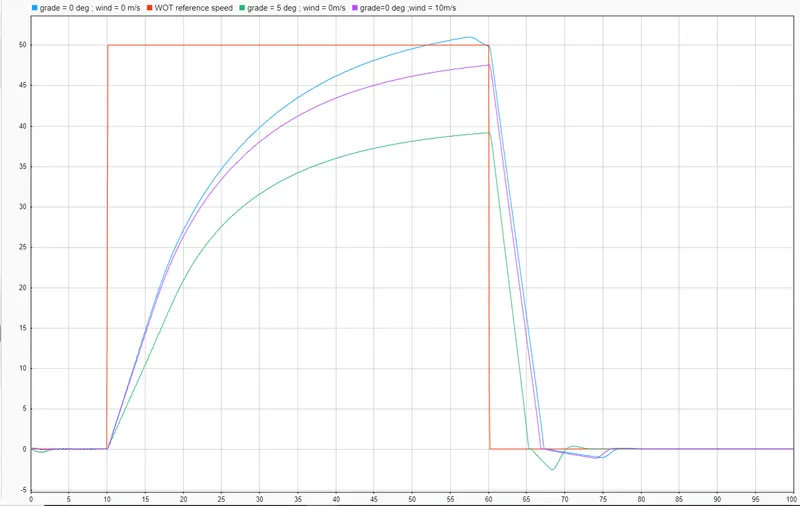
4. Keeping all other parameters same, compare the simulated results of hybrid and pure electric powertrains.
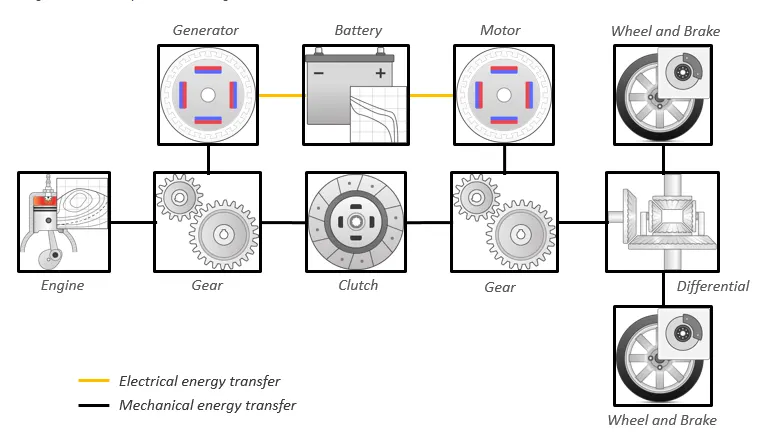
The HEV multimode reference application and the pure electric vehicle reference application is simulated for the same Wide Open Throttle input driving cycle, and the results are compared. The hybrid and electric powertrain setups are as follows :
Hybrid Powertrain :
Pure Electric Powertrain :
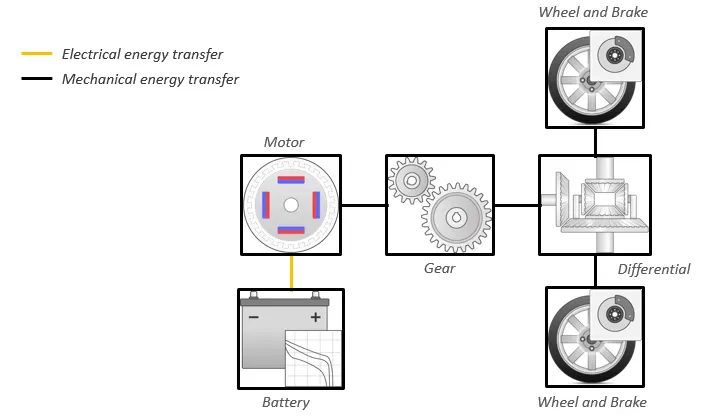
The hybrid powertrain setup includes a 1.5L spark ignition engine, along with a 124KW motor with a maximum torque of 307Nm, and a battery capacity of 20.8Ah. On the other hand the electric powertrain uses a 80KW motor with a maximum torque of 120Nm. The battery has a rated capcacity of 32.5Ah. The motor in the hybrid powertrain is a higher rated motor with higher torque and power. On the other hand the capacity of the battery in the electric powertain is higher.
These two powertrains are simulated for a wide open throttle driving cycle with the environmental conditions set to be the same, and then the results are compared.
The results for the Hybrid powertrain is as follows :
On the other hand, the simulation results for the electric vehicle is as follows :
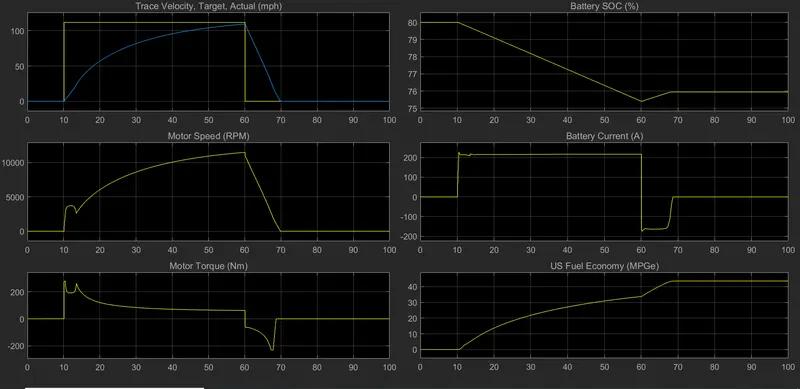
The Hybrid powertrain is able to attain the reference much quicker than the electric powertrain as it can be seen by comparing the first plot. This indicates the acceleration of the hybrid vehicle is more than that of the electric vehicle in this case. This is because the maximum discharge current of the battery is different. In the hybrid powertrain, the maximum discharge current was 500A, while in the pure EV powertrain the maximum discharge current is 215A. This therefore limits the vehicle acceleration. The deceleration is also higher in the hybrid powertrain setup, as seen in the plots ( the speed reduces from 50m/s to 0 m/s more quicker in the hybrid powertrain). The charging current hence is higher in hybrid powertrain (260A), while it is around 170A in the electric powertrain setup. The US fuel economy equivalent is higher in the electric powertrain comapred to the hybrid powertrain. Since the battery capacity in the electric powertrain is higher the drop is SOC is less from 80% to 75.5%, whereas the drop in SOC is higher in the hybrid powertrain from 80% to 61.5%. The battery capacity is set higher in the electric powertrain because in the EV it is the only energy sources, whereas the HEV has both the battery and the engine as the energy sources.
References :
Mapped and Dynamic models of Internal combustion engines :
https://in.mathworks.com/help/autoblks/ug/internal-combustion-mapped-and-core-engine-models.html
MATLAB Help documentation : Getting started with powertrain blockset :
https://in.mathworks.com/help/autoblks/ug/getting-started-with-powertrain-blockset.html
https://in.mathworks.com/help/autoblks/ug/explore-the-electric-vehicle-reference-application.html