WOT Condition Part-2
WIDE-OPEN THROTTLE – PART – 2
AIM:
-
DIFFERENCE BETWEEN MAPPED MODEL AND DYNAMIC MODEL OF ENGINE, MOTOR AND GENERATOR. ALSO, HOW TO CHANGE A MODEL TYPE.
-
CALCULATION OF MILES PER GALLON AND FACTORS THAT ARE CONSIDERED TO MODEL FUEL FLOW.
-
EXECUTION OF HEV ReferenceApplication WITH WOT DRIVE CYCLE BY CHANGING THE GRADE AND WIND VELOCITY IN ENVIRONMENT BLOCK.
-
COMPARE SIMULATED RESULTS OF HYBRID AND PURE ELECTRIC POWERTRAINS BY KEEPING ALL THE PARAMETERS OF 3rd SAME.
ANSWERS:
1. MAPPED MODEL vs DYNAMIC MODEL:
|
MAPPED MODEL |
DYNAMIC MODEL |
|
|
Features |
Data was entered in the form of a Look-up | table (to be used in operation and | simulation) and after that, it would be set | up, and then an analysis would be done. | _________________________________ |
The model evaluates the behaviour of the parts/components before acting appropriately. Provides a complete analysis of the user-entered modifications in the Specifications, as well as simulations based on real-world and dynamic operations. _______________________________ |
|
Effect on Motor |
Specifications like engine rpm, efficiency, heat are entered for the simulation result. ______________________________ |
Actual outcomes would be taken into account, and conclusions would be drawn. ___________________________ |
|
Effect on Engine |
- A variety of data interpreted from the system can be used to mimic performance. Implementation: - - The model uses Steady-state look-up tables to characterize engine performance. -The tables provide overall engine characteristics including actual torque, fuel flow rate, BSFC and engine-out exhaust emission. When to use: - - If you have engine data from a dynometer or a design tool like GT-POWER. - For quasi-steady-state engine simulation. ______________________________ |
- The performance of the vehicle chosen for simulation will be simulated according to its original/real specifications. Implementation: - - Model decomposes the engine behaviour into engine characteristics that are separated into lower-level components. - By combining models in this way, the models capture the dynamic effects. When to use: - - If you need a more detailed dynamic model and have component-level data. - To analyze the impact of individual engine components on the overall performance. ______________________________ |
|
Effect on Generator |
For simulation Battery's torque and current, Motor torque etc. are entered into the specifications. ______________________________ |
All specs and information will be based on the current and dynamic conditions. ______________________________ |
|
Advantage |
Simulation is easy when the look-up table or the specifications are available. It gives results based on the data interpreted, which is also known as the Global Based Model. ______________________________ |
Operate in a dynamic manner based on the current state of the operation. There is no need for comprehensive data or requirements, and the simulation provides a complete analysis of the simulated components, also known as a Real-time Based Model. ______________________________ |
|
Disadvantage |
More data has to be collected and assumptions might also have to be taken into account. ______________________________ |
Simulations cannot be done as per customized specifications. ______________________________ |
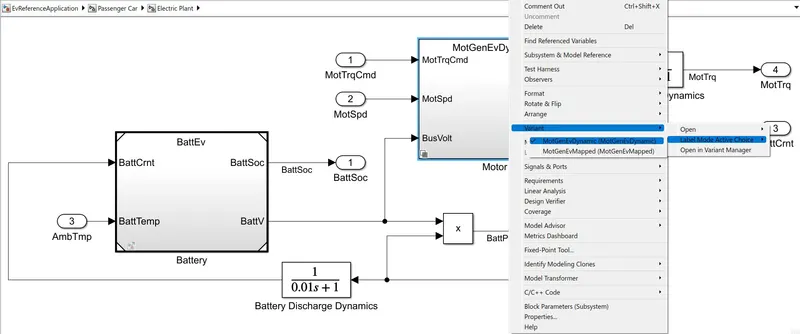
Now, in order to change the motor-generator type from MAPPED to DYNAMIC, we follow these steps-
-
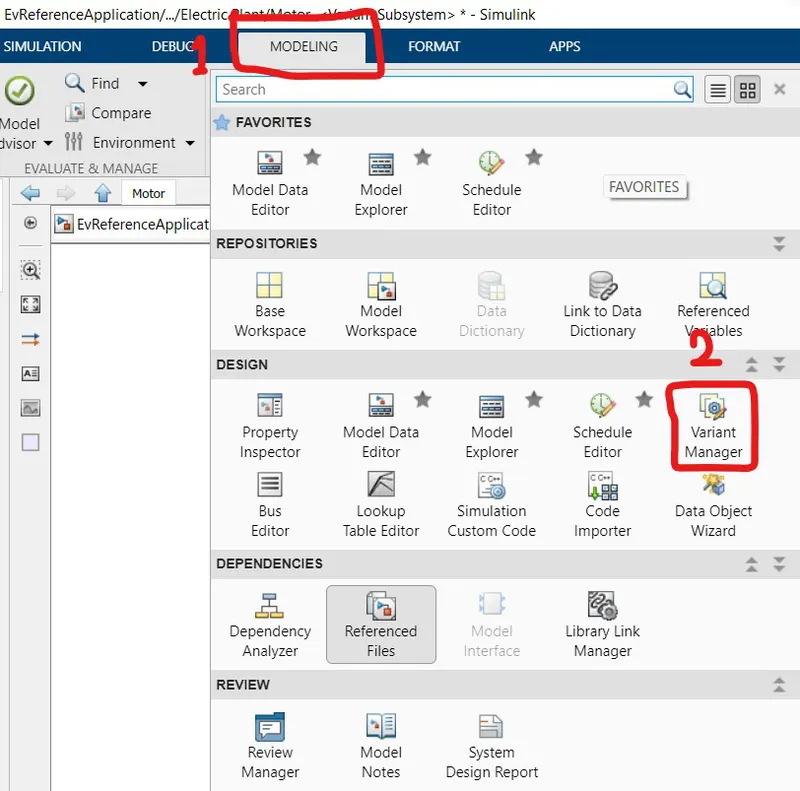
Select VARIANT MANAGER from the MODELING tab.
-
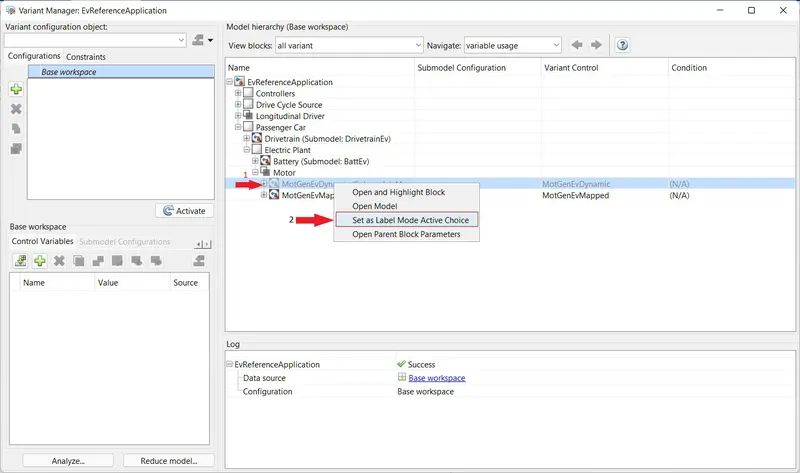
Right-click on MotGenDynamic and then select Set As Label Mode Active Choice.
-
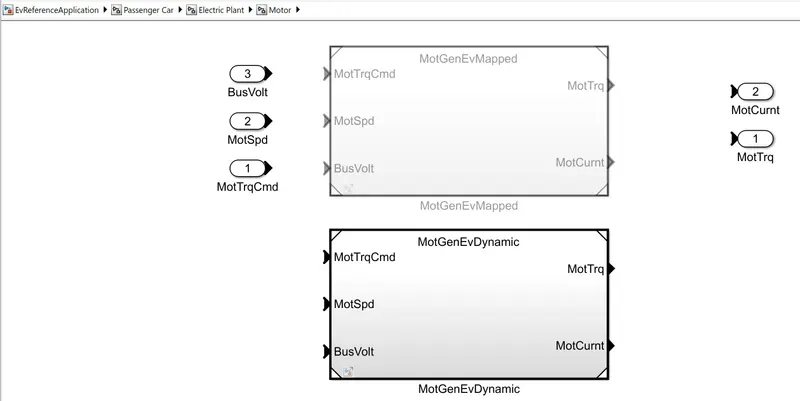
Double click on the MotGenDynamic.
By following these steps, our motor model is now changed to Dynamic type from Mapped type.
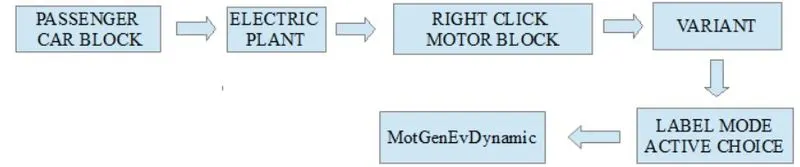
Or we can directly change the motor type by:
2. Fuel Economy calculations (Miles per Gallon):
MPG stands for Miles per gallon and is used to show how far your car can travel for every gallon (or 4.55 L) of fuel it uses. For example, if you own a car that returns 50mpg and its fuel tank has one gallon of petrol/diesel in it, you'll drive 50 miles before the car runs out of fuel. The higher a car's MPG, the more fuel-efficient it is.
In the U.S., the U.S. Environmental Protection Agency, or the EPA, is the government agency responsible for certifying a vehicle's MPG figures. The EPA gives each vehicle 3 different ratings, as
-
Highway MPG: the average a car will get while driving on an open stretch of road without stopping or starting, typically at a higher speed.
-
City MPG: the score a car will get on average in city conditions, with stopping and starting at lower speeds.
-
Combined MPG: a combined average of highway and city MPG.
But in the case of HEVs, it is calculated via Miles per Gallon Equivalent (MPGE). It's to compare the energy consumption of alternative fuel vehicles, PHEVs and other advanced tech vehicles with the energy consumption of conventional IC engine vehicles. It's found that 33.7 kWh of electricity consumed by the HEVs or PHEVs is equivalent to one gallon of gas consumed by conventional IC engine vehicles.
Now, the factors that affect the fuel economy are:
-
Vehicle speed (VehSpd)
-
Fuel (VolFlw)
-
Battery (BattPwr)
Simulink block that calculates the Vehicle Performance (fuel efficiency)
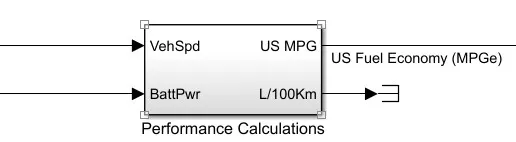
Block diagram for how the fuel efficiency is calculated is
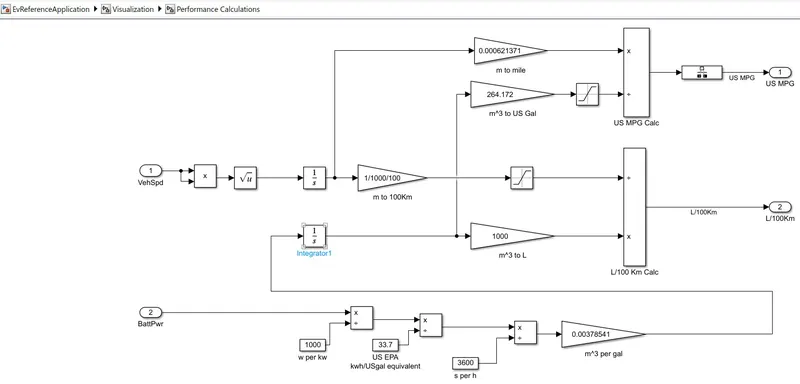
We can observe in the Simulink block diagram that 1st velocity is converted into the distance and as the hybrid vehicle has 2 fuel cells, the total fuel consumed is calculated and then the total distance travelled is divided by the total fuel consumed.
Steps:
-
Vehicle speed converted to miles from m/s by multiplying 0.000621371
-
A kilogram of fuel is converted to m3 by multiplying 1/ (1000 * 0.739)
-
The above value is converted to gallons by multiplying it with 264.172
-
The values of mile & gallon are used to find the MPG of the vehicle.
-
The battery value is converted to kWh by dividing it by 1000, then to gallon by again dividing it by 33.7.
-
The above result is then divided by 3600 to get the result per second and then multiplied by 0.00378541 to get the value in m3 / gallon.
3. HEV W.O.T. Drive cycle:
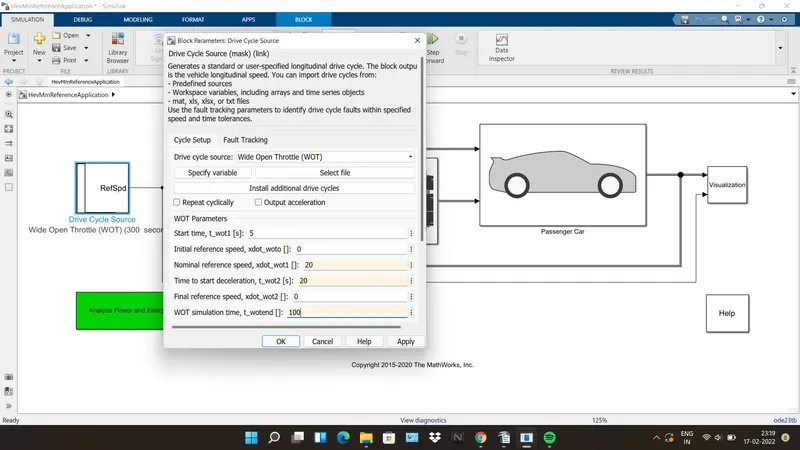
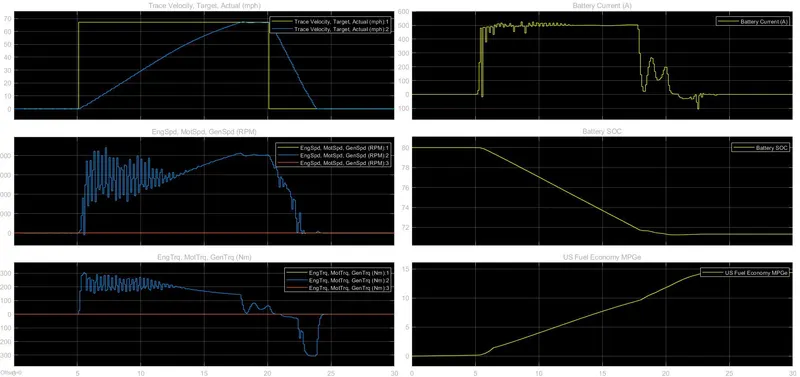
Type "autoblkHevStart" in the command window and hit enter. It'll open an HEV reference simulation model. Then, double click the Drive Cycle Source blockset and change the Drive Cycle Source to Wide Open Throttle (WOT).
For observation, we enter 10 different values of inputs for Reference Speed, Deceleration time, and WOT simulation time.
-
Reference Speed = 30
Deceleration time = 20
WOT Simulation time = 30
Grade = 1
Wind Speed = 0
-
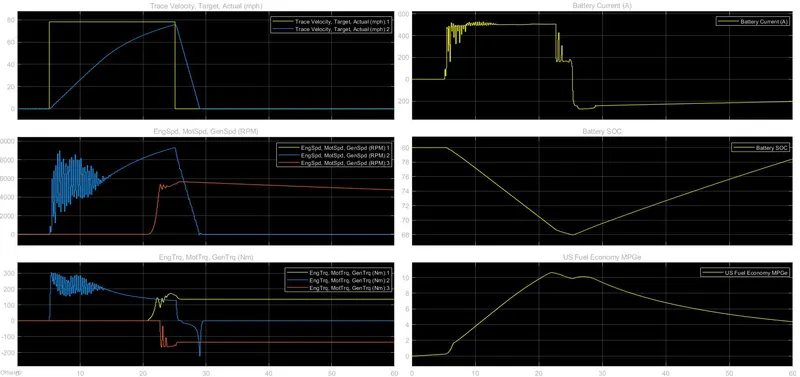
Reference Speed = 35
Deceleration time = 25
WOT Simulation time = 60
Grade = 3
Wind Speed = 5
-
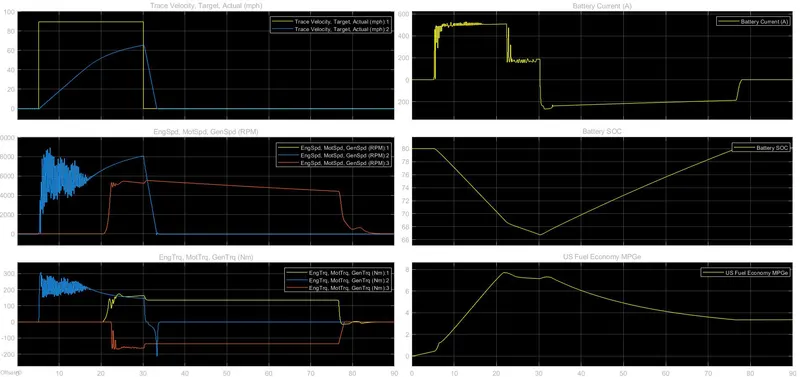
Reference Speed = 40
Deceleration time = 30
WOT Simulation time = 90
Grade = 7
Wind Speed = 10
-
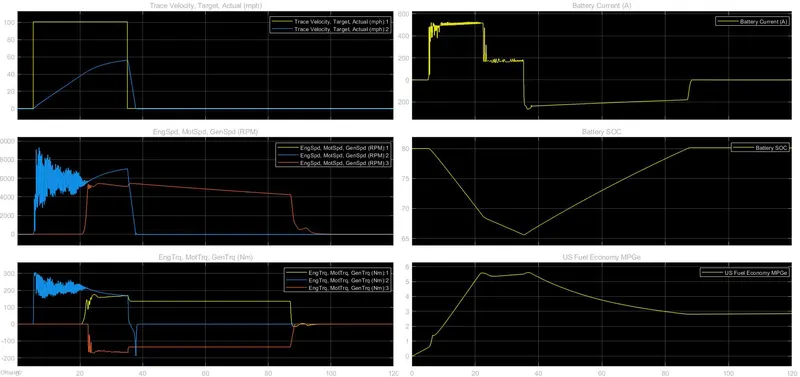
Reference Speed = 45
Deceleration time = 35
WOT Simulation time = 120
Grade = 10
Wind Speed = 15
-
Reference Speed = 50
Deceleration time = 40
WOT Simulation time = 150
Grade = 17
Wind Speed = 20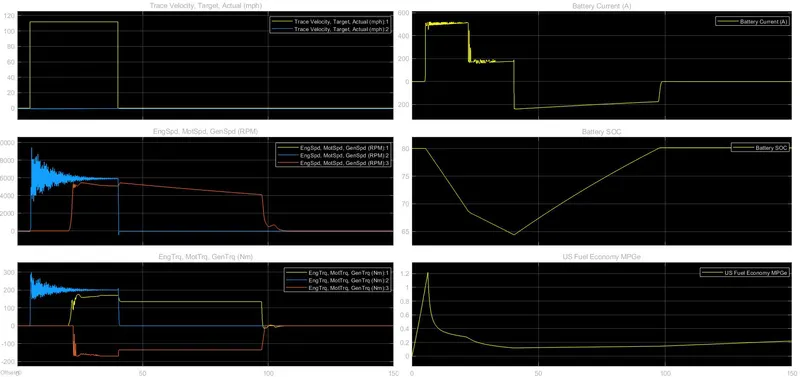
From the above graphs, we can observe that -
-
Trace Velocity, Target and Actual:
-
The actual velocity decreases as the gradeability and wind speed increase. If the target velocity is met or not matched by the actual vehicle velocity, it indicates that the HEV lacks adequate power to attain the required speed.
-
-
EngSpd, MotSpd, GenSpd (RPM):
-
It can be observed that the Engine speed (red line --------) is 0 rpm for 20 seconds and then starts at 20.5 seconds and goes up to a maximum of nearly 4800 rpm. For the 1st 20 seconds, battery power is used for Engine Speed.
-
The Motor speed (blue line -------) is much higher throughout the cycle and goes up to a maximum of 9500 rpm.
-
The Generator speed (yellow line -------) traces the same path as the Engine speed, which means that when the engine is working, the generator is also working.
-
-
EngTrq, MotTrq, GenTeq (Nm):
-
From the 3rd plot, it can be observed that initially, the Engine and the Generator doesn't produce any torque. But the maximum torque is produced by the Motor (~300 Nm). And the generator is working in synchronization with the engine.
-
-
Battery Current:
-
Only the motor is supplying the torque necessary to accomplish the desired speed, therefore the current rises until it reaches 25 seconds. We can notice a decrease in current consumption as soon as the engine starts, but the current is not equal to zero because the motor is still running. When the deceleration starts, the battery current becomes negative indicating regenerative braking.
-
-
Battery SOC:
-
The battery's state of charge (SOC) continues to deplete until regenerative braking begins. This raises the SOC. When the SOC falls below 67%, the generator kicks in to charge the battery. Since the motor is still running, the battery's state of charge (SOC) does not go to zero.
-
-
US Fuel Economy MPGe:
-
As the gradeability and wind speed rise, the vehicle's Fuel Economy (MPGe) falls. It is greatest when the gradient and wind speed are very low, and it is greatest when the grade and wind speed values are maximum.
-
4. HEV vs Pure Electric Powertrain:
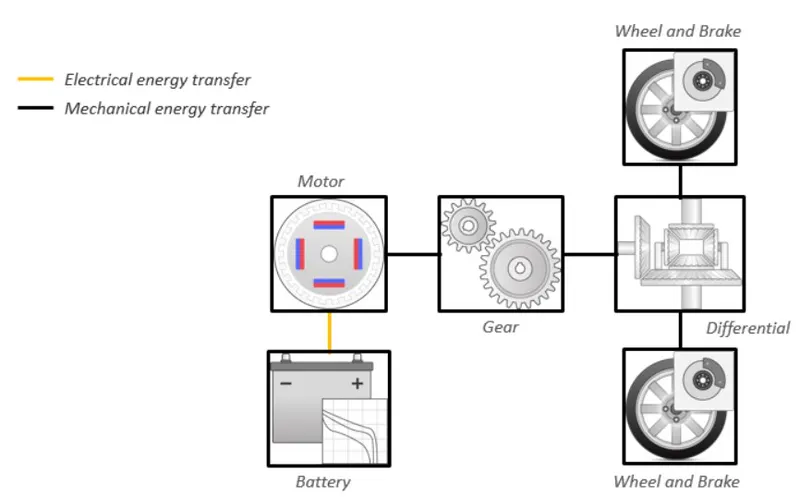
The electric vehicle reference application is configured with a mapped motor and battery. This diagram shows the powertrain configuration.
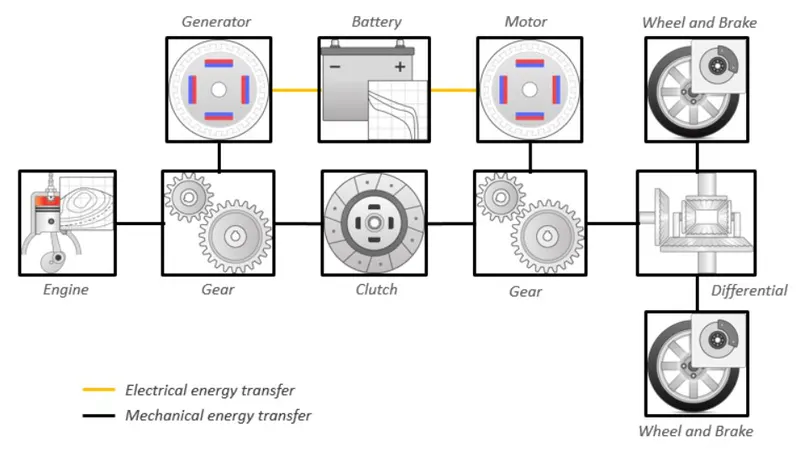
Whereas, the HEV is a multi-mode reference application configured with:
-
Mapped motor and generator
-
1.5 L spark-ignition (SI) dynamic engine.
This diagram shows the powertrain configuration.
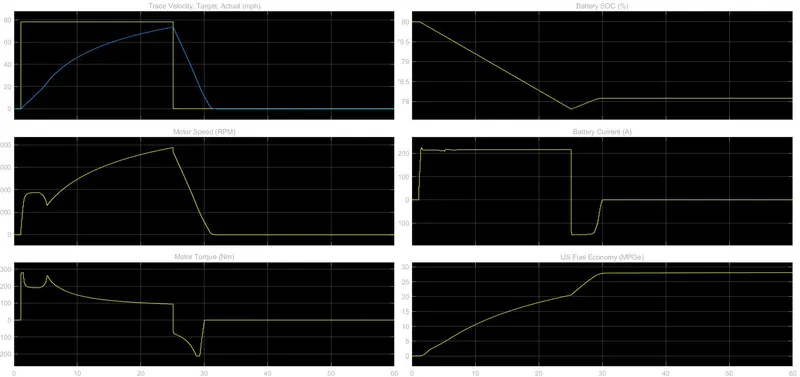
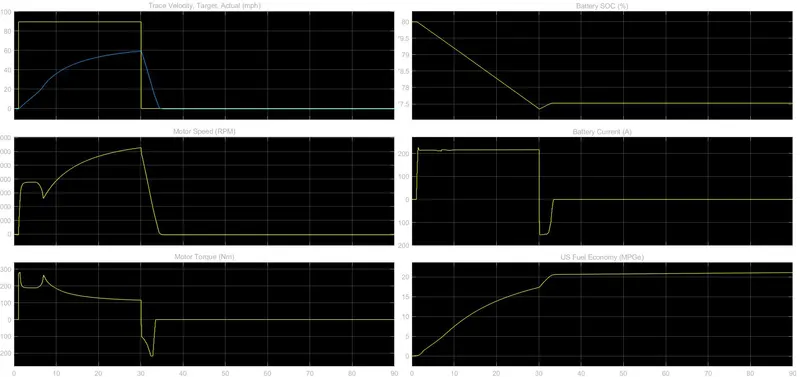
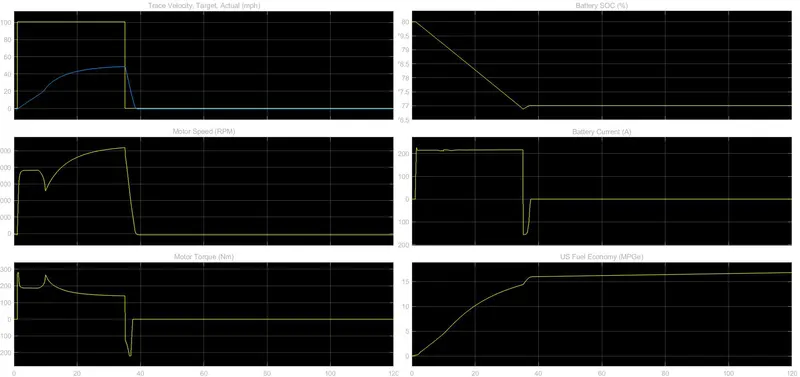
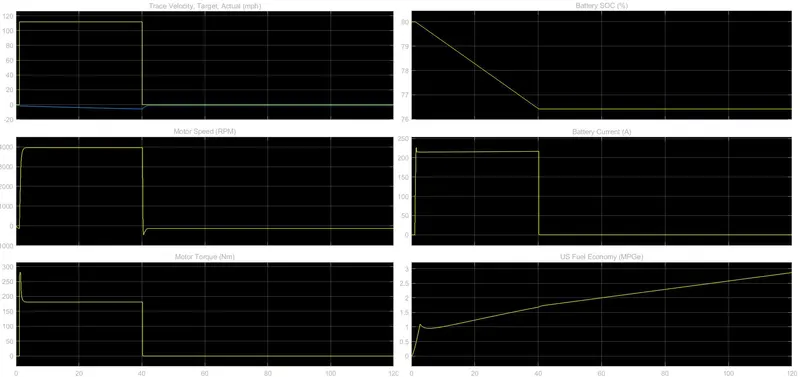
Now, simulating the EV with WOT drive cycle and comparing it with WOT drive cycle of HEV,
-
Reference Speed = 30
Deceleration time = 20
WOT Simulation time = 30
Grade = 1
Wind Speed = 0
EV
HEV
2. Reference Speed = 35
Deceleration time = 25
WOT Simulation time = 60
Grade = 3
Wind Speed = 5
EV
HEV
3. Reference Speed = 40
Deceleration time = 30
WOT Simulation time = 90
Grade = 7
Wind Speed = 10
EV
HEV
4. Reference Speed = 45
Deceleration time = 35
WOT Simulation time = 120
Grade = 10
Wind Speed = 15
EV
HEV
5. Reference Speed = 50
Deceleration time = 40
WOT Simulation time = 150
Grade = 17
Wind Speed = 20
EV
HEV
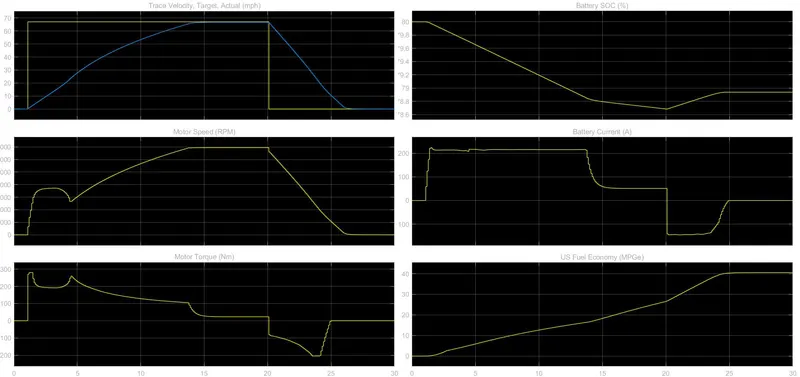
From the above comparison of graphs, it can be observed that:
-
Trace Velocity, Target and Actual:
-
By comparing both, i.e., EV and HEV, it can be said that since the only motor is operating in both cases, that's why their performance is almost identical. But in the end, EV's actual speed becomes 0 as it's very difficult for it to overcome the gradeability and the wind speed with the available amount of power.
-
-
EngSpd, MotSpd, GenSpd (RPM):
-
The Motor speed (yellow line -------) is much higher throughout the cycle and goes up to a maximum of ~7000 rpm.
-
-
EngTrq, MotTrq, GenTeq (Nm):
-
The torque produced by EV's motor is quite stable as compared to HEV's torque production from engine and motor.
-
-
Battery Current:
-
The current drawn by the HEV from its battery is up to 500 A whereas the EV draws 200 A of current from its battery. It's because, in HEV, the motor utilizes all the load during the initial conditions, and then the engine kicks in thus reducing the current drawing by the motor.
-
During the regenerative braking (or deceleration), negative current flows for a longer duration in HEV as compared to EV. So, it can be concluded that regenerative braking is more aggressive in HEV than EV.
-
-
Battery SOC:
-
In HEV, the battery's state of charge (SOC) continues to deplete until regenerative braking begins. This raises the SOC. When the SOC falls below 67%, the generator kicks in to charge the battery. Since the motor is still running, the battery's state of charge (SOC) does not go to zero.
-
In EV, the battery's SOC drops to 78% but is not able to get recharged to its original capacity. Once the battery's power is consumed, it needs to be recharged by a power adapter.
-
-
US Fuel Economy MPGe:
-
The fuel economy of EVs is significantly better than that of HEV. This is because the electric motor is more efficient than the engine.
-