Project 1 - Parsing NASA thermodynamic data
OBJECTIVE:
- Write a function that extracts the 14 coefficients and calculates the Enthalpy, Entropy, and Specific Heats for all the species in the data file.
- Calculate the Molecular Weight of each species and display it.
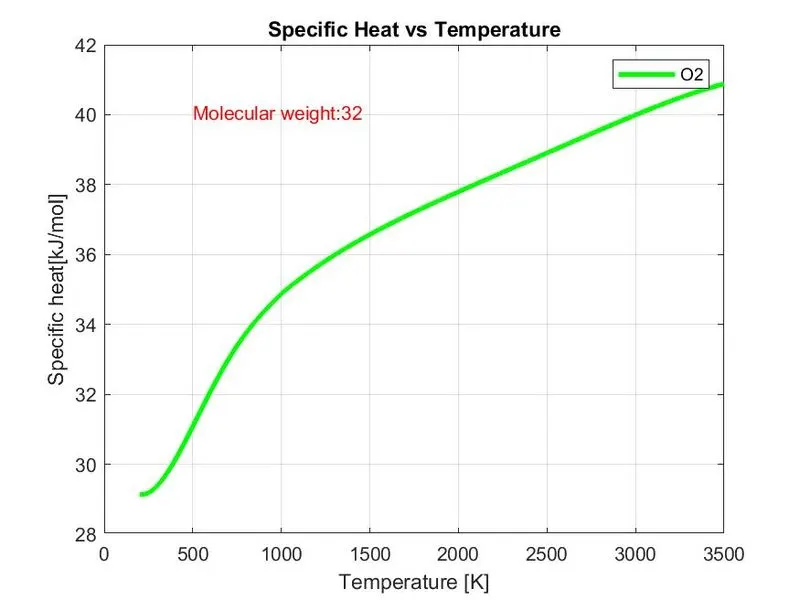
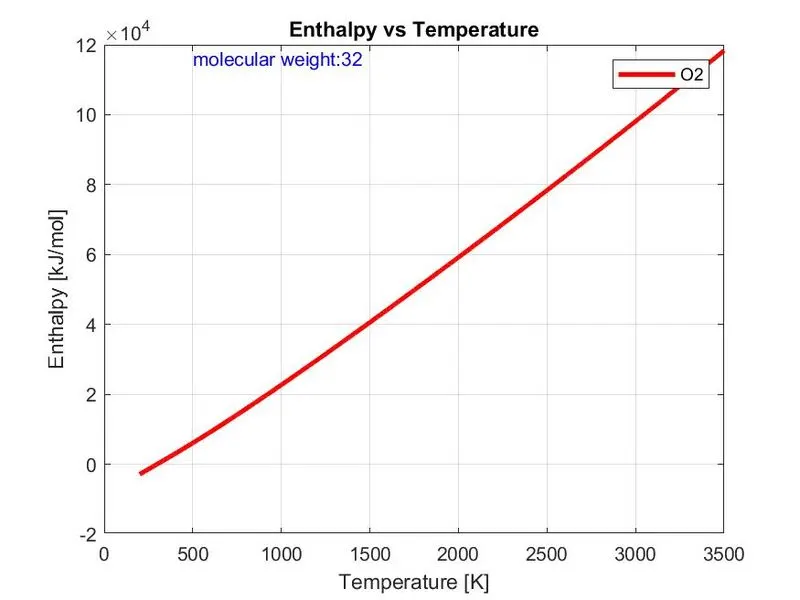
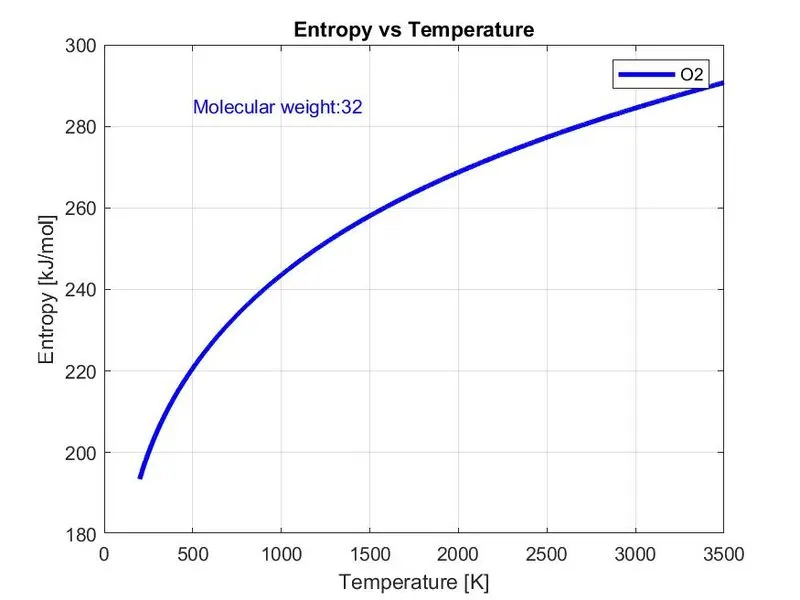
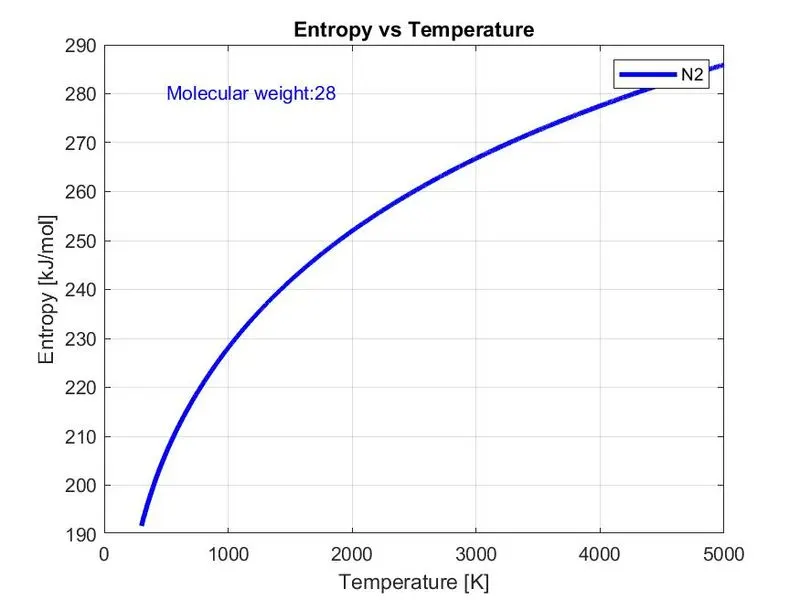
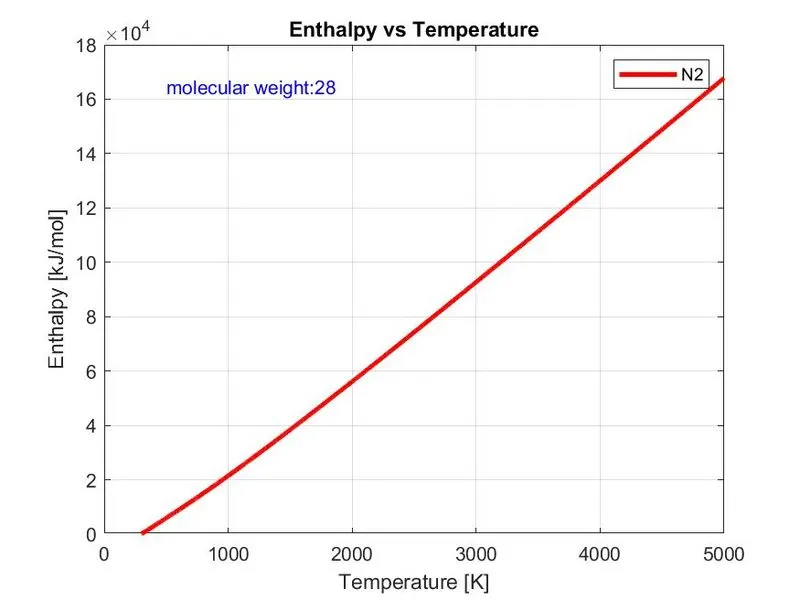
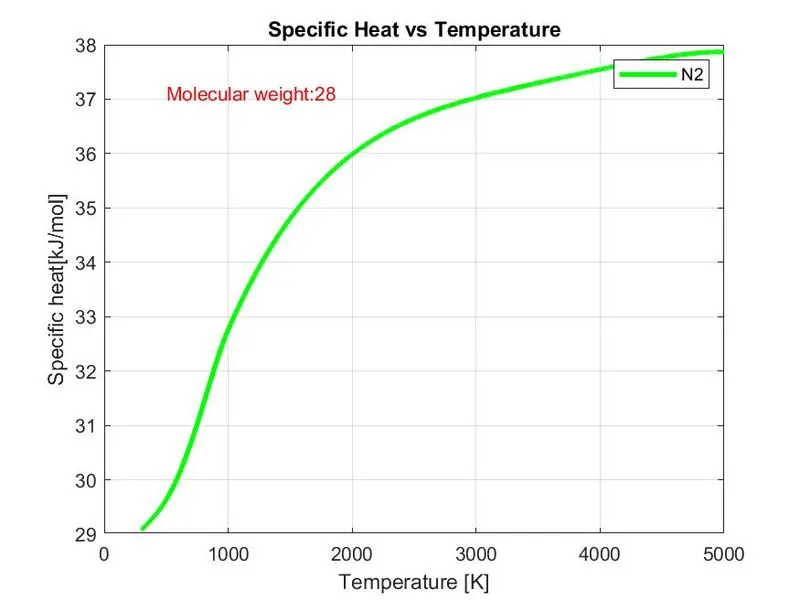
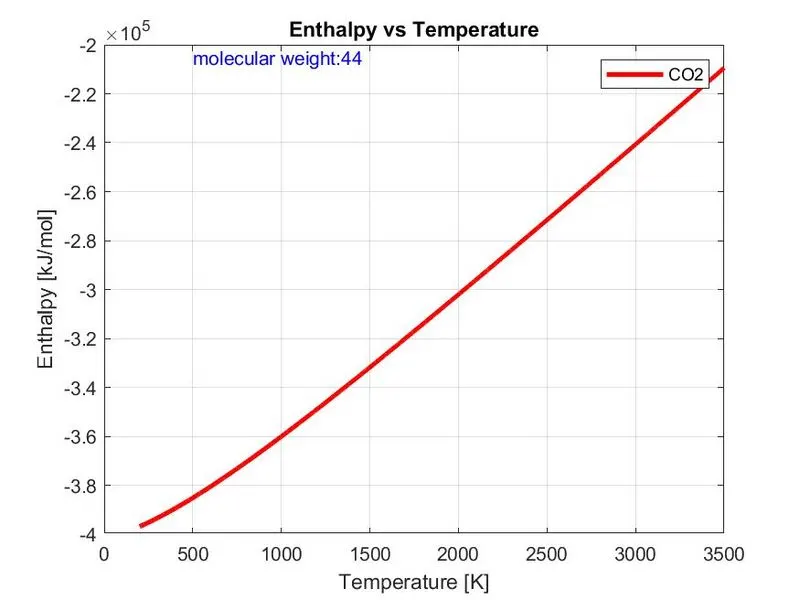
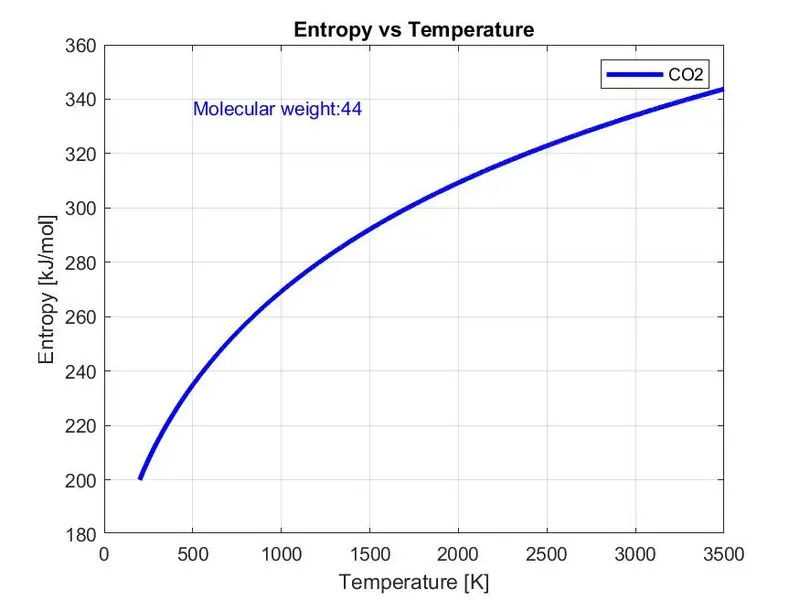
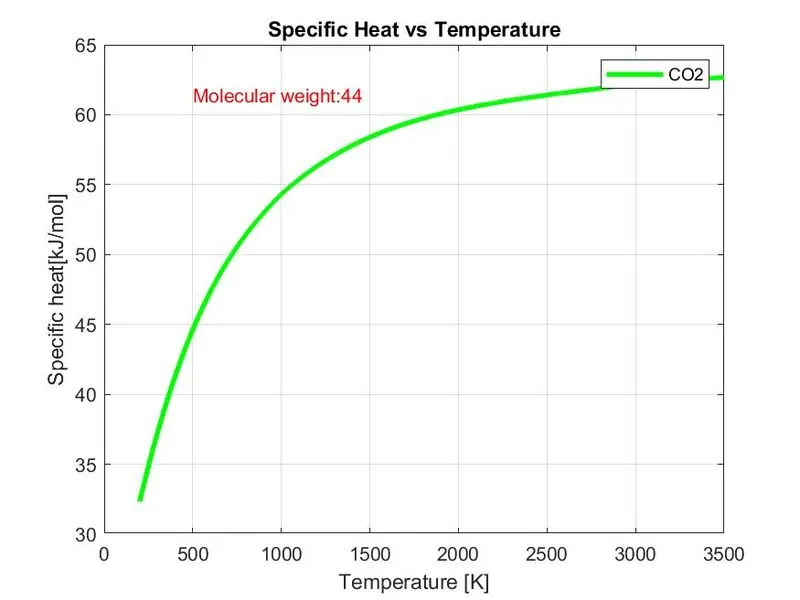
- Plot the Specific Heat, Enthalpy, and Entropy for the local temperature range (Low-Temperature: High Temperature) specific for each species.
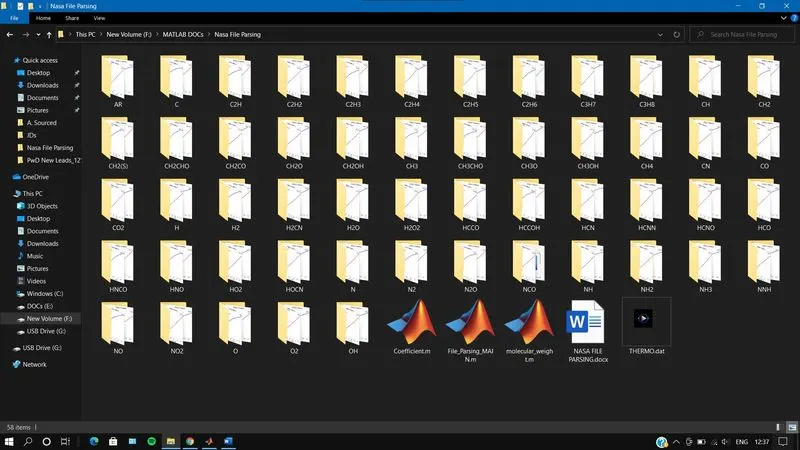
- Save the plots as images with appropriate names and dump them in a separate folder for each species with a suitable name. All these should be generated automatically.
- The main program should just take the “THERMO.dat” file as input and generate Cp, H & S plots.
THEORY:
Parsing is the process of reading/writing to a file (typically a text file) and extracting information from it. It is the method of evaluating a text made up of tokens to evaluate its grammatical structure in relation to a given grammar, which may be more or less formal. Parsing a file means reading in a data stream of some sort and then building an in-memory model of the semantic content of that data. All of this is required to translate the data in the file for whatever reason. Since the raw data in the file is unformatted and disorganized, it can initially be difficult to interpret or comprehend. We can break the sequence of characters in the data into smaller sections by conducting sorting, based on certain rules we make.
In this project, we’ll parse NASA’s thermodynamic data which has a coefficient of the polynomial to calculate Specific Heat, Entropy, and Enthalpy. There are 14 polynomial coefficients for every 53 species. These polynomials will be used in the formula written below for global and local temperature.
- Specific heat: The specific heat of a material is the measure of the amount of energy (in kJ) required to raise the temperature of 1kg of material by 1K.
`(Cp)/R=a1+a2T+a3T^2+a4T^3+ a5T^4`
2. Enthalpy: Enthalpy of a material is the sum of its internal energy plus the product of the measure of the pressure and volume of the thermodynamic system. It reflects the material’s capacity to do non-mechanical work and its capacity to release heat. It’s essentially the amount of heat transfer that occurs at a constant pressure.
`H/(RT)=a1+a2T/2+(a3T^2)/3+(a4T^3)/4+(a5T^4)/5+a6/T`
3. Entropy: Entropy is the measure of uncertainty or randomness and tells us in a numerical form, how much disorder there is in a thermodynamic system. This is useful for us because the measures how likely a chemical reaction is to take place. By definition, it’s the number of possible arrangements that atoms of a system can take. The greater the number of arrangements, the greater the Entropy.
`S/R=a1 lnT+a2T+(a3T^2)/2+(a4T^3)/3+(a5T^4)/4+a7`
Where :
a1 – a7 = Low or High-temperature coefficients that depend on what temperature level is used to calculate the Cp, H & S.
R = 8.314 J/mol K, Universal Gas Constant
T = Temperature in K
Cp = Specific Heat [J/Kg K]
H = Enthalpy [J]
S = Entropy [J/K]
MAIN CODE:
%% Code for Parsing NASA's thermodynamic file data
clear all
close all
clc

%% Opening the the THERMO.dat file
File_Data = fopen('THERMO.dat', 'r');       % Opening and reading the thermodynamic file

% Skip the first line of the file
fgetl(File_Data);

%% Reading the temperature values distinguished as Local, Average and High Temperatures
line = fgetl (File_Data);
a = strsplit (line,' ');
Global_Low_Temperature = str2double (a {2});
Global_Average_Temperature = str2double (a {3});
Global_High_Temperature = str2double (a {4});

% Skipping the next 3 lines
fgetl (File_Data);
fgetl (File_Data);
fgetl (File_Data);

%% Extracting data for each gas
for k=1:53      % Reading the data of all the 53 species

    line = fgetl (File_Data);
    a = strsplit (line,' ');
    Gas_Species = a (1);
    b = strfind (line,'.');
    Local_Low_Temperature = str2double (line (b(1) - 4 : b(1) + 4));
    Local_High_Temperature = str2double (line (b(2) - 4 : b(2) + 4));
    Local_Average_Temperature = str2double (line (b(3) - 4 : b(3) + 4));

    % Extracting all 14 coefficients
    count = 1;
    for j = 1 : 3
        line = fgetl (File_Data);
        b = strfind (line, 'E');
        for i = 1 : length (b)
            if count <= 7
                High_Temp_Coeff (count) = str2double (line (b(i) - 11 : b(i) + 3));
                count = count + 1;
            else
                Low_Temp_Coeff (count - 7) = str2double (line (b(i) - 11 : b(i) + 3));
              count = count + 1;

            end
        end
    end

    % Initializing specific heat,entropy and enthalpy values to zero
    Cp = 0;
    H = 0;
    S = 0;

    % Calling the function where cp,H and S are calculated
    [Cp, H, S] = Coefficient(Local_Low_Temperature, Local_Average_Temperature, Local_High_Temperature, Low_Temp_Coeff, High_Temp_Coeff);

    % Molecular weight calculating function
    M = molecular_weight(Gas_Species);

    % Plotting
    GAS_SPECIES = char (Gas_Species);
    Temperature = Local_Low_Temperature : Local_High_Temperature;
    current = pwd;
    mkdir (GAS_SPECIES);
    cd (GAS_SPECIES);

    figure (1);
    plot (Temperature, Cp, 'color', 'g', 'linewidth', 2.5);
    legend (Gas_Species);
    TXT1 = ['Molecular weight:' num2str(M)];
    text (500, max(Cp)*0.98, TXT1, 'color', 'r');
    grid on
    xlabel ('Temperature [K]');
    ylabel ('Specific heat[kJ/mol]');
    title ('Specific Heat vs Temperature');

    figure (2);
    plot (Temperature, H, 'color', 'r', 'linewidth', 2.5);
    legend (Gas_Species);
    TXT1 = ['molecular weight:' num2str(M)];
    text (500, max(H)*0.98, TXT1, 'color', 'b');
    grid on
    xlabel ('Temperature [K]');
    ylabel('Enthalpy [kJ/mol]');
    title ('Enthalpy vs Temperature');

    figure (3);
    plot (Temperature, S, 'color', 'b', 'linewidth', 2.5);
    legend (Gas_Species);
    TXT1 = ['Molecular weight:' num2str(M)];
    text (500, max(S)*0.98, TXT1, 'color', 'b');
    grid on
    xlabel ('Temperature [K]');
    ylabel ('Entropy [kJ/mol]');
    title ('Entropy vs Temperature');

    saveas (figure (1), 'Specific Heat.jpg');
    saveas (figure (2), 'Enthalpy.jpg');
    saveas (figure (3), 'Entropy.jpg');

   cd (current);
end
Code Explanation:
- Opening the thermodynamic file using the command FOPEN and reading it using the ‘r’, read mode, and storing it in a variable named FILE_DATA.
- Using the command FGETL, the header is read. If we use it again it’ll read a new line.
- Reading the next line again with FGETL. This string line has temperature values. So to convert them into numbers we use STR2DOUBLE.
- Storing the temperature values in Global Low Temperature, Global Average Temperature, and Global High Temperature.
- Now, we skip the next 3 lines using FGETL, as they don’t have the necessary value or data.
- Using FOR LOOP, we’ll extract data for all the 53 gas species.
- We split the line by identifying/searching the space between the coefficients. After that searching the dot ( . ).
- Using proper indexing, we store the values in variables Local Low Temperature, Local Average Temperature, and Local High Temperature by converting them from string to double using STR2DOUBLE.
- For extracting all the 14 coefficients of the species, we search for the letter ‘E’ using STRFIND.
- Using a counter, we store the values of the coefficients, with counter less or equal to 7, in a variable named as HIGH-TEMPERATURE COEFFICIENT and counter having the count more than 7, then it is saved in the variable named as LOW-TEMPERATURE COEFFICIENT using proper indexing.
- Initializing Cp, H & S to zero and calling the function COEFFICIENT to calculate the SPECIFIC HEAT, ENTHALPY & ENTROPY.
- Using MKDIR, we create a directory of gas species names to save the plots.
- Plotting graphs of TEMPERATURE vs Cp, TEMPERATURE vs H & TEMPERATURE vs S, and displaying the molecular weight of the gas species on the graph itself by converting the number to string using NUM2STR command.
- Saving the plots generated in the directory by the name of SPECIFIC HEAT.JPG, ENTHALPY.JPG & ENTROPY.JPG.
FUNCTION CODE - 1:
%% Function to calculate the Specific Heat Cp, Enthalpy H, Entropy S.

function [Cp, H, S] = Coefficient (Local_Low_Temperature, Local_Average_Temperature, Local_High_Temperature, LOW_TEMP_COEFF, HIGH_TEMP_COEFF)

    for i = 1 : Local_High_Temperature - Local_Low_Temperature + 1

        R = 8.314;      % Universal Gas Constant

        Temperature = i + Local_Low_Temperature - 1;

        % For lower temperature values

        if Temperature <= Local_Average_Temperature
             Cp (i) = R*(LOW_TEMP_COEFF (1) +LOW_TEMP_COEFF (2)*Temperature + LOW_TEMP_COEFF (3)*Temperature^2 + LOW_TEMP_COEFF (4)*Temperature^3 + LOW_TEMP_COEFF (5)*Temperature^4);

             H (i) = R*Temperature*(LOW_TEMP_COEFF (1) + (LOW_TEMP_COEFF (2)*Temperature)/2 + (LOW_TEMP_COEFF (3)*Temperature^2)/3 + (LOW_TEMP_COEFF (4)*Temperature^3)/4 + (LOW_TEMP_COEFF (5)*Temperature^4)/5 + LOW_TEMP_COEFF (6)/Temperature);

             S (i) = R*(LOW_TEMP_COEFF (1)*log (Temperature) + (LOW_TEMP_COEFF (2)*Temperature) + ((LOW_TEMP_COEFF (3)*Temperature^2)/2) + ((LOW_TEMP_COEFF (4)*Temperature^3)/3) + ((LOW_TEMP_COEFF (5)*Temperature^4)/4) + (LOW_TEMP_COEFF (7)));

        % For higher temperature values

        else
             Cp (i) = R*(HIGH_TEMP_COEFF (1) + HIGH_TEMP_COEFF (2)*Temperature + HIGH_TEMP_COEFF (3)*Temperature^2 + HIGH_TEMP_COEFF (4)*Temperature^3 + HIGH_TEMP_COEFF (5)*Temperature^4);

             H (i) = R*Temperature*(HIGH_TEMP_COEFF (1) + ((HIGH_TEMP_COEFF (2)*Temperature)/2) + (HIGH_TEMP_COEFF (3)*Temperature^2)/3 + (HIGH_TEMP_COEFF (4)*Temperature^3)/4 + (HIGH_TEMP_COEFF (5)*Temperature^4)/5 + (HIGH_TEMP_COEFF(6)/Temperature));

             S (i) = R*(HIGH_TEMP_COEFF (1)*log (Temperature) + (HIGH_TEMP_COEFF (2)*Temperature) + (HIGH_TEMP_COEFF (3)*Temperature^2)/2 + (HIGH_TEMP_COEFF (4)*Temperature^3)/3 + (HIGH_TEMP_COEFF (5)*Temperature^4)/4 + (HIGH_TEMP_COEFF (7)));

        end
    end
end
FUNCTION - 1 CODE EXPLANATION:
- We create a Function COEFFICIENT to calculate the Cp, H & S with parameters LOCAL LOW TEMPERATURE, LOCAL AVERAGE TEMPERATURE, LOCAL HIGH TEMPERATURE, LOW-TEMPERATURE COEFFICIENT.
- Using the FOR LOOP from 1 to LOCAL HIGH TEMPERATURE - LOCAL LOW TEMPERATURE + 1, initializing the universal gas constant R = 8.314, Temperature.
- For calculating the LOWER TEMPERATURE VALUES and HIGHER TEMPERATURE VALUES of CP, H & S, using IF-ELSE statement we calculate them using the formula
1. `(Cp)/R=a1+a2T+a3T^2+a4T^3+ a5T^4`
2. `H/(RT)=a1+a2T/2+(a3T^2)/3+(a4T^3)/4+(a5T^4)/5+a6/T`
3. `S/R=a1 lnT+a2T+(a3T^2)/2+(a4T^3)/3+(a5T^4)/4+a7`
FUNCTION CODE - 2:
%% Function to calculate molecular weight

function M = molecular_weight (Gas_Species)

molecular_weight = [1 12 14 16 32 0 40];
Gas_Species1 = ['H' 'C' 'N' 'O' 'S' 'A' 'R'];
number = [1 2 3 4];

M = 0;
GAS_SPECIES = char(Gas_Species);
for i = 1 : length (GAS_SPECIES)
    for j = 1 : length (Gas_Species1)
        if GAS_SPECIES (i) == Gas_Species1 (j)
            M (i) = molecular_weight (j);
        end
    for j = 1 : length (number)
        if str2double (GAS_SPECIES (i)) == number (j)
            M(i) = M(i - 1) * (number(j) - 1);
        end
    end
    end
end

M = sum (M);
end
FUNCTION – 2 CODE EXPLANATION:
- We create a function MOLECULAR_WEIGHT with function parameter GAS_SPECIES (name of the gas species) to calculate the molecular weight of all the gas species.
- Created an array of molecular weights and names of the gas species.
- Initialized the molecular weight (M) to 0.
- Using FOR LOOP calculated the molecular weight.
PLOTS:
i. PLOT OF O2
PLOT OF N2
iii. PLOT OF CO2
Screenshot of the folder where Gas Species directories are generated.
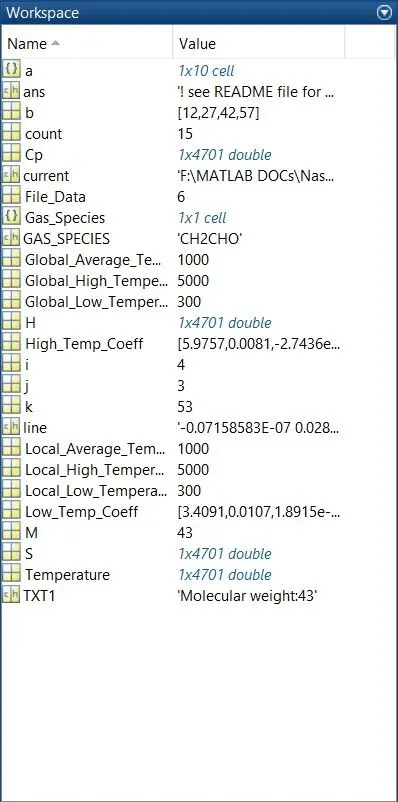
Window-shot of the workspace.
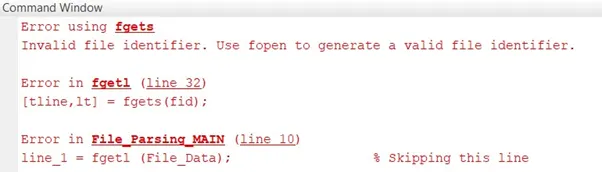
ERRORS:
This error occurs when the THERMO.dat file is NOT PRESENT in the same folder as the code. So to overcome this error, move the THERMO.dat file to the same folder where the code is also there.
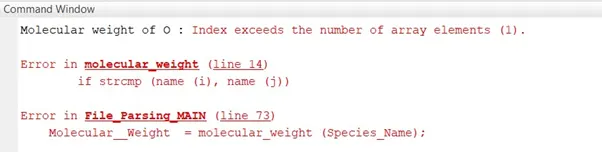
This error occurs when you’re trying to read more than the contents of the array. Like, suppose there are 4 elements in the array and we’re trying to read the 5th element, which is not there in the array. So, such kind errors will occur when reading the elements that are not present in the element.
CONCLUSION:
We extracted the data, calculated the Specific Heat, Enthalpy & Entropy of each individual gas species and plotted the graph between Temperature & Cp, Temperature & H, Temperature & S, and saved the obtained graphs in their respective directory that was created using the command MKDIR.