Week-4 Challenge WOT Condition Part-2
Study 1:-
Difference between Mapped and Dynamic Model of Engine , Motor and Generator
There are two types of engine,motor and generator models which is mapped and dynamic.
Mapped Engine:-
These models uses a steady-state lookup tables , the tables provide overall engine characteristics with actual torque,Fuel flow rate,Brake specific fuel consumption and engine-out exhaust emissions thus enabling in calculating the performance of the Engine.
when we have the engine data from the dynamometer or from a design tool and for quasi steady state simulation are when these model is used.
Dynamic Engine:-
These models uses behavior of the Engine as the engine characteristics that are separated into lower level components.
By combining the components in this way the dynamic effect is achieved by the model.
These are used when we need more dynamic model detail and we have component level data and to analyse the impact of indivudual component on the performance.
Changing Model Type:-
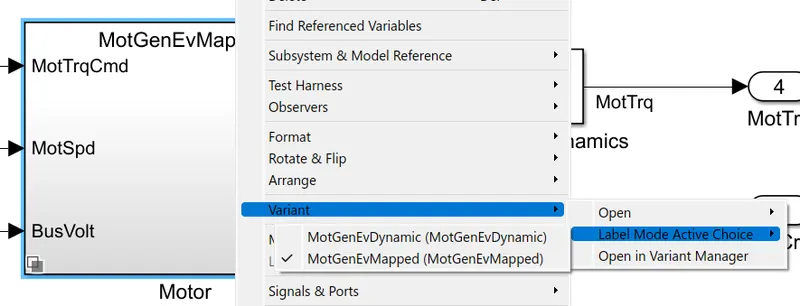
We can change model type by choosing the Motor block -motor varient present inside the EV model simulink passenger block.
Study 2:-
Calculation of Miles per Gallon as per Model:-
Performance Block:-
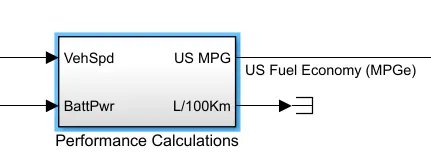
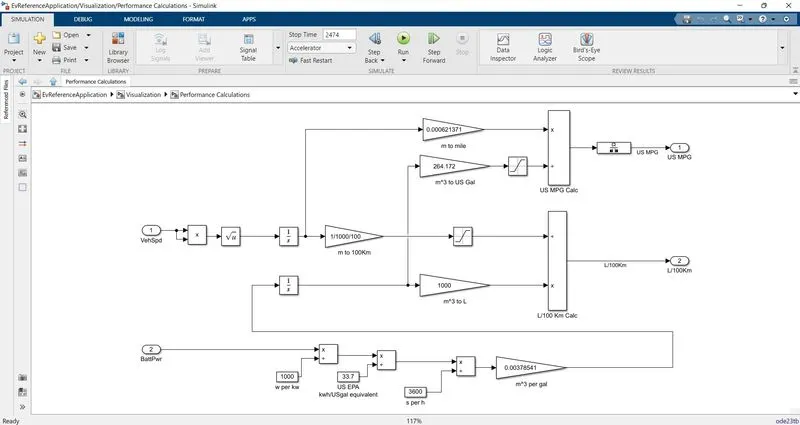
Description:-
1. The Input provided for performance calculation is Vehicle speed , Battery Power
2. The vehicle speed m/s is converted to distance in meter through multiplier,squareroot (to provide a positive value since speed is always positive) and an integrator block as per formula
Speed = Distance /Time , Thus by intergrating speed we get distance.
The distance in meter is converted to 100 km by using the Gain block as per convertion formula (1/1000/100).
3. The battery power input which is in watt is converted to kw by dividing 1000 and then converted to equivalent gallon by dividing 33.7 (since 1 gal = 33.7 kw) and then divided by 3600 for seconds convertion and a gain of 0.00378541 to get cubic meter per gallon.
4.Integrator block is used to get the cubic meter and there by a gain of 1000 is provided inorder to get the output in liters.
The value in liters and distance are converted to L/100km by using product block and provided as output.
5.The Integrated value from Vehicle Speed which is in meter is provided as an input to gain block 0.0006213171 for the convertion to miles and the integrated value as cubic meter is provided to gain block containing 264.172 as value inorder to convert cubic meter to US Gal.
6.The output of the gain value in miles and US Gal is provided to the product block to get an output of US MPG(US Miles per Gallon).
Study 3:-
HEV Reference Application with WOT Drive Cycle:-
Model:-
The Model used is HEV reference model.
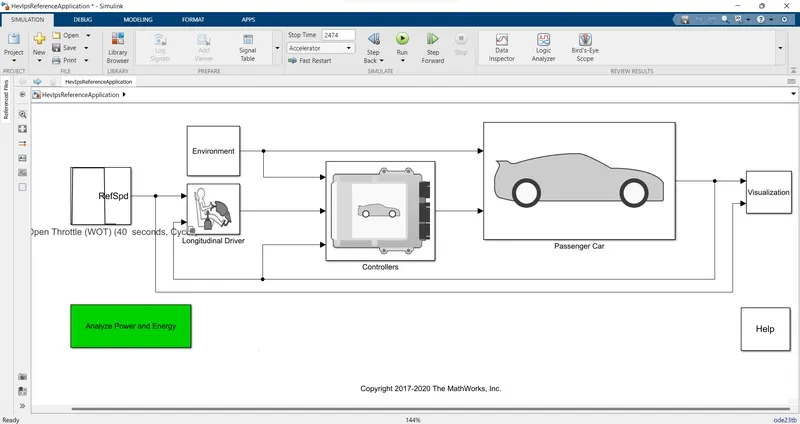
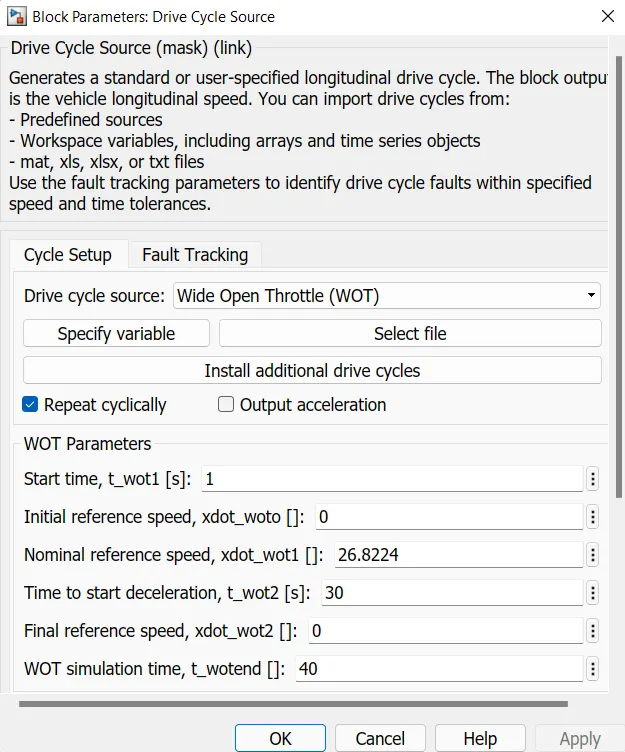
The Drive Cycle used is WOT (Wide Open Throttle , 40 seconds/cycle) and the grade and wind speed of the vehicle is varied inorder to observe the results. The parameter changed are as shown below.
Drive Cycle Parameter:-
Environmental Blockset:-
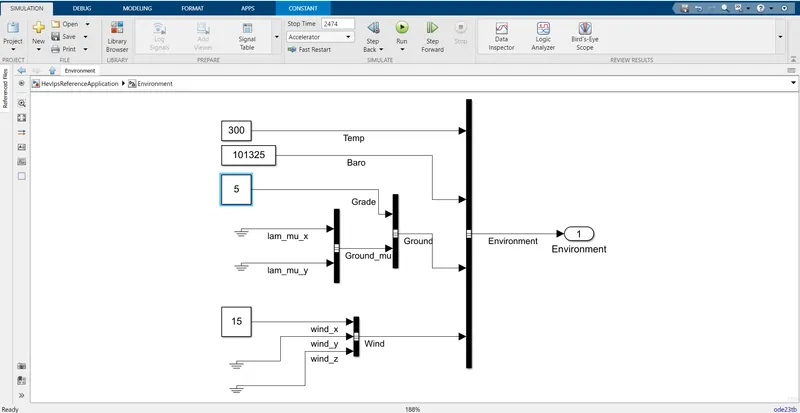
The grade and wind speed are 5 and 15 m/s respectively which is changed in below blockset.
Output:-
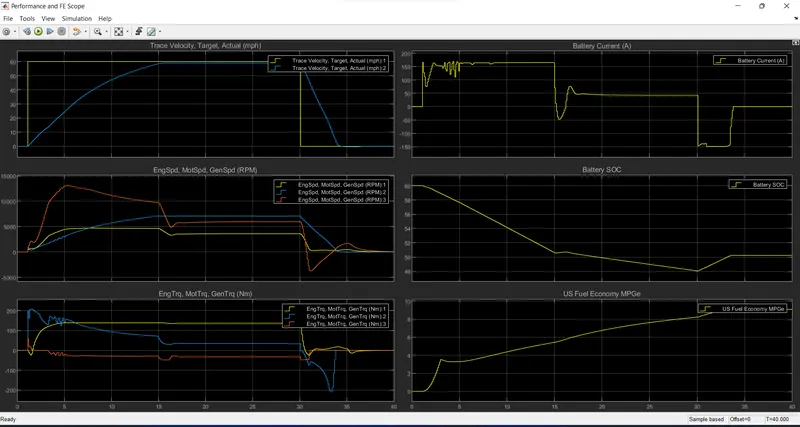
The Output Trace Velocity,Actual mph and target mph , Engine motor and generator speed (RPM) and Engine , motor and generator Torque , battery current,battery SOC and Fuel economy MPGe (Miles per Gallon equivalent) are seen.
Study 4:-
Comparing simulation results of hybrid and pure EV powertrain:-
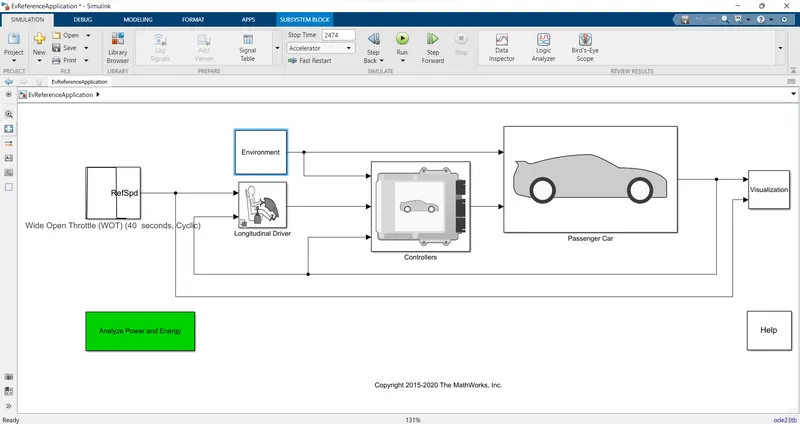
By keeping the parametrs same the simulation is taken place for both HEV and EV and the simulation results are compared
Model:
In both the Models the drive cycle is chosen is WOT and the grade is set to 5 and wind speed is set as 15 and the simulation is performed.
HEV Model:
EV Model:-
Simulation Results:-
Performance Output of HEV:-
Performance Output of EV:-
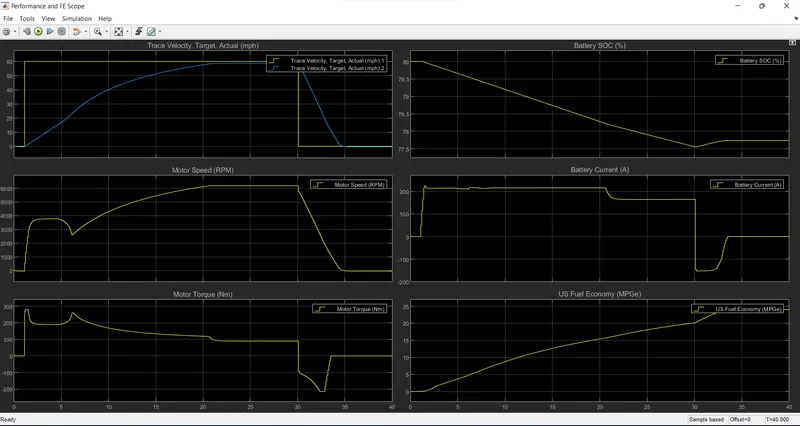
Result:-
On comparing both the simulation output
1.The top speed achived by HEV is higher than EV.
HEV - 58.852 mph
EV - 58.8348 mph
2.Peak Engine Motor Speed achived by HEV is higher than that of EV (Since HEV has both motor and Engine together it produces higher RPM).
HEV - 13074 RPM
EV - 6184 RPM
3.Maximum torque produced by HEV is 207 Nm is lower than the torque produced by the EV which is 280 Nm.
4.The Maximum current and state of charge of the battery in HEV is 169 A ,droped from 60% to 50.26% - drop of 9.84% respectively and in EV is 225 A , droped from 80% to 78% - drop of 2% respectively
Thus from the Battery Current and Battery SOC Plot it is seen that the capacity of the battery is higher in EV than that of HEV.
5.The US Fuel Economy plot the MPGe data the Fuel Economy achieved by HEV is 9.1365 MPGe whereas the fuel economy achieved by EV is 24.026 MPGe , thus EV is more fuel efficient than the HEV.