Comparison of HEV and PEV models from Powertrain Blockset and result analysis
AIM:
To study and compare HEV and PEV models from Powertrain Blockset and analyze the results.
OBJECTIVE:
- To differentiate between mapped and dynamic model of engine, motor and generator and learn switching the model variant.
- To study the calculation of miles per gallon of the model and understand the factors considered to model fuel flow.
- To Run the HEV Reference Application with WOT drive cycle and change the grade and wind velocity in the environment block.
- To compare the simulated results of hybrid and pure electric powertrains (Keeping all other parameters same).
SOLUTION:
- To differentiate between mapped and dynamic model of engine, motor and generator and learn switching the model variant.
Vehicle modelling can be done in two ways: Statically & Dynamically. The static approach is termed as the mapped approach. This method is faster and comparatively less detailed. It is generally implemented to estimate the power consumption. The lower simulation time is due to the use of Lookup Tables (explained below). On the other hand, the dynamic approach is relatively slower. It uses intrinsic models to model each component of the larger subsystem. The use of this type of model enables us to understand the component level performance and gives rather detailed results.
Lookup tables: Lookup tables are used to map output/s based on input given. The output data corresponding to input is linked using a data array defined in the lookup table. These can be n-dimensional. The relationship between the input and output is unknown. Lookup tables improve accuracy and reduces time required for simulation. Simulink can extract other data points that are not available by interpolation and extrapolation. It can be implemented by using the ‘Lookup Table’ Block.
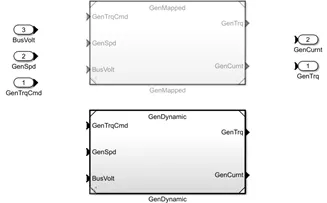
The HEV reference model gives the mapped and dynamic variants for the Engine, Motor and generator. The required variant can be chosen.
Engine Block (SI Engine):
The mapped variant of the engine is chosen by default. It implements a mapped spark-ignition (SI) engine model using power, air mass flow, fuel flow, exhaust temperature, efficiency, and emission performance lookup tables. The Lookup tables are functions of commanded torque, Tcmd, brake torque, Tbrake, and engine speed, N. The Mapped engine has two variants: With Input Temperature and Without Input Temperature. If Input engine temperature is specified, the former variant can be used. The Lookup tables can also be specified by the user.
The dynamic variant uses a SI Core Engine and cooling, pumping and exhaust systems are modelled independently and then connected as a whole to the engine. Due to the large no. of calculations involved and its complexity, the simulation time for this model will be greater.
Motor and Generator:
The mapped variant uses lookup tables for calculating power loss (2-D) and mechanical power (1-D) produced. The dynamic variant uses an Interior permanent magnet synchronous motor (PMSM) with controller and Voltage Source Inverter
To switch between the variants, the following method can be used:
- Select the subsystem which has to switched to the variant.
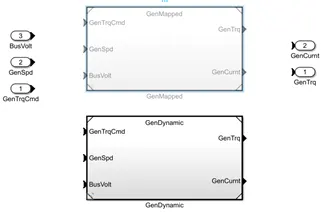
- Go to modelling pane and select model explorer. This will open a dialogue box, where ‘Label mode active choice’ (bottom left corner) will have a drop down menu. From this dropdown menu, select the variant(here: Gendynamic) that we want to use in the next simulation. Click apply

3. The variant will now be switched to the desired one.
- To study the calculation of miles per gallon of the model and understand the factors considered to model fuel flow.
The MPG calculation takes place in the Visualization Subsystem’s performance calculation block. The following are the elements used to calculate the Miles per hour and Liters of fuel per 100km distance calculations.
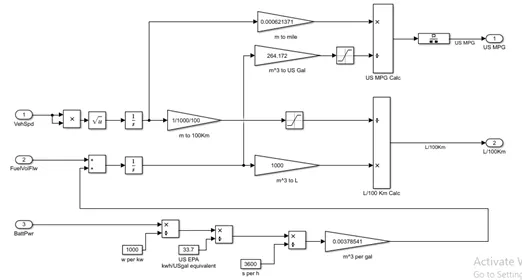
The HEV reference model has two sources for generating the power required for propulsion viz. the battery source and the SI/CI engine. Thus, while calculating the miles/gallon, both the sources of power have to be considered.
- The battery power is measured in W and thus it has to be converted into its gallon equivalent. For that purpose,
- Battery power is first converted from W to kW by dividing it by 1000
- To covert kW to its equivalent gallons per hour (US EPA), it is again divided by 33.7
- To convert from gallons/hour to Gallons/seconds, it is again divided by 3600(1hr = 3600sec).
- It is further multiplied by 0.0037 to convert it to the standard m3 (1gallon=0.0037L)
- Now the kW has been converted to its equivalent m3/sec
- The fuel flow (from engine) which is already in m3/sec is added to the battery equivalent fuel flow and integrated w.r.t. time in order to get the m3 of fuel volume. This is then converted to Liters.
- In order to get the distance travelled by the vehicle, the velocity output is taken into consideration. It is squared and then square root is taken to avoid negative values of velocities. This is then integrated to get then distance in meters. To calculate L/100km, this distance is converted to km by dividing by 1000 and then by 100 to get the /100km factor. To calculate MPG, the distance is converted to miles by multiplying by a factor of 0.00062.
Miles/Gallon can now be calculated by simply dividing the distance in miles as calculated above and the fuel volume calculated in b part. But this volume is in m3, thus it is converted back to Gallons by multiplying 264.172 to it. Now the distance in miles is divided by the fuel volume to calculate miles/gallon.
Similarly, liters/100km is calculated by using the data from part b and c.
MODELLING FUEL FLOW:
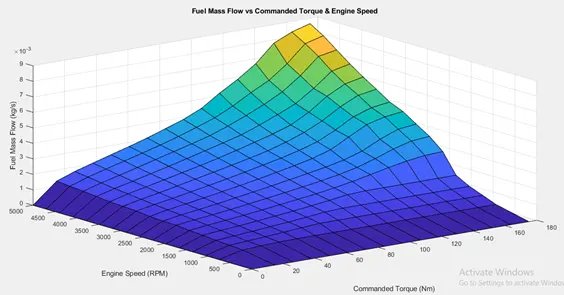
The fuel flow in the HEV will be from the electrical (battery) and mechanical (fuel-petrol/diesel) systems. The Engine fuel mass flow(kg/s) is calculated by using a 2D lookup table which give the fuel flow for corresponding torque and vehicle speed. The plot for this can be visualized as shown below:
The electrical propulsion system uses a Lithium-ion battery pack which makes the use of Lookup tables to give output voltage and power loss in the battery. The power is then calculated as the product of voltage and current.
3. To Run the HEV Reference Application with WOT drive cycle and change the grade and wind velocity in the environment block.
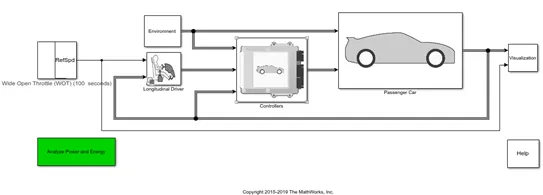
Wide Open Throttle Response: The WOT of a vehicle is calculated by subjecting it to full throttle or the complete pressing of the throttle peddle so as to increase its speed from 0 to its maximum speed. The time taken for this transition is calculated and it is termed as the Wide open throttle response of the vehicle.
The drive cycle for WOT is selected for the HEV model and the drive cycle was configured for the following parameters:
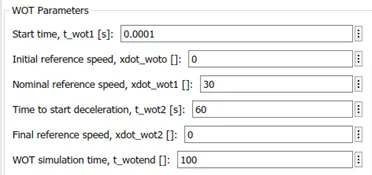
The simulation results for the model with 0 gradability and 0 wind velocity and all the default parameters are shown below:
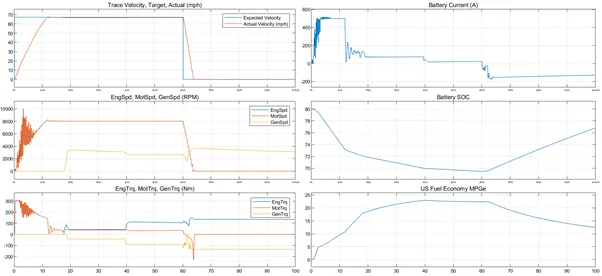
Plot 1: This shows the expected response from the vehicle and the actual response of the vehicle. The actual response differs from the expected response because the discharge rate of the battery is limited to a certain value (approx. 500 A) in this case. Thus the vehicle cannot reach to the required speed immediately.
Plot 2&3: The Engine, Motor and Generator rpm is shown in the 2nd plot. Initially only the motor provides the required torque and rpm. After 18seconds, the engine adds its torque and rpm to the motor torque. This is because the vehicle control strategy limits the battery SOC. The generator and engine rpm overlap for the entire duration. During deceleration (post t=60s), the motor rpm reaches zero and its torque becomes negative. Leading to regenerative breaking of the motor. During the same time, the engine and generator shaft keep rotating and they charge the battery in this process. The generator torque is negative and engine torque remains positive.
Plot 4&5: These plots show the battery current and SOC (State of Charge). The battery gives out heavy current initially and thus the SOC decreases. When the engine comes into picture, the current discharge is reduced and the SOC keeps reducing. After the vehicle starts decelerating, the generator and engine coupling provide current back to the battery thus it goes negative and the SOC of the battery improves.
Plot 6: The miles travelled per gallon of fuel of the vehicle is shown in this plot. It has a positive slope initially since only the motor is operating, owing to the fact that the efficiency of the motor is better than that of the generator. This slope decreases when both the motor and engine re operating. During deceleration, the MPG decreases since only the engine is operating now.
The following simulation results are for a gradability of 12 and wind velocity of 20:
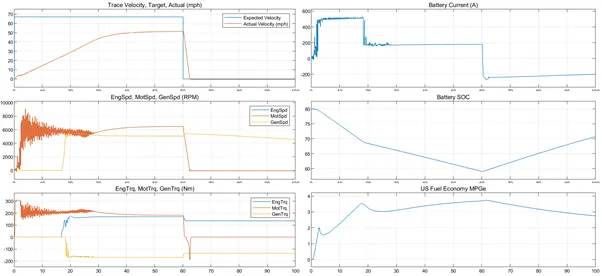
The gradability and wind velocity can be changed from the environment block in the HEV Model.
Plot 1: When the gradability is increased, the vehicle requires more power to cover the similar amount of distance. The vehicle cannot attain the expected maximum speed requirements since the power generated gets utilized in overcoming the gradability and the wind velocity.
Plot 2&3: In this case too, the engine adds to the motor rpm after around 18sec, but the engine rpm exceeds that of the motor because of increased power requirement. When the vehicle decelerates, the motor goes into regenerative mode since its torque becomes negative. During this time, the engine torque remains positive and generator torque is negetive.
Plot 4&5: The Battery Current and SOC plot can be explained similarly as in the previous case with 0 gradability and no wind velocity.
Plot 6: The MPG of the vehicle increases when the power requirement is split more to the motor side and reduces significantly when the engine takes over the operation of the vehicle.
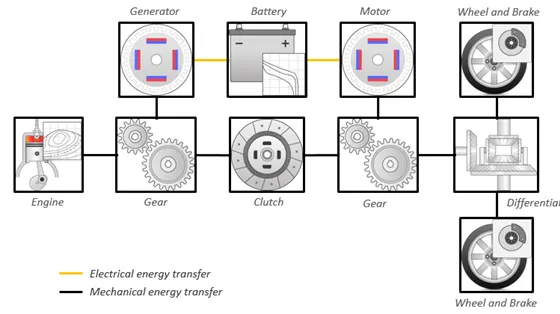
The HEV uses a hybrid powertrain consisting of a Motor, Engine and a Generator and its block diagram is as shown below. This is a series-parallel hybrid architecture where the power demand can be satisfied by the engine and the motor operating at the same time.
4. To compare the simulated results of hybrid and pure electric powertrains (Keeping all other parameters same).
The HEV uses a hybrid powertrain consisting of a Motor, Engine and a Generator and its block diagram is as shown below. This is a series-parallel hybrid architecture where the power demand can be satisfied by the engine and the motor operating at the same time.
The model is simulated for the FTP75 Drive Cycle and the results are as given below:
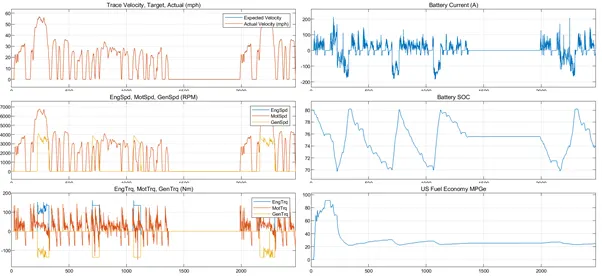
The power required for the vehicle in the FTP drive cycle is split between the engine and the motor. The time instants where the maximum speed is required, the torque and rpm is shared by the engine. The results show that the battery SOC fluctuates between 70-80%. This is because of the vehicle control strategy implemented that allows the battery to vary in that range only. The motor operates to deplete the SOC till 70% and then the engine and generator operate to charge the battery back to 80% during which the battery current is negative because of the regenerative braking mode. Once this level is reached, the motor again operates and the engine operates only if the power requirement is not satisfied by the motor alone. The maximum value of MPG reached by the HEV is around 90 and this is when the motor alone operates and the engine is turned off.
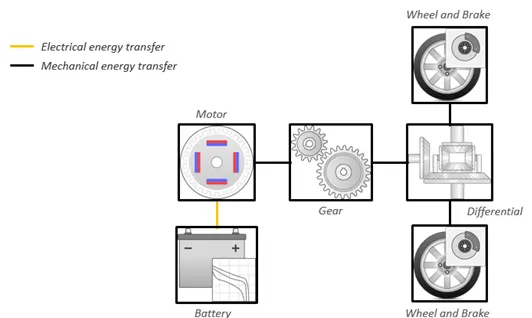
The EV model uses a pure electric powertrain for propulsion. Here, the motor powered by the battery is the only source available.
Simulating the model for FTP75 Drive Cycle gives the following results:
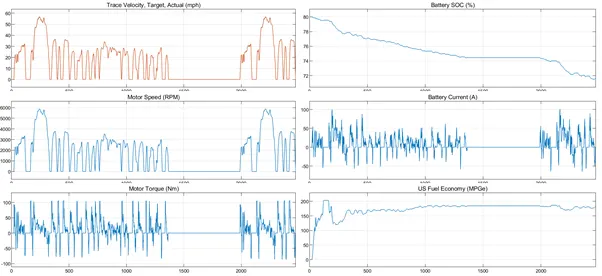
The battery SOC in this case goes down from 80% to 72% and the slight crests and troughs in the SOC curve show the SOC improvement during the braking operation. The battery current is positive during acceleration (positive motor torque) and negative during deceleration (negative motor torque) due to braking action. The MPG is high in the PEV with its maximum at 200 for the maximum speed requirement and most of the times stays in the same range of 200.
- CONCLUSION:
- The mapped models are preferable over dynamic for power and efficiency calculation.
- The MPG for the HEV and PEV can be calculated by using Simulink.
- Gradability and wind velocity result in poor WOT response of the vehicle.
- The PEV powertrain offers better MPG compared to the HEV