Week-4 Challenge WOT Condition Part-2
1).Difference between mapped and dynamic models :
Mapped model:
Mapped model comprises various plots (which may be 2D or may even 3D) between several parameters of the model based on the operating equations of the model. When the model is defined by initial parameters, then whenever input variables are applied to the model then their corresponding output values are obtained from the plots and are assigned to its output parameters.
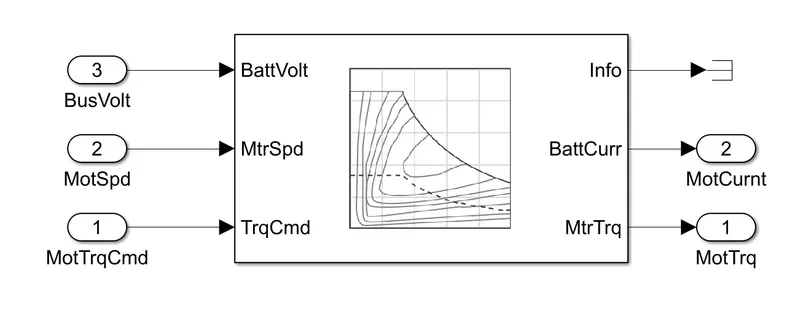
Let us consider mapped motor model which is shown in the below figure.
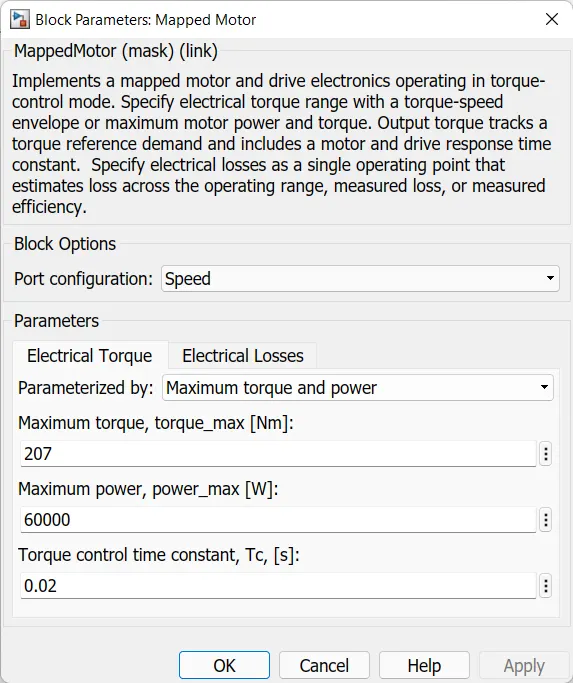
Initially mapped motor is defined by parameters like maximum power, maximum torque, electric losses etc as shown in the below window.
Whenever the input parameters like battery voltage (which is input voltage for motor), motor speed, commanded motor torque (required motor torque) applied to mapped motor, then the model goes through its plots and obtain their corresponding values of output parameters like motor torque (actual torque developed by the motor), motor current(which is current drawn by the motor to develop given torque) and info from which other parameters like mechanical power and power loss etc can be known.
Dynamic model :
Dynamic model is actually designed similar to the real model with its components. Here, when inputs parameters are applied to the dynamic model, then the model executes those values with operating equations of the blocks and gives out the required output parameters.
Let us consider 'dynamic motor model' which is designed as shown in the below image which consists of interior PM motor controller, three phase voltage inverter and interior permanent magnet (PM) synchronous motor.
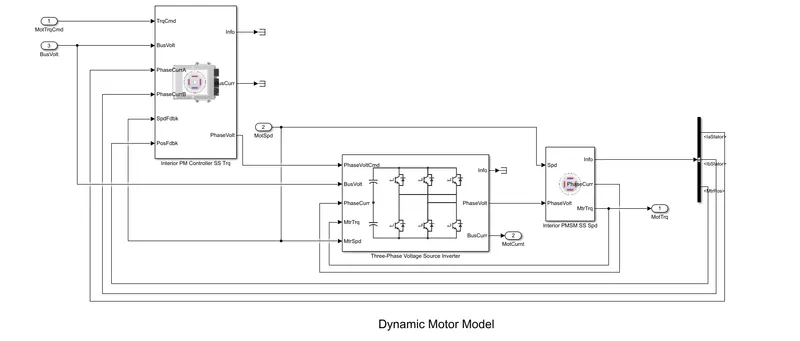
During simulation, when the inputs like battery voltage, motor output shaft speed and commanded motor torque applied to the model, then the controller give its field of the motor and the inverter continously convert the applied dc voltage to 3 phase AC supply and the motor develops the required torque.
Changing the model type :
Let us convert the mapped generator to dynamic generator in the Hybrid Electic Vehicle input power-split reference application as shown in the below image.
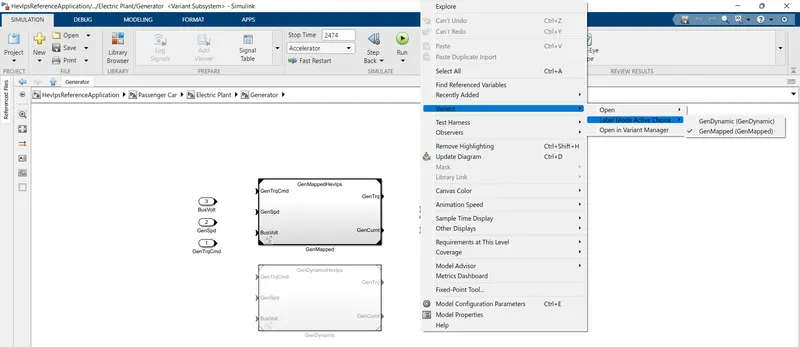
- Spot the the location of the block whose model type is to be changed from mapped to dynamic or vice-versa.
- Right click on the empty space of the page in which our required block is present, which opens a window with multiple options.
- Then, click on 'variant' and then click on 'Label Mode Active Choice' which gives options Dynamic and Mapped from which we can select either Dynamic or Mapped model as per required conversion.
Or
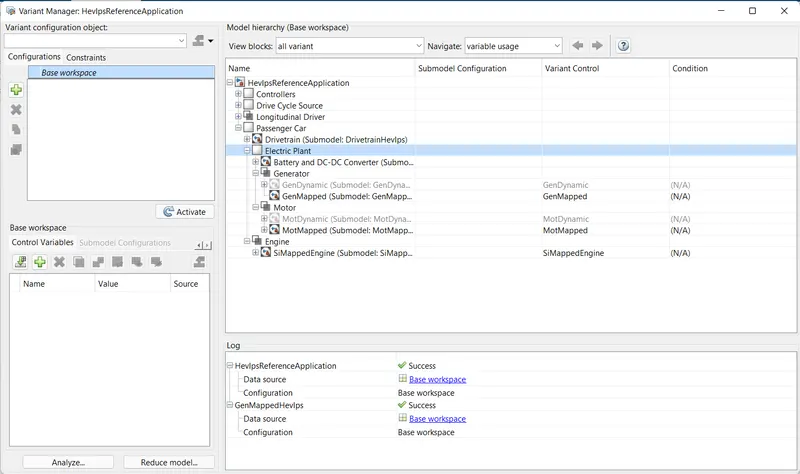
Click on the 'Variant Manager' from Modelling option in the top menu bar (tool bar). In which we can change the model type (mapped `harr`dynamic) for all eligible blocks in given example at one place as shown in the below figure.
2). Calculation of miles per gallon:
Let us consider 'Hybrid electric vehicle (HEV) input power-split reference application' for calculation of miles per gallon(MPG).
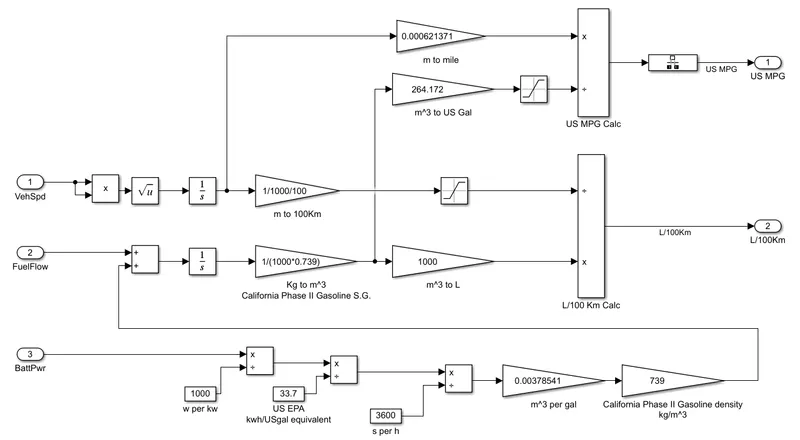
As shown in the below figure, miles per gallon for HEV input power-split reference application is modelled in 'performance calculations block' which is part of subsystem of 'visualisation block'.
We know that,
Miles per gallon = `"Total distance travelled by the vehicle (in miles)" / "Total volume of fuel consumed by the vehicle (in gallons)"`
Calculating total distance travelled by the vehicle (in miles):
Initially, vehicle speed(m/sec) is multiplied by itself and the result of product is square rooted. This is done to calculate the absolute value of velocity.
Later, distance(m) is calculated by integrating the absolute value of velocity(m/sec) of the vehicle over the time of drive cycle.
Finally, total distance travelled by the vehicle is multiplied by 0.000621371 inorder to convert the units of distance from metres to miles. (`:' 1meter= (1/1609.344)"miles" = 0.00621371 "miles"`)
Calculating total volume of fuel consumed (in gallons):
Here, gasoline/petrol consumed from fuel tank and electric energy consumed from battery together considered as total equivalent fuel consumed by the vehicle.
Power (in watts) delivered by the battery is converted to kW by dividing with 1000.
Power (in kW) at every second is converted into kWh by dividing with 3600.
Energy (in kWh) is converted into equivalent US gallons by dividing it with 33.7. (`:'` 1 US gallon of gasoline = 33.7kWh)
Now, equivalent energy (in US gallons) is converted into `m^3`by multiplying with 0.00378541. (`:'` 1 US gallon = 0.00378541 `m^3`)
Mass of gasoline (kg) = `"(Density of Gasoline) *(Volume of Gasoline)"`
Volume of gasoline equivalent of electric energy from battery (`m^3`) is converted into kg by multiplying with its value of density, 739.
Now, volume of fuel (kg/sec) consumed from vehicle and volume of gasoline equlvalent of electric energy are added through 'sum block' and integrated and later converted from kg to `m^3` and then to gallons by multiplying consecutively with (1/739) and 264.72.
Therefore, total distance travelled in miles by the vehicle is divided by the total fuel consumed (gasoline from fuel tank + electric power from battery) by the vehicle in gallons to get the required miles per gallon value.
`:.` Miles per gallon = `"Total distance travelled by the vehicle (in miles)" / "Total volume of fuel consumed by the vehicle (in gallons)"`
Factors considered to model fuel flow are:
- Engine fuel flow output in kg/s (denoted as FuelMassFlw in SI mapped engine block)
- Fuel injector pulse-width multiplier for closed-loop AFR control (denoted as ClsdLpFuelMult in SI controller block)
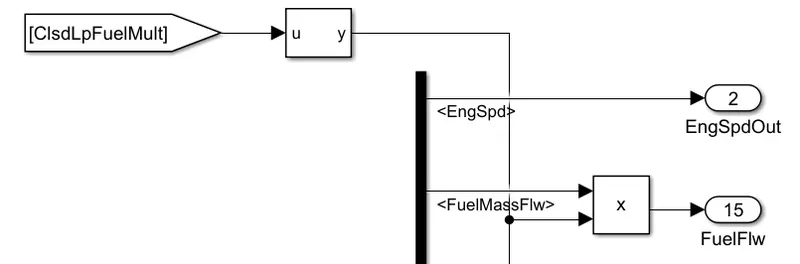
Fuel flow = Engine fuel flow output * Fuel injector pulse-width multiplier for closed-loop AFR control.
3).Simulating HEV ReferenceApplication with WOT drive cycle while the grade and wind velocity in the environment block are changed :
The block diagram for 'Hybrid electric vehicle (HEV) input power-split reference application' is shown in the below image.
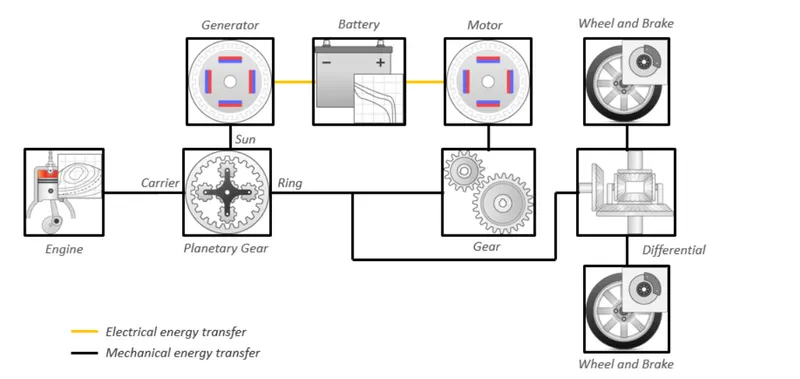
Here, our objective is to conduct wide open throttle (WOT) for given vehicle. So in 'Drive cycle source ' block, the drive cycle is changed from default FTP75 to WOT cycle.
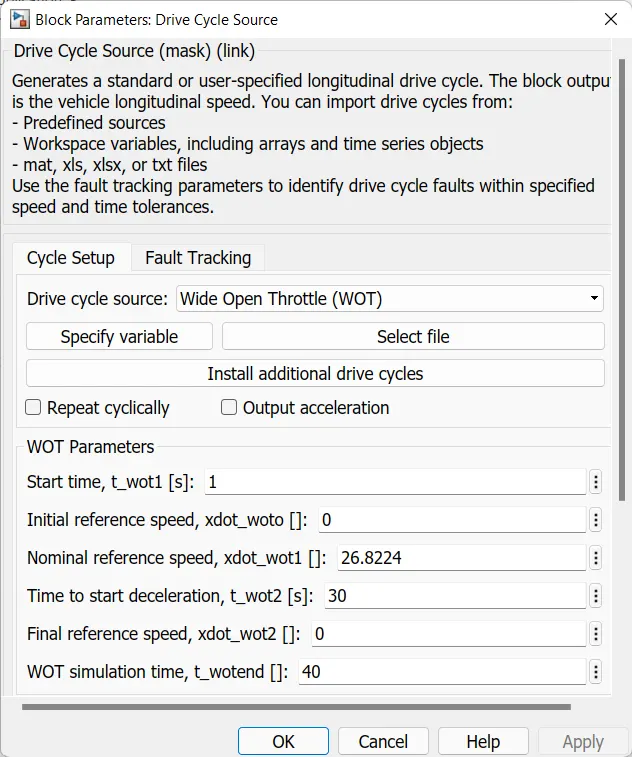
Simulation time is set to atleast 40 seconds because the duration of WOT drive cycle is 40 sec.
After running the simulation, the following results are observed in the scope.
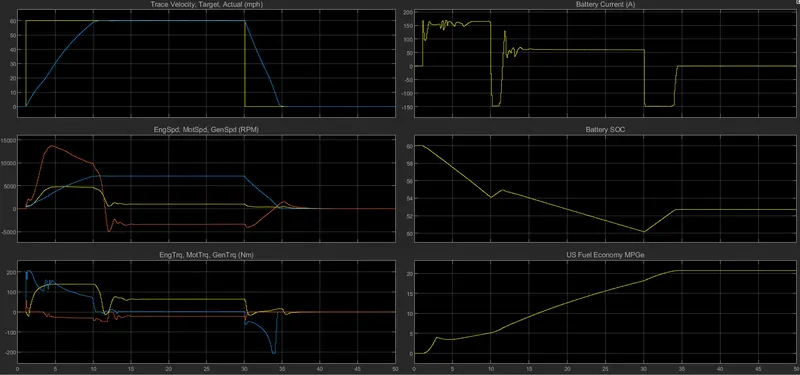
From the above plots, we can observe that
- Vehicle gradually increasing the speed and it reached the top speed (60 mph) in 9.9 seconds approximately.
- During full throttle acclereation, the tractive effort is delivered by the vehicle is combined torque of both motor and engine.
- Regeneration took place during 10 to 12 sec because generated torque is more than required torque as speed is limited to top speed (60mph).
- When the vehicle reached the top speed, only engine torque is providing demanded torque as tractive effort is less compared to that during full throttle acceleration.
- While deceleration, regeneration took place from 30 to 35 seconds because regenerative braking is applied to decelerate the vehicle.
- During regeneration, we can observe that the charging current of battery is limited to 150A.
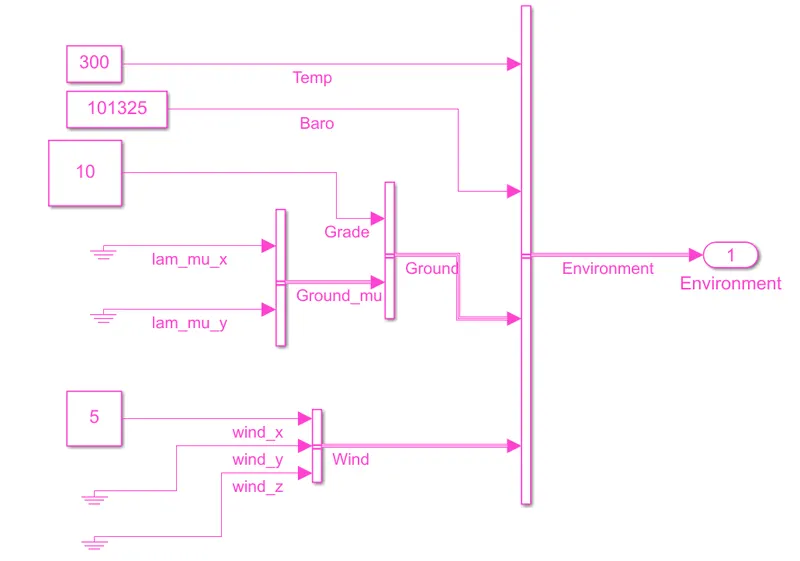
Changing wind velocity and grade angle in the environment block :
The default values of grade angle and wind velocit are 0° and 0 m/sec respectively. So, grade angle is updated to 10° and wind velocity to 5m/sec as shown in the below figure.
After running the simulation with grade and wind velocity updated parameters, the following results are observed in the scope.
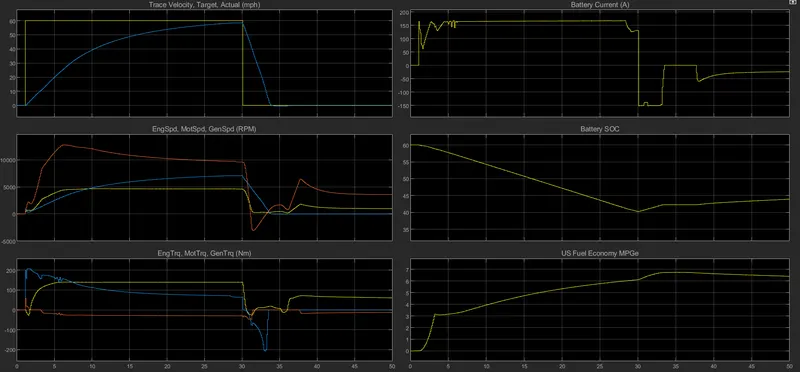
From the above plots, we can observe that
- Here, the vehicle couldn't even reach top speed (60 mph) during WOT duration but it settled at 58.4mph.
- As the tractive effort is required is more during acceleration, both motor and engine develop torques together to meet demanded torque.
- During deceleration of vehicle, regenration occured which charges the battery.
- Even here we can observe that the maximum value of charging current of the battery is limited to 150A.
4).Comparision between simulated results of pure electric and hybrid powertrains:
Pure Electric Vehicle Reference Application:
The block diagram for 'pure electric vehicle reference application' is shown in the below picture.
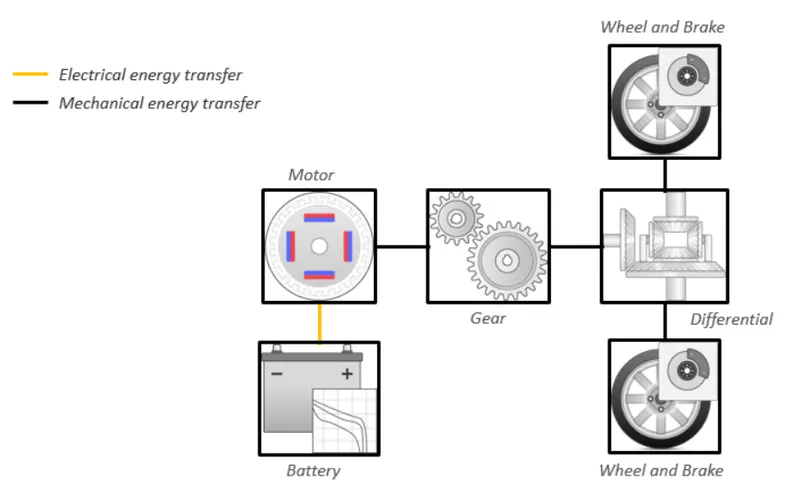
This vehicle comprises of electric motor which is the only torque developing source that meets the demanded torque by the vehicle. So, the battery is to be charged through external cahrging circuit. There is a case where battery is charged internally by motor that acts as generator during regenerative action which occurs while vehicle is decelerating or descending the slope.
The simulated results of the above model is observed in the scope as shown in the below figure:
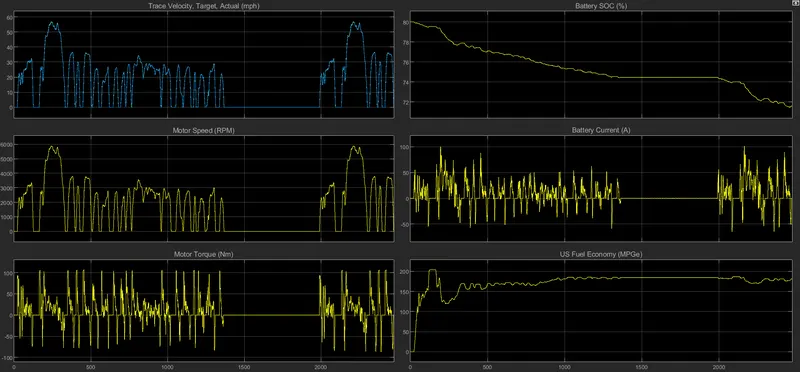
From the above plots, we observed that,
- The actual velocity of the vehicle is almost matched the target velocity at every instant of drive cycle.
- Motor developed positive torque throught the drive cycle except during deceleration.
- During deceleration, motor is developing negaive torque which means it is acting as generator that charges the battery.
- Whenever the vehicle is demanding the torque, the current is positive that means current flowed out of the battery and during regeneration current is negative that means current is flowed into the battery.
- The status of the battery (charging or discharging) can also be known through State of Charge plot.
Hybrid Electric Vehicle Reference Multimode Reference Application:
The block diagram of 'hybrid electric vehicle reference multimode reference application' is shown in the below picture.
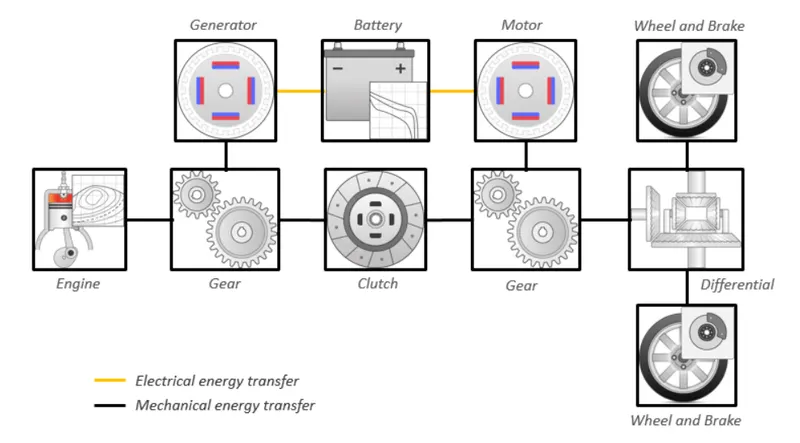
In this vehicle, the torque demanded by the vehicle is meet by the torques developed by the engine and motor individually or combined depends on the operationg mode of the vehicle. The battery is charged internally through engine and motor during different modes or externally through external charging circuit only if the vehicle is PHEV (Plugged in Hybrid Electric Vehicle).
The simulated results of above model is observed in the scope as shown in the below figure.
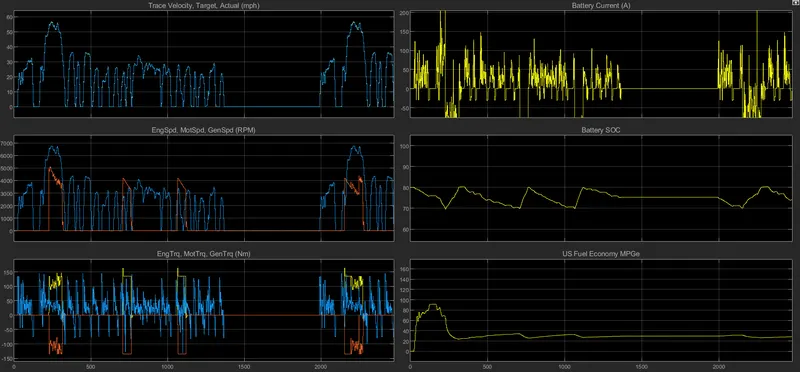
- From the above plots, we observed that,
- The actual velocity of the vehicle is almost matched the target velocity at every instant of drive cycle.
- Only torque developed by the motor met the demanded torque during most part of the drive cycle as the tractive effort required by the vehicle can be generated by the motor alone. The engine starts to develop torque which inturns charges the battery whenever the battery reaches 70% SOC level to maintain the battery in Charge sustaining mode.
- During deceleration, regeneration occured as the generator starts rotating captures the excees energy developed and charges the battery.
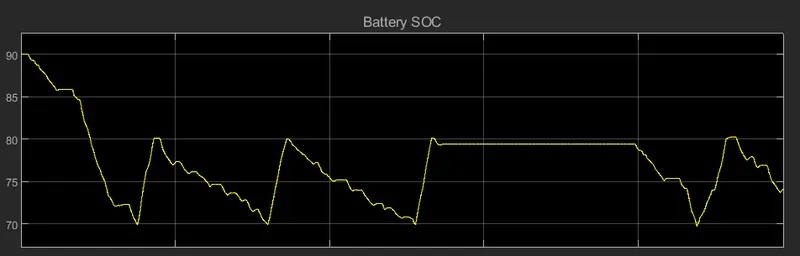
- From the SOC plot, we can say that the battery is in 'charge sustaining mode' between the levels of 80% and 70% which means the battery starts discharges when %SOC is at 80 and battery starts charges when %SOC is at 70.
- As shown in the below image, even when the initial capacity of the battery is increased to 90% from 80%, the battery goes in 'charge sustaining mode' between the SOC levels of a 80 and 70 as the vehicle is in such a way that battery is in charge depleting mode when SOC is above 80% and it is in charge sustaining mode while SOC is between 80% and 70%.
- The battery even charges while deceleration because of regenerative braking where the torque producing motor acts as a generator and drives the charging current to the battery.