Week-3 Challenge: ADVISOR Tool
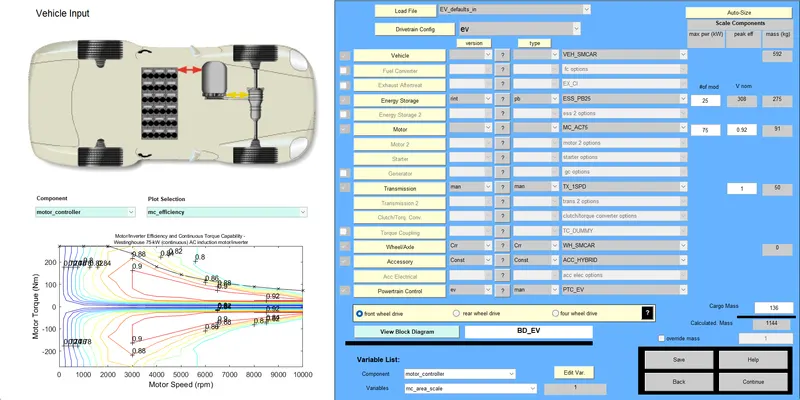
1). The interface for ‘EV_defaults_in file’ is as shown in the below figure.
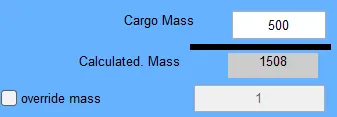
The cargo mass is updated to 500 kgs from bottom right corner as shown in the below image.
After updating cargo mass, click on ‘Continue’ buttton then the window displaying selection for drive cycle is opened as shown in the below figure.
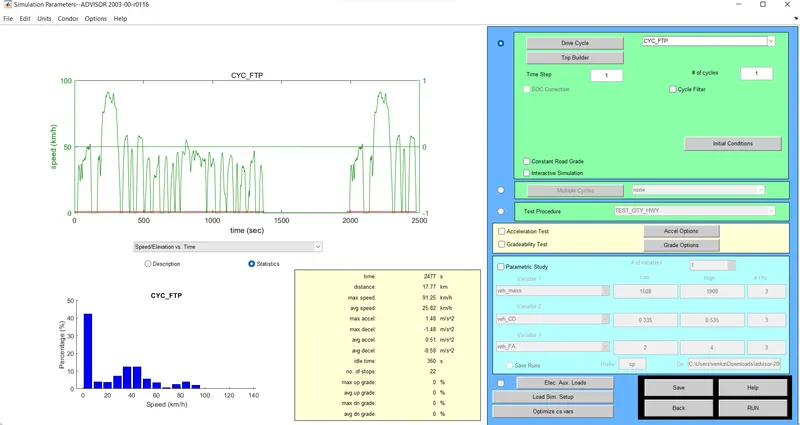
The default drive cycle is UDDS and it is changed to required FTP drive cycle from the top right corner box.
By observing the statistics of given FTP drive cycle, the total distance travelled by a vehicle in one FTP drive cycle = 17.77kms
Here, we need to test the EV_default vehicle (with its increased cargo mass) whether it can give range of 45kms or not. So, lets calculate minimum number of FTP cycles need to be RUN one after another.
Distance travelled in one cycle = 17.77kms
No. of cycles required for testing 45kms range = 45/17.77 = 2.53
So, we need to RUN the simulation for atleast three no. of cycles.
Therefore, update the correspondig cell of ‘# of cycles’ to 3 so that the FTP cycle is repeated three times in the updated drive cycle.
After RUNNING the model, the following results are observed.
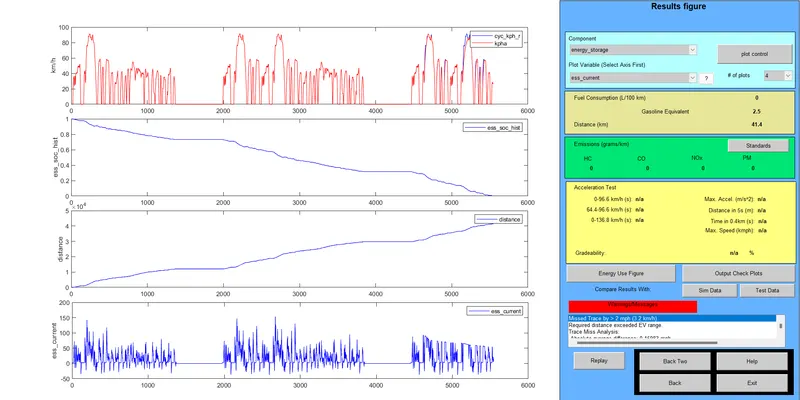
By observing SOC vs Time curve, State of Charge is dropped to zero, which results in energy stored in the battery is null. At this instant, the vehicle came to rest as there is no other energy available in the battery.
The vehicle stops during the 3rd driving cycle and it covers total distance (range) is 41.4kms.
We can even see in 'Warning messages' box that required distance exceed EV range.
Therefore, EV_default vehicle when its cargo weight is updated to 500kgs cannot travel for 45kms.
2). To meet the required range, the battery storage of given EV is to be increased.
The default number of modules are 25 which gives a range of about 41.4kms inorder to deliver 45kms range, lets increase the number of modules to 30 and observe whether it can do our task or not.
Default Energy Storage specifications :

Updated Energy Storage specifications :

We can observe that by increasing the number of modules, not only the voltage (V nominal) gets increased but also its weight (from 275kg to 330kg) which leads to consumption of more energy per km when compared to previous case.
After setting up the number of FTP drive cycles to 3, the model is ready to RUN. So after 'running' the model, the following results are observed.
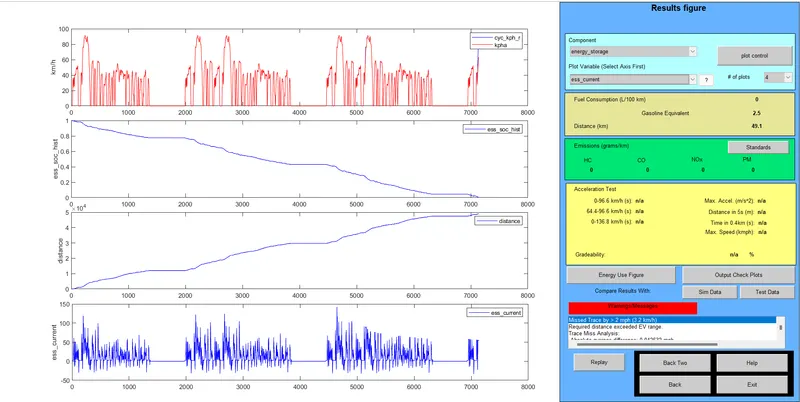
Now, the vehicle travelled for 49.1kms that means it gives more than our required 45kms range.
Therefore, 'EV_default' vehicle with 30 number of modules can comfortably travel 45kms range even with increase of its cargo weight to 500kgs.
3). The interface for Prius_Jpn is as shown in the following figure.
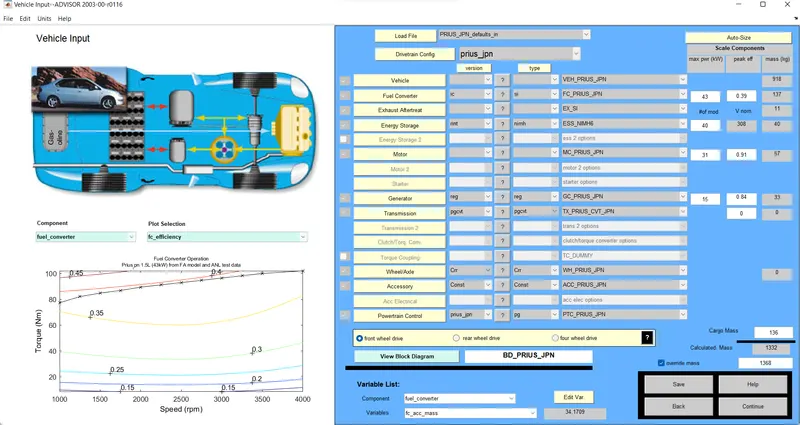
Given Prius car is a Series-Parallel hybrid which consists of IC engine, electric motor and electric generator. This is possible because of the Prius' power split device, a special gearbox that connects the gasoline engine, electric motor and generator together into one unit.
Here, simulation is carried out with default parameters, so we click on Continue which opens window that enables us to select Drive cycle, Accelelration test, Gradeability test etc as shown in the figure.
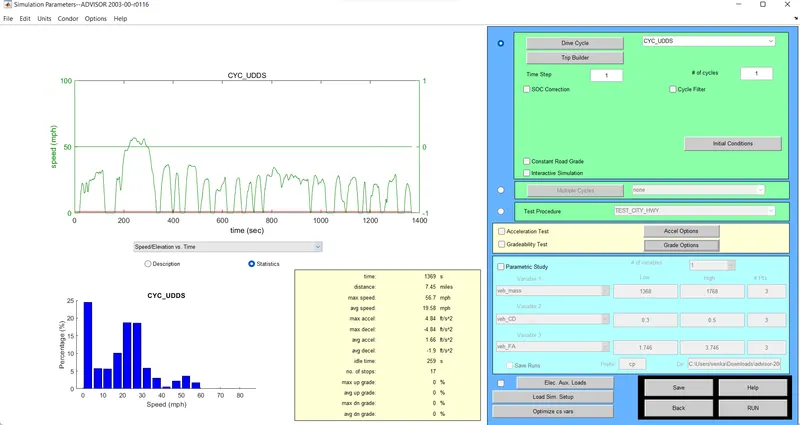
Inorder to conduct Gradeability test so we need to tick the check box beside the 'Gradeability test' and click ON the Grade options which open window as shown in below figure ii where we can edit occurance of grade at required speed and for required time and can make other adjustments.

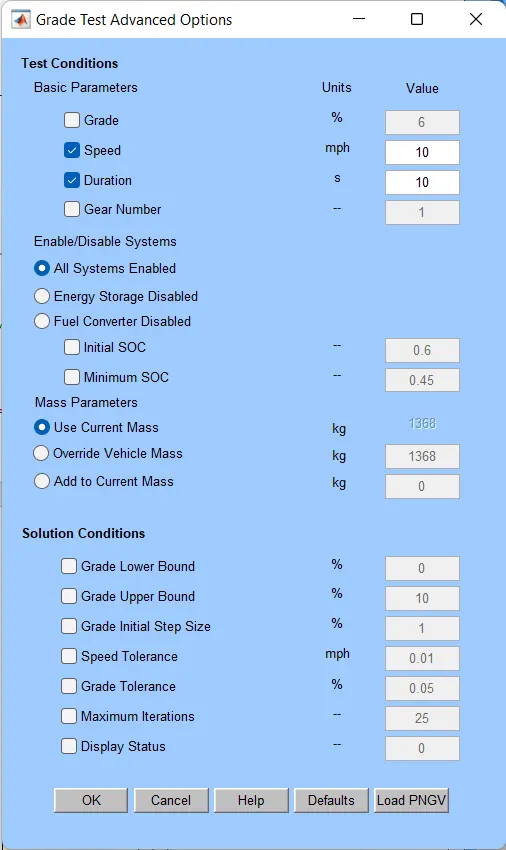
In the above window, we enabled 'All Sytems' that enables the gradeability effect on all vehicle driven energy sources.
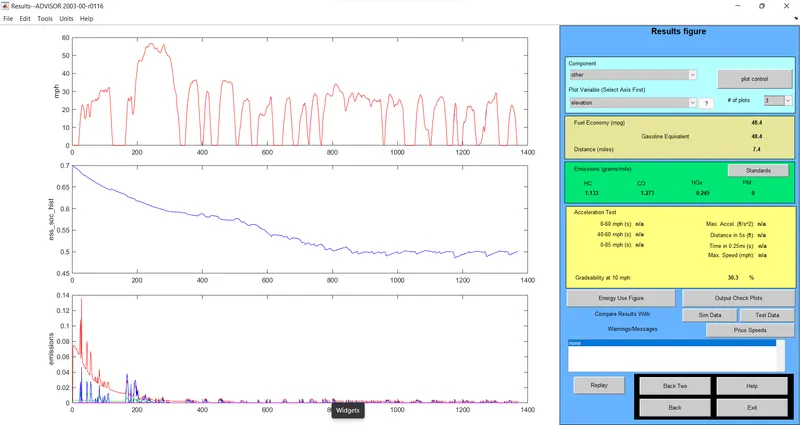
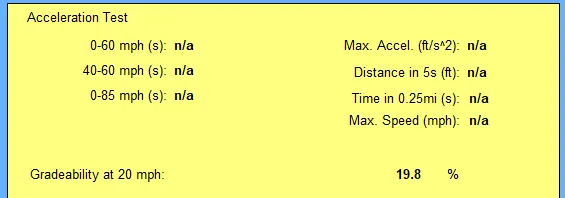
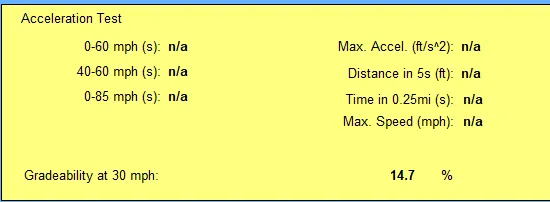
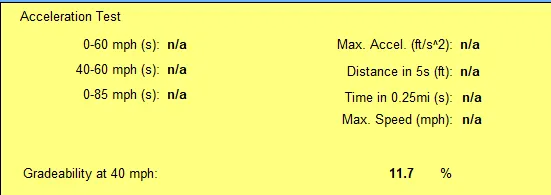
Lets conduct the gradeability test at different speeds for 10 seconds at each speed and observe the gradeability effect on the vehicle as shown in the following results.
(i)Gradeability at 10mph : 30.3%
(ii) Gradeability at 20mph : 19.8%
(iii) Gradeability at 30mph : 14.7%
(iv) Gradeability at 40mph : 11.7%
(v) Gradeability at 50mph : 9.7%
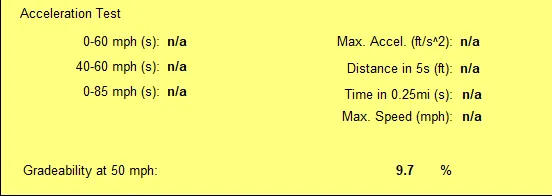
The following table shows %Gradeability effect on the vehicle when it is run for 10 seconds at corresponding speeds(in miles per hour).
| Speed of the vehicle | Gradeabiliy |
| 10mph | 30.3% |
| 20mph | 19.8% |
| 30mph | 14.7% |
| 40mph | 11.7% |
| 50mph | 9.7% |
From above table, we can observe that the effect of gradeability is more at lower speeds and its effect decreases as speed increases.