Week-11 Challenge: Braking
1).Calculation of braking energy for defined drive cycle:
Braking: The action of making a moving vehicle slow down or stop by using a brake or in other way.
When vehicle is moving with some velocity, for reducing the speed of the vehicle or to bring the vehicle to rest position, some amount of power is required. So, this power consumed by the vehicle is braking power.
We know that the kinetic energy possesed by the vehicle which is moving with velocity of 'V' m/sec is given by
`E=1/2mV^2` Joules
where, m is the mass of the vehicle in kilograms.
(i) If the vehicle need to come to rest from moving with the velocity of 'V' m/sec, then energy utilised by the vehicle for braking is the kinetic energy possesed by it i.e, `E=1/2mV^2`Joules.
(ii) If the velocity of the vehicle is to be reduced (deceleration) from `V_1` to `V_2` m/sec, then the energy utilised by the vehicle for braking is given by
`E=1/2m(V_1-V_2)^2` Joules.
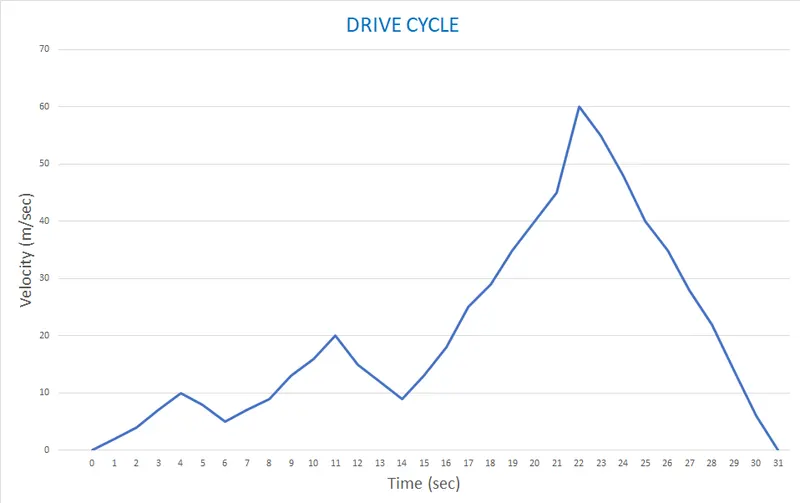
Let us assume drive cycle which is created in spread sheet with total duration of 31 seconds and it is plotted as shown in the following figure:
The following image shows calculation of the braking energy for above assumed drive cycle in spreadsheet:
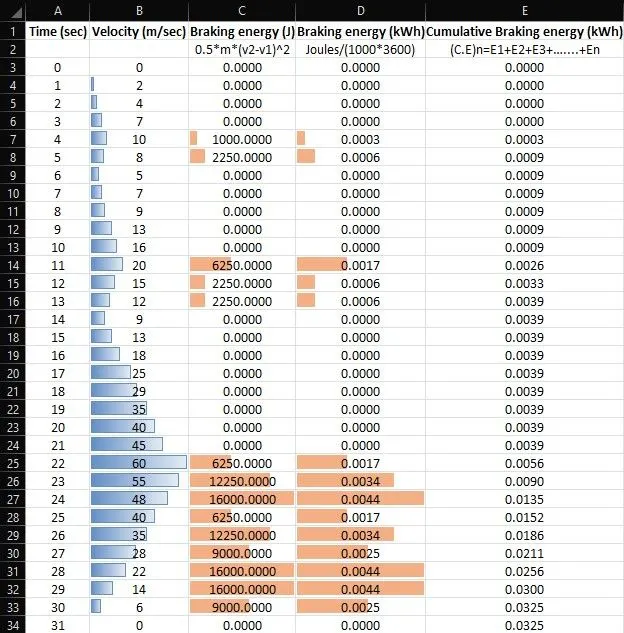
Here, the braking energy is to be calculated only when the vehicle is decelerating or even when vehicle coming to rest position, so using braking energy (in Joules) is calculated using formula,
`"IF"(V_(n+1)<V_n,1,0)**0.5**m**(V_n-V_(n+1))^2`
where,
Detail of IF formula in spreadsheet : IF(Logical test, [Value_if_true], [Value_if_false])
Total mass of the vehicle is m kg (assumed as 500 kg).
For example, let us calculate the braking energy at two instants:
(i) At t = 1 sec: Braking energy is calculated in corresponding cell 'C4'.
`"C4"="IF"("B4"<"B3",1,0)**0.5**500**"(B3"-"B4)"^2`
`"C4"=0**0.5**500**"(2-4)^2` `:'`B4 < B3 is false; value of IF formula is 0.
`C4=0` Joules
(ii) At t = 4 sec: Braking energy is calculated in corresponding cell 'C7'.
`"C7"="IF"("B7"<"B6",1,0)**0.5**500**"(B6"-"B7)"^2`
`"C7"=1**0.5**500**"(10-8)^2` `:'`B7
`C7=1000` Joules
Later, braking energy for every one second is converted from Joules to kWh using below formula.
`"Energy (kWh) "= "Energy in Joules"/(1000**3600)`
Finally, the braking energy for every second is added cumulatively.
Therefore, the total braking energy consumed by the vehicle during defined drive cycle = 0.0325 kWh
The following image shows plot of velocity and cumulative braking energy variation with respect to time:
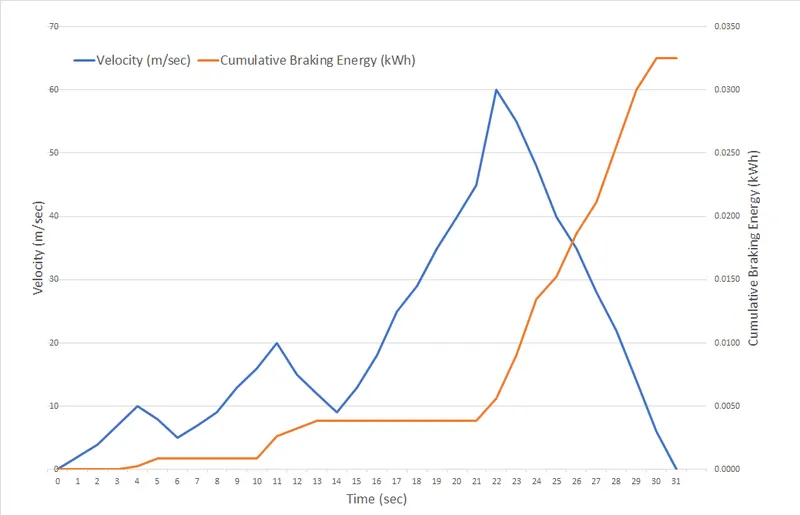
From above plot, we can observe that the cumulative braking energy is increased only when the vehicle decelerates and it remains constant when the vehicle is accelerating or moving with constant velocity.
2). Explaination for why electric motor can't develop braking torque at high speed similar to starting:
Braking torque is nothing but electromagnetic torque developed by the motor which acts opposite to the rotation of rotor.
In motoring mode, the electricmagnetic torque developed by the motor drives the rotor either in clockwise or counter-clockwise. In order to stop/slow down the rotor, some techniques (dynamic, regenerative and plugging) are employed.
Fom the below characteristics, we can observe that the motor develops constant torque at low speeds and as the speed increases above rated speed, the torque decreases which results in constant power region.
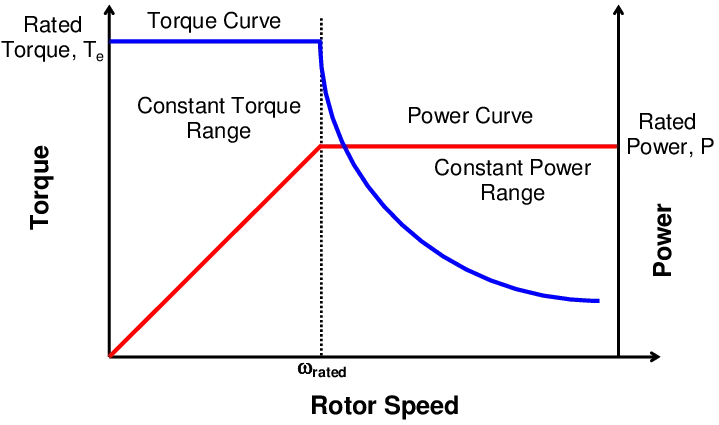
Let us assume that motor is driving a vehicle which running at a speed of N rpm with a torque of T-Nm. Whenever brakes are applied in electric vehicle, any of the braking technique (usually regenerative braking) is employed to slow or stop the vehicle. At the instant of brakes applied, the electromagnetic torque reverses and apply opposite to rotor direction of rotor with approximately magnitude of negative T-Nm (usully less).
Therefore, motor develops high braking torque and low braking torque at low and high speeds respectively same as electromagnetic torque developed by the motor for the motoring operation.
Coordination between electric and mechanical brakes:
In electric vehicle, the braking cannot be handled by the electric braking system alone because while regenerative braking, the charging current of the battery is limited. So, additonal braking system (mechanical braking, hydraulic braking systems etc) is to be employed along with electric braking systems.
Let us study the coordination between electric brakes which can be done in two ways i.e, series and parallel braking.
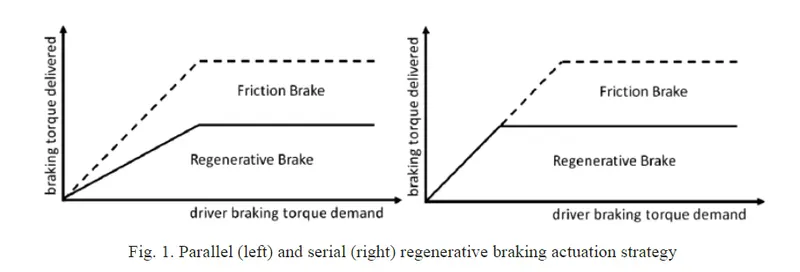
Parallel braking:
Here, both regenerative and mechanical (friction) braking are applied at every instant when the braking torque is demanded by the driver.
Series braking:
Here, required braking torque is produced by the regenerative braking alone until it reaches its maximum value (charging current during regenerative braking is limited). Later, if the braking torque is more than the maximum braking torque produced by regenerative braking produced by both friction and regenerative braking systems.
In above both cases, whenever the battery is full or almost full, regenerative braking is not used. During this situation, control unit in the vehicle forces to apply mechanical brakes independent of braking torque demanded by the driver.
3).Develop a MATLAB program which plots contour of given motor speed, torque and efficiency values:
The following formulae are used in the MATLAB code:
`"Efficiency of an electric motor" =("Output power developed by the motor")/("Input power fed to the motor")`
where
Output power = (Angular speed) * (Torque)
Input power = Output power + total losses
The total losses in the electric motor are copper losses, iron losses, windage losses and constant losses.
Copper loss `propI^2R`
`=>``P_(cu)propT^2R` `:'IpropT`
=>`P_(cu)=k_c**T^2`
Iron loss `propomega`
`=>`Iron loss `=k_i**omega`
Windage loss `propomega^3`
`=>`Windage loss `=k_w**omega^3`
The following MATLAB code develops required contour of speed, torque and efficiency of an eletric motor:
clear all
close all
clc
W=linspace(1,1000);     %Initiating angular speed vector
T=linspace(1,250);      %Initiating torque vector
kc=0.2;
ki=0.008;
kw=0.00001;
constL=20;             %Constant losses
[W,T]=meshgrid(W,T);   %Implements speed and torque vectors as axes
Output_power=W.*T;
B=(T.^2)*kc;          %Copper lossses
C=ki*W;               %Iron losses
D=(W.^3)*kw;          %Windage losses
Input_power=Output_power + B + C + D + constL;
Efficiency=Output_power./Input_power;
V=[0.7,0.75,0.8,0.85,0.9,0.91,0.92,0.93,0.94,0.95,0.96,];
%Plots contours especially at above mentioned efficiencies
box off
grid off
contourf(W,T,Efficiency,V);
colorbar
title("Contour plot for Speed,Torque & Efficiency of Electric motor")
xlabel("Angualr speed (rad/sec)");
ylabel("Torque (N-m)");
The following image shows the result plot for contour of speed,torque and efficiency of electric motor.
From the above result plot, we observed that:
Contours at different efficiences specified in variable 'V' (0.7,0.75, ...) in MATLAB code are plotted.
The maximum efficiency region when motor is developing motor torque around 25N-m while rotating at a speed of 200 rad/sec approximately.
When we moving outward from maximum efficiency in either direction, the efficiency decreases as seen in the colour bar.