Week-4 Challenge WOT Condition Part-2
Question 1): What is the difference between the mapped and dynamic model of engine, motor and generator? How can you change the model type?
Solution: Powertrain Blockset provides two types of combustion engine models: mapped and dynamic. The difference between the mapped and dynamic models are as follows:
Mapped model:
- Mapped engines represent macro engine behaviour as a set of lookup tables (brake torque, fuel flow, air mass flow, exhaust temperature, efficiency, and emissions) as functions of commanded load and measured engine speed.
- Mapped engine models are suitable for analysis and design activities that do not require engine subsystem dynamic characteristics.
-
The model uses a set of steady-state lookup tables to characterize engine performance.
-
The tables provide overall engine characteristics, including actual torque, fuel flow rate, BSFC, and engine-out exhaust emissions.
Some examples to use the mapped models are:
-
When we have the engine data from a dynamometer or a design tool like GT-POWER.
-
For quasi-steady-state engine simulations.
- In engine and transmission powertrain matching analysis for fuel economy, emissions, and performance tradeoffs.
Dynamic models:
- Dynamic engines decompose engine behaviour into individual component models that account for engine dynamics, most notably intake airflow and turbocharger dynamics.
- Dynamic engine models are suitable for designing control, estimator, and diagnostic algorithms that depend on dynamic subsystem states,
- The model decomposes the engine behaviour into engine characteristics that are separated into lower-level components.
- By combining components in this way, the models capture the dynamic effects.
Some examples to use the dynamic models are:
- In closed-loop AFR control algorithm development.
- When we need a more detailed dynamic model and have component-level data.
-
To analyze the impact of individual engine components on the overall performance.
Steps to change the model type:
- Open the Matlab window, go to the search bar and type 'powertrain'.
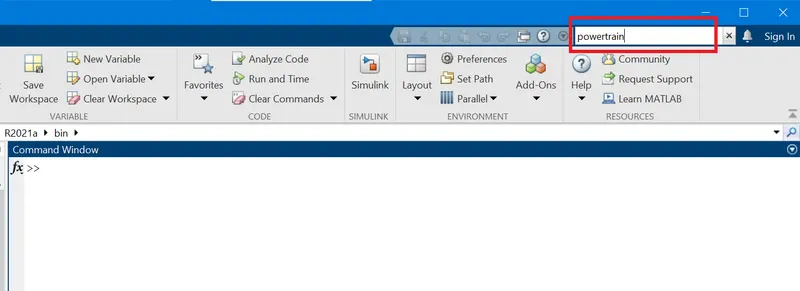
- After hitting the enter button, search results will get displayed on the Matlab window.
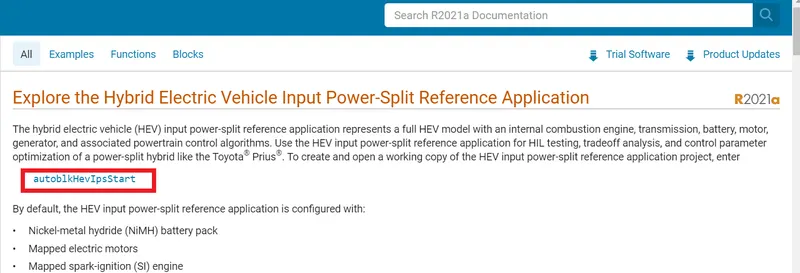
- Click on the option 'Getting started with Powertrain Blockset' as shown below.

- To open the 'Hybrid Electric Vehicle' model, we have selected the 'HEV' reference as shown below.
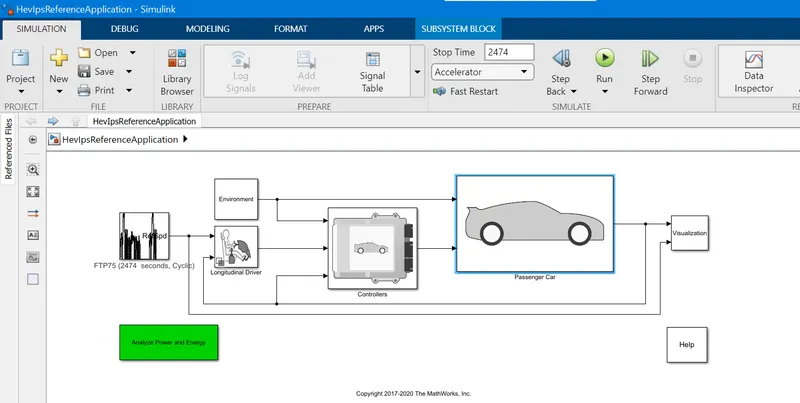
- The model will get open as shown below.
- Click on the block 'Passenger car'.
- Click on the 'Electric plant' block.
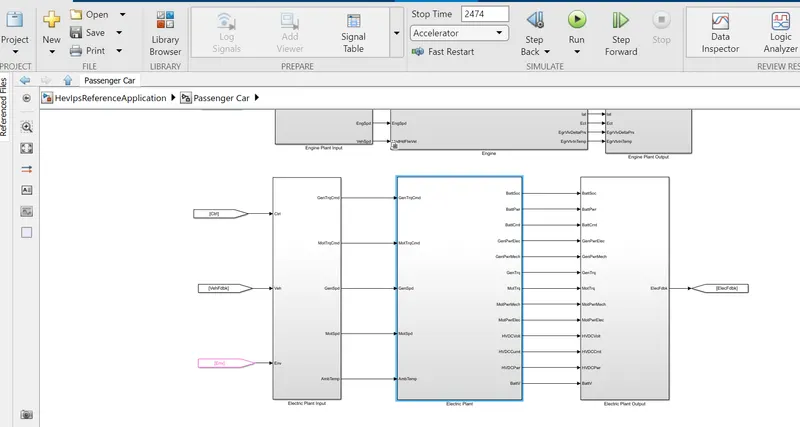
- Right-click on the 'Generator' block. Select the variant option to change the model type as below
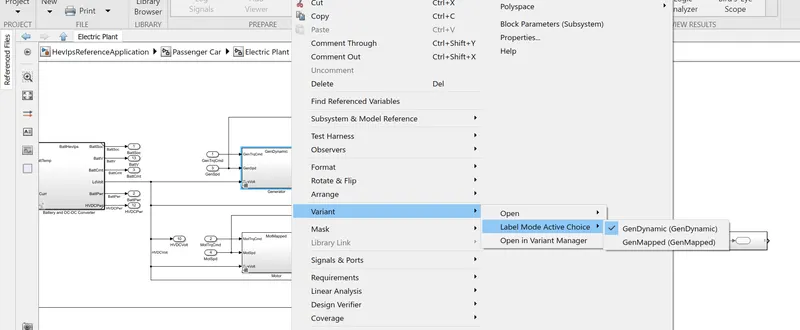
- By following these above steps we can change the model type.
Question 2): How does the model calculate miles per gallon? Which factors are considered to model fuel flow?
Solution: Gallon is the volumetric unit of the measurement for liquids and in terms of vehicle efficiency, it is related as miles/gallon. The hybrid vehicles that rely less on gas or electric vehicles that don’t use any gas at all rely on an equivalent measure used to compare the efficiency which is MPGe (Miles per gallon equivalent). Any vehicle that is powered by electricity or compressed natural gas will be rated for efficiency in MPGe.
1-gallon of gas has the same amount of energy as 33.7 kWh of electric energy. So, if a vehicle can cover 60 miles for every 33.7kWh of electricity, its MPGe would be 60. That would be the equivalent of a gas-powered car getting 60 mpg.
- We are considering the same 'HEV' model file from the powertrain blockset here.
- Click to open the visualization block.
- Inside the block, we have the power calculations blockset and there are three inputs given to the block which are:-
- Vehicle speed
- Fuel volume flow
- Vehicle power
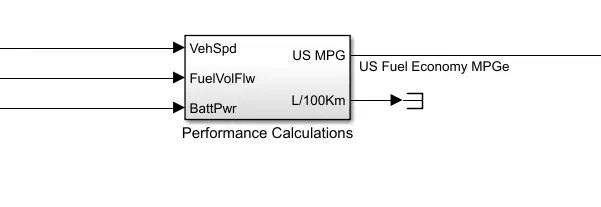
- Inside the power calculation blockset, conversion is performed.
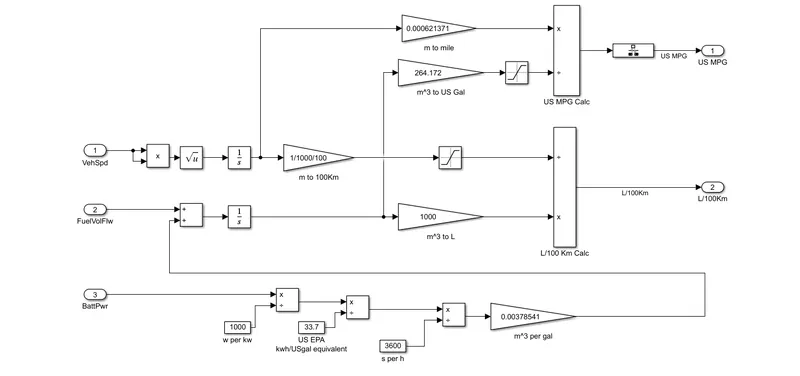
- Battery power is converted into KW then divided by 33.7 kWh and again divided by 3600 (sec) to convert into hour, after that the battery power conversion is done to (m^3) so that the fuel equivalent of the battery is added to the fuel flow.
- From the engine power the vehicle also runs in (HEV) and the amount of fuel burnt in propelling the vehicle is calculated with the conversion from (m^3 to Lit) on the basis of distance covered (L/100 km).
- The vehicle speed is also converted from the meter(m) to mile. So, we have the speed data and fuel volume rate by which MPG calculations are done to obtain the fuel efficiency.
Question 3): Run the HEV ReferenceApplication with WOT drive cycle. Change the grade and wind velocity in the environment block. Comment on the results.
Solution:
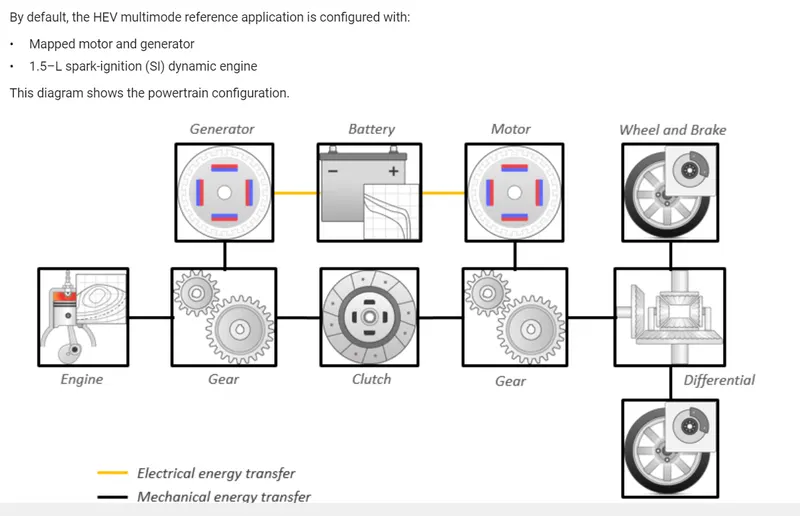
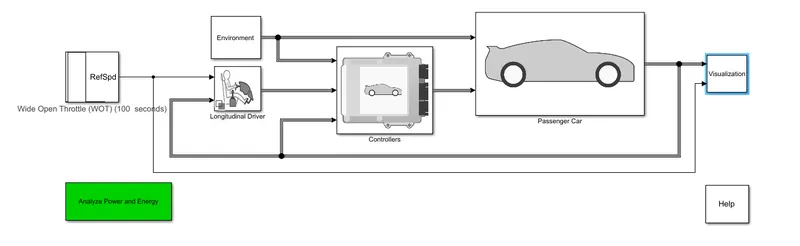
HEV model layout:
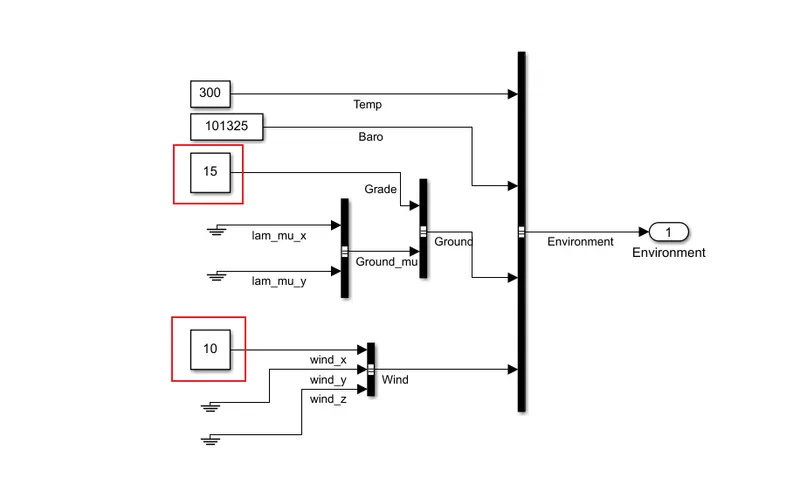
- To change the grade and wind velocity from the environment block.
Results plot:
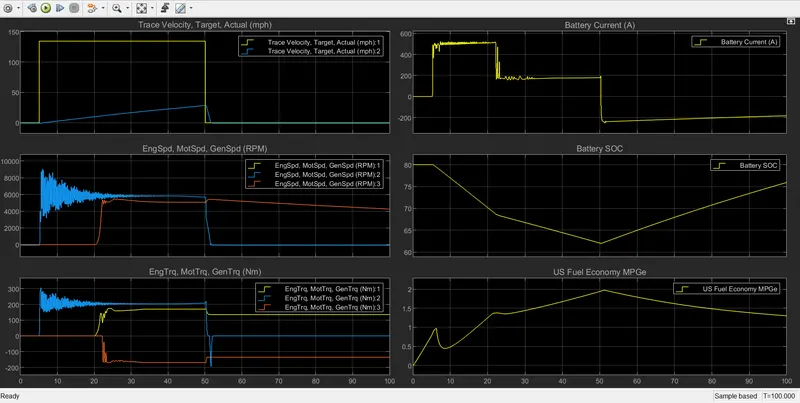
Plot 1: Trace Velocity, Target Actual:-
- The vehicle was at rest from 0 to 5 sec and given WOT for the range of time (5 to 50) sec. The target velocity was 134 mph and achieved in 45 sec but in actual condition after giving the environmental parameters, the vehicle has achieved the actual trace velocity which was 29.4 mph in 45 sec.
- The vehicle retarded in just 1.6 sec and reached 0 mph in actual trace velocity.
Plot 2: Battery current:-
- The battery current reached 500 A instantly as per the WOT condition and remains nearly the same up to 17 sec. The current was between (174 to 192) A for a period of (24 to 50) sec. After the deceleration of the vehicle, the current reaches -230 A. The current reaches negative as there was no requirement of power from the battery.
Plot 3: Engine,Motor.Generator speed(rpm) :-
- The motor rpm reached 8500 rpm as for WOT condition and came down to 5680 rpm at 50 sec. After 50-sec deceleration started and in just 1.7-sec motor rpm came down to zero. The engine started to work after 20 sec and rapidly increases 5100 rpm in just 3 sec and maintained the speed due to the demand for power from the engine. The motor and engine both were working but after 50 sec, deceleration started and the motor acted as a generator to produce the current.
Plot 4: Battery SOC:-
- The battery SOC was 80% AT the start (0 to 5)sec and due to WOT it reduces to 62% as the total drop of SOC was 18% in 45 sec. The vehicle started deceleration and the motor acts as a generator, so the battery gets charged from (50 to 100) sec. It is charged to 13.5% in 50 sec, So the rate of discharging is faster than the rate of charge. At last, the battery gained 75.5% SOC.
Plot 5: Engine,Motor, Generator torque:-
- The torque from the motor was high at the initial time of 5 sec, the engine torque increased after 22 sec and after the deceleration motor torque reaches to negative 192 Nm whereas the engine torque was 135 Nm.
Plot 6: Fuel Economy:-
- The fuel economy increases as per the power demand (WOT) and we can clearly see that the MPGe reached 1.95 and after deceleration, it reaches 1.3 MPGe.
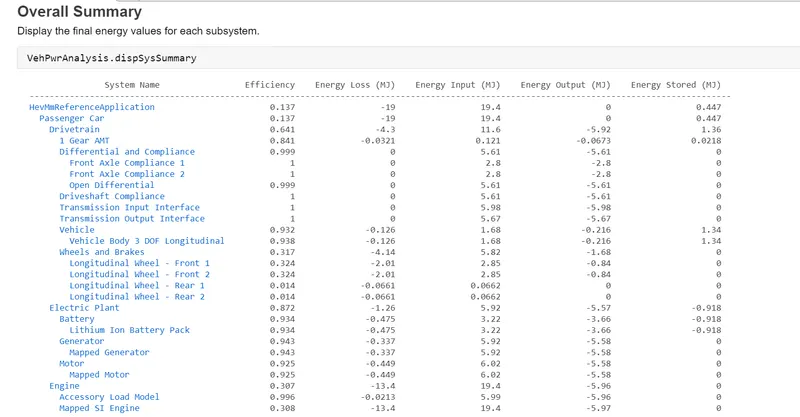
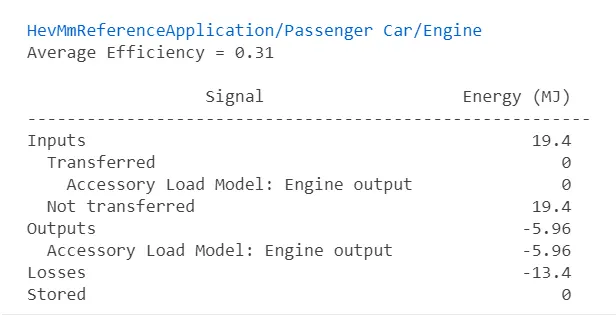
Engine plant summery:
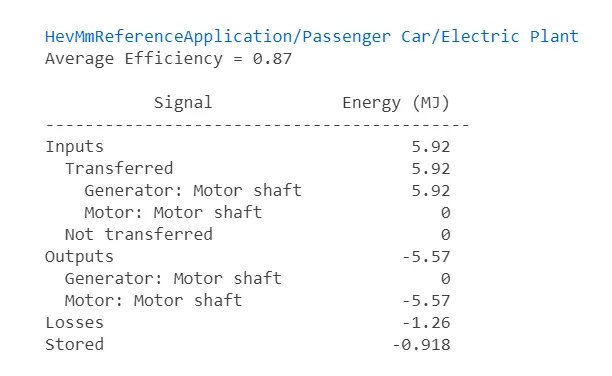
Electric plant summary:
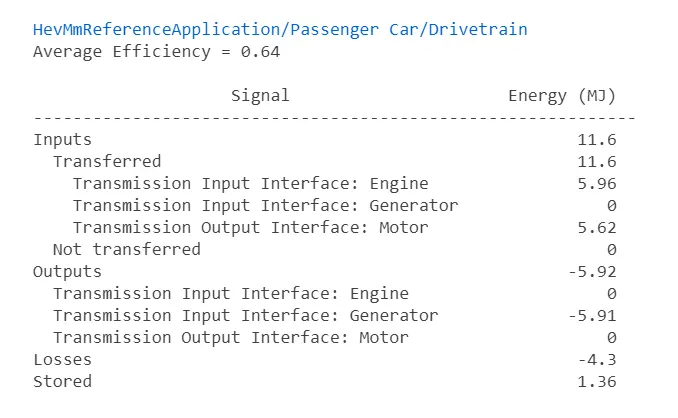
Drivetrain plant summary:
Question 4): Keeping all other parameters same, compare the simulated results of hybrid and pure electric powertrains.
Solution:
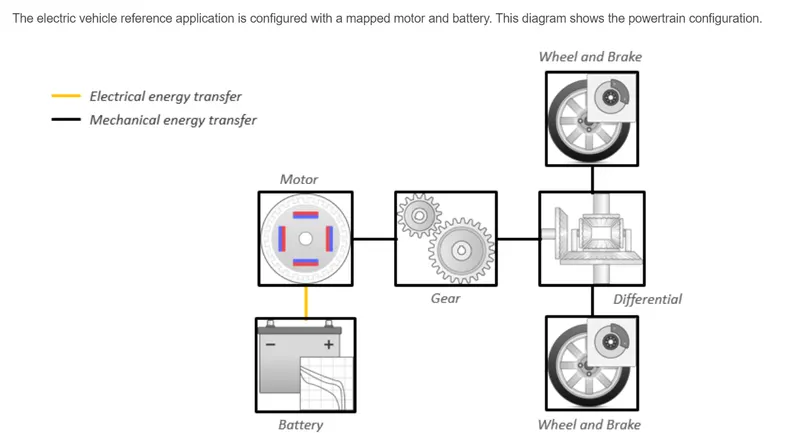
EV Model bocks:
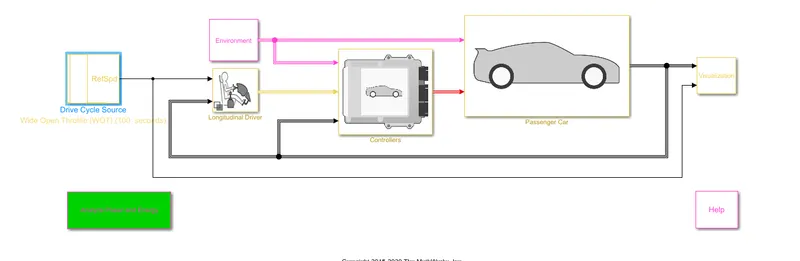
Results obtained in the form of plots:
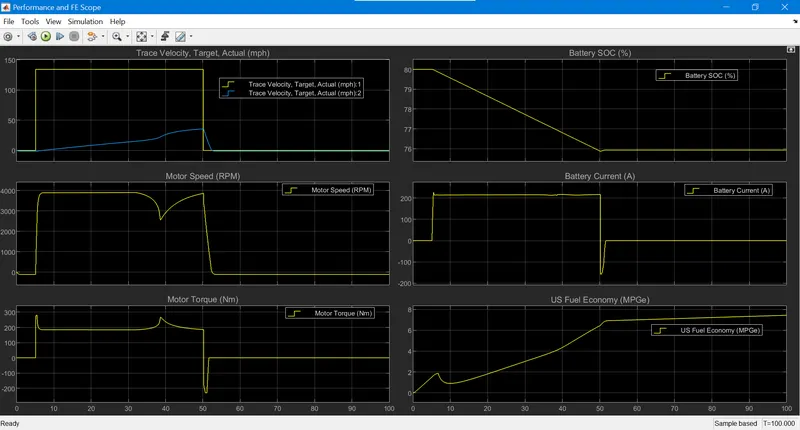
Plot 1: Trace Velocity, Target Actual:-
- The vehicle was at rest from 0 to 5 sec and given WOT for the range of time (5 to 50) sec. The target velocity was 134 mph and achieved in 45 sec but in actual condition after giving the environmental parameters, the vehicle has achieved the actual trace velocity which was 35.5 mph in 45 sec.
- The vehicle retarded in just 3 sec and reached 0 mph in actual trace velocity.
Plot 2: Battery current:-
- The battery current reached 215 A instantly as per the WOT condition and remains nearly the same up to 45 sec. After the deceleration of the vehicle, the current reach -157 A. The current reaches negative as there was no requirement of power from the battery. During deceleration, the vehicle regenerative braking happens and the motor acts as a generator to charge the battery.
Plot 3: Motor speed(rpm) :-
- The motor rpm reached 3895 rpm as for WOT condition and came down to 2558 rpm at 38.6 sec and was 3850 rpm at 50-sec. After 50-sec deceleration started and in just 3-sec motor rpm came down to zero. In deceleration, the motor stops rotating and the charging of the battery starts.
Plot 4: Battery SOC:-
- The battery SOC was 80% AT the start (0 to 5)sec and from (5 to 50) sec, the SOC reduces to 75%. In just 45 sec, the SOC level reduced to 5%. In deceleration from (50 to 100) sec, the battery SOC was 75% and there was no increase in the SOC on charging.
Plot 5: Motor torque(Nm):-
- The torque 272-Nm was delivered by the motor at 5-sec and was 265-Nm at 38.5-sec. The torque reaches -229 Nm at the time of deceleration.
Plot 6: Fuel Economy:-
- The fuel economy decreases as per the power demand (WOT) and we can clearly see that the MPGe reached 1.95 in acceleration and increased in deceleration.
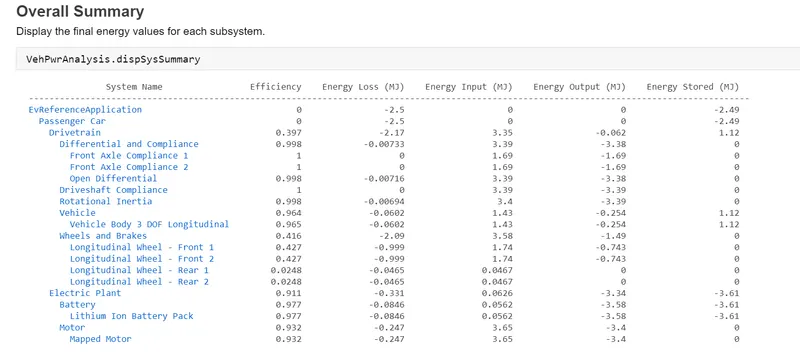
Electric plant summary:
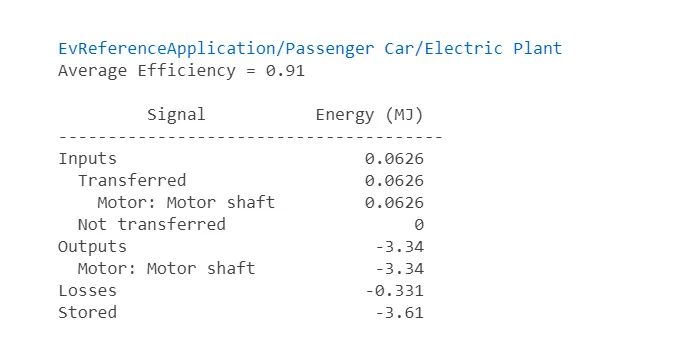
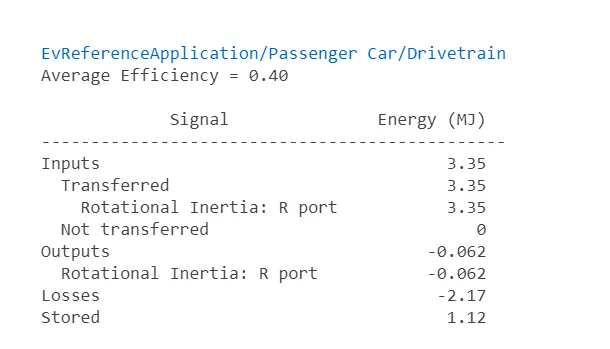
Drivetrain plant summary:
Conclusion:
- EV's are more efficient than HEV in terms of power losses, brake efficiency, SOC, current production, motor speed, motor torque and battery efficiency.
- EV's are pollution-free as compared to HEV's.
- EV's have fewer components as compared with HEV's. So light in weight also.
- EV's are more fuel-efficient.
Reference: