Project 1 - Parsing NASA thermodynamic data
Aim:
NASA came up with polynomials that can be used to evaluate thermodynamic properties such as Specific heat(Cp), Enthalpy(H) and Entropy(S), here with the help of file parsing technique to perform the transformation on NASA thermodynamic data and to plot the variation of parameters Cp,H & S with respect to Temperature and also to determine the molecular masses of each species provided in the data file.
Objective:
To write a function that extracts the 14 co-efficients and calculates the enthalpy, entropy and specific heats for all the species in the data file by reading file NASA thermodynamic data. The formulae are shown below.
Here,
R is the universal gas constant, T is the temperature
Theory:
File parsing means reading the information from a particular text file or any type of file. This aims at facilitating performing some kind of transformation on the data. Parsing splits a file or other input into pieces of data that can be easily stored or manipulated.
Specific heat(Cp): It is the quantity of heat required to raise the temperature of 1 gram of a substance by 1 degree celsius or it is the amount of heat that must be added to one unit of mass of the substance in order to cause an increase of one unit in temperature.
Enthalpy: It is the sum of the internal energy added to the product of the pressure and volume of the system. Denoted by letter 'H'.
Entropy: It is the measure of randomness or disorder of a system. It is denoted by the letter 'S'. A highly ordered system has low entropy.
Atomic weight: It is the mass of an individual atom of an element is known as its atomic mass.
molecular weight: The molecular mass of a substance is the sum total of the atomic masses of the atoms present in that molecule or compound.
% Code:
clear all % clears the workspace
close all % closes the figure window
clc       % clears the command window


% File opening & reading

f1 = fopen('THERMO.dat','r'); % Opening 'THERMO.dat'file to read. Here 'f1'is pointer to the file

Header=fgetl(f1) % read header of the file

Global_temp=fgetl(f1)

Temp=strsplit(Global_temp,' ') % splits the string or character vector to specified delimiters in the case of Global temp.

Global_low_temp = str2num(Temp{2});  %assigning global low temp
Global_high_temp = str2num(Temp{4}); %assigning global high temp
Global_mid_temp = str2num(Temp{3});  %assigning global mid temp


% Skipping the next 3-lines from the 'THERMO.dat' file
for i= 1:3

fgetl(f1)
end

for j=1:53 % to read the species data for 53 elements


species=fgetl(f1); % getting the first specie

m=strsplit(species,' '); % Split string or character vector at specified delimiter

species_name = m{1};  % changing to character form


low_temp = str2num(m{end-3});  %assigning local low temp
high_temp = str2num(m{end-2}); %assigning local high temp
mid_temp = str2num(m{end-1});  %assigning local mid temp

Temp_range = linspace(low_temp,high_temp,500);% defining the temperature ranges
line1=fgetl(f1); % reading the coefficient data from line 1

% (a1 to a7) are high temp. coefficients & (A8 to A14) are the low temp. coefficient

x1=strfind(line1,'E');
a1 = str2num(line1(1:x1(1)+3));      %storing the 1st coefficient
a2 = str2num(line1(x1(1)+4:x1(2)+3));%storing the 2nd coefficient
a3 = str2num(line1(x1(2)+5:x1(3)+3));%storing the 3rd coefficient
a4 = str2num(line1(x1(3)+4:x1(4)+3));%storing the 4th coefficient
a5 = str2num(line1(x1(4)+4:x1(5)+3));%storing the 5th coefficient

line2=fgetl(f1); % reading the coefficient data from line 2

x2=strfind(line2,'E');
a6 = str2num(line2(1:x2(1)+3));      %storing the 6th coefficient
a7 = str2num(line2(x2(1)+4:x2(2)+3));%storing the 7th coefficient
A8 = str2num(line2(x2(2)+4:x2(3)+3));%storing the 8th coefficient
A9 = str2num(line2(x2(3)+4:x2(4)+3));%storing the 9th coefficient
A10= str2num(line2(x2(4)+4:x2(5)+3));%storing the 10th coefficient

line3=fgetl(f1); % reading the coefficient data from line 2
x3 = strfind(line3,'E');
A11= str2num(line3(1:x3(1)+3));      %storing the 11th coefficient
A12= str2num(line3(x3(1)+4:x3(2)+3));%storing the 12th coefficient
A13= str2num(line3(x3(2)+4:x3(3)+3));%storing the 13th coefficient
A14= str2num(line3(x3(3)+4:x3(4)+3));%storing the 14th coefficient


% calling the thermo_calc function
[Specific_heat,Enthalpy,Entropy] = thermo_calc(a1,a2,a3,a4,a5,a6,a7,A8,A9,A10,A11,A12,A13,A14,Temp_range,mid_temp);

% calculating molecular mass for each species

Elements = ['H','C','N','O','S','A']; % creating array for the given elements
At_wt = [1 12 14 16 32 40]; % Assigning the molecular wt. of each array element in sequential form

mol_wt=0; % initializing the mol_wt

for i = 1:length(species_name) % running for loop for each species

    for j = 1:length(At_wt)  % running for loop to each elements in array

        if strcmp(species_name(i),Elements(j)) % comparing the ith species with jth constituent elements

            mol_wt = mol_wt + At_wt(j); % calculating molecular mass

            p = j; % assigning j value in p variable

        end

    end

    var = str2num(species_name(i)); % converting ith character of species to number

    if(var>1) % var is greater than 1 (i.e more than one atom is present of same type)

        mol_wt = mol_wt + At_wt(p)*(var-1);

    end

end

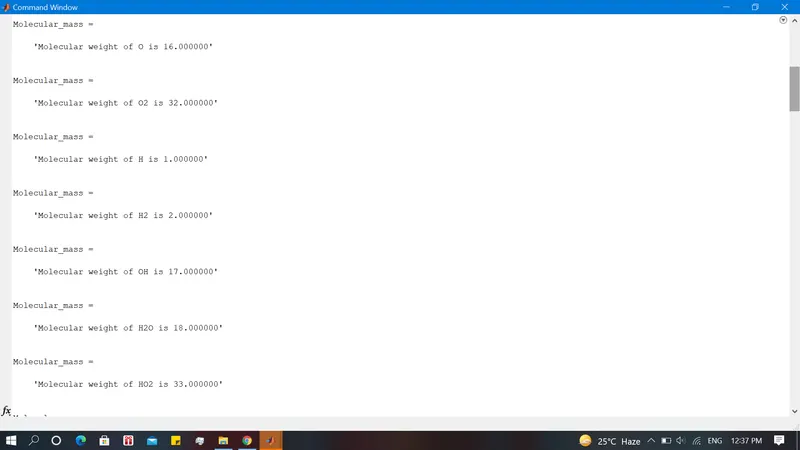
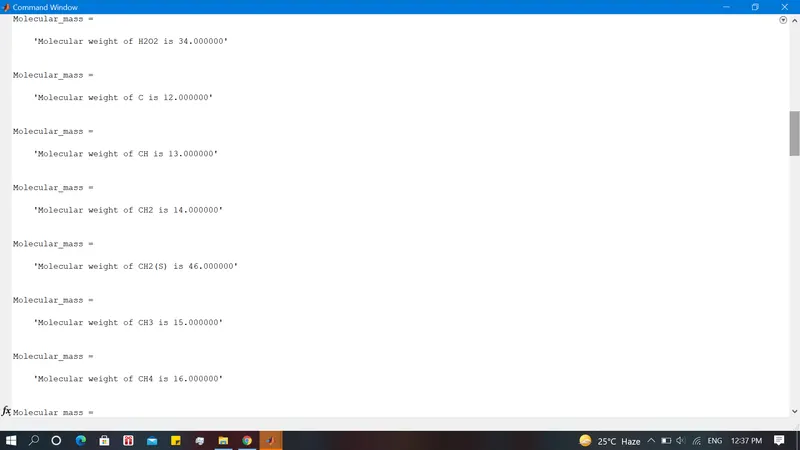
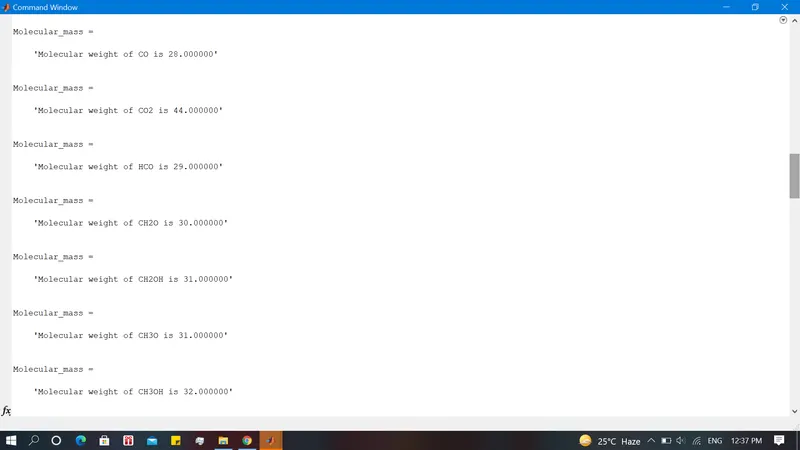
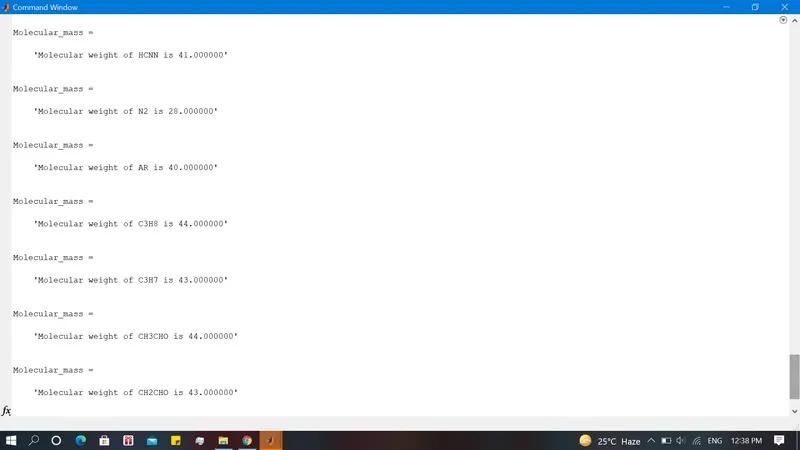
Molecular_mass = sprintf('Molecular weight of %s is %f',species_name,mol_wt) % storing the data in character form


% Plotting the figures for (Sepcific heat, Enthalpy & Entropy w.r.t Temperature)

 figure(1)
 plot(Temp_range,Enthalpy,'linewidth',2,'color','g')
 xlabel('Kelvin(k)')
 ylabel('kJ/mol')
 title('Enthalpy vs Temperature')
 grid on

 figure(2)
 plot(Temp_range,Entropy,'linewidth',2,'color','b')
 xlabel('Kelvin(k)')
 ylabel('kJ/mol')
 title('Entropy vs Temperature')
 grid on

figure(3)
plot(Temp_range,Specific_heat,'LineWidth',2,'color','r')
xlabel('Kelvin(k)')
ylabel('kJ')
title('Specific Heat vs Temperature')
grid on

% Saving the plots that are generated in matlab fig. window

 mkdir('D:\Matlab 21B\FP',species_name)
 cd(species_name)
 saveas(figure(1),'Enthalpy.png') % saving the figure(1) in png format
 saveas(figure(2),'Entropy.png')  % saving the figure(2) in png format
 saveas (figure(3),'Specific_heat.png') % saving the figure(3) in png format
 cd('D:\Matlab 21B\FP') % dumping the plots as images in seperate folder('FP')

end


 fclose(f1) % close file
% Code to calculate(Specific heat, Enthalpy, Entropy):
function [Cp,H,S] = thermo_calc(a1,a2,a3,a4,a5,a6,a7,A8,A9,A10,A11,A12,A13,A14,T,mid_temp)


R = 8.3145; % gas constant


for i = 1:length(T)

 if T(i)<= mid_temp
% % Low
% Specific heat
Cp = (a1 + a2.*T + a3.*(T.^2) + a4.*(T.^3) + a5.*(T.^4))*R;
% Enthalpy(H)
H = (a1 + a2.*(T./2) + a3.*(T.^2)./3 + a4.*(T.^3)./4 + a5.*(T.^4)./5 + a6./T)*R.*T;
% Enropy
S = (a1.*log(T) + a2.*(T) + a3.*(T.^2)./2 + a4.*(T.^3)./3 + a5.*(T.^4)./4 + a7);

 else

% % High
% Specific heat
Cp = (A8 + A9.*T + A10.*(T.^2) + A11.*(T.^3) + A12.*(T.^4))*R;
% Enthalpy(H)
H = (A8 + A9.*(T./2) + A10.*(T.^2)./3 + A11.*(T.^3)./4 + A12.*(T.^4)./5 + A13./T)*R.*T;
% Entropy
S = (A8.*log(T) + A9.*(T) + A10.*(T.^2)./2 + A11.*(T.^3)./3 + A12.*(T.^4)./4 + A14)*R;

 end

end- Explanation of the matlab code:
- First, we open the 'THERMO.dat' file to read the data.
- Then read the Heading, Global temperatures & the next 3 lines.
- Run a for loop for every species.
- Get the species name.
- Get the local temperatures and after converting them to numbers, we assign them in variables.
- Take all the 14-coefficients, 7- low temp. and 7-high temperature coefficients using strsplit().
- Storing all the 14-coefficients and converting to numbers using str2num().
- Calculate the Cp,H & S using the given formula for the two temperature range individually.
- Plot the graph for Specific heat, Enthalpy, Entropy w.r.t Temperature and save in specified folder according to the species name.
- Calculate the molecular mass for each species.
- Close the file.
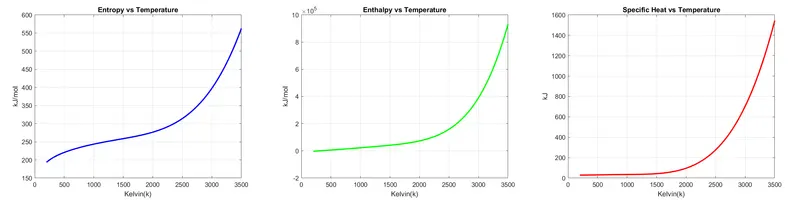
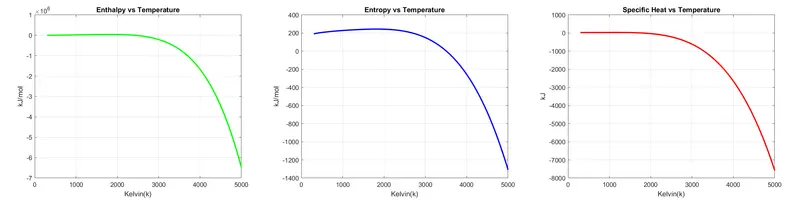
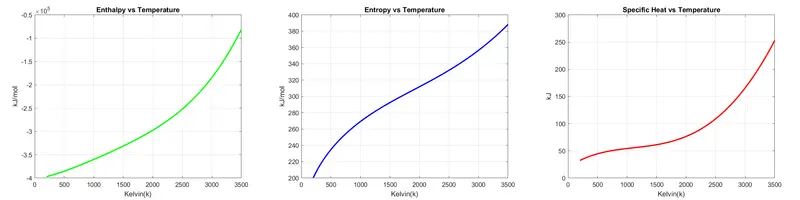
- Output:
- Plot for O2:
- Plot for N2:
- Plot for CO2:
File location where the species are saved:

Output for the molecular weight:
Conclusion: In file parsing, we are able to utilize the data which was provided in 'THERMO.dat' file , performed some transformations on the data as the graph of Specific heat, Enthalpy & Entropy are plotted and molecular weight of species has been calculated.