Week-4 Challenge WOT Condition Part-2
(1) AIM- State The Difference Between The Mapped And Dynamic Models Of Engine, Motor, And Generator? How To Change It?
SOLUTIONS- The difference between the mapped and the dynamic model is:-
| Sr. No |
Mapped | Dynamic |
| 1) | It uses the data saved on the lookup table to run the simulation. | It runs the simulation based on the actual components such as motor, generator, engine, and accessories. |
| 2) | Simulation time is less compared to the Dynamic Model. | Take time due to calculations at real-time activates. |
| 3) | It is used when we have the engine data from a dynamometer or a design tool like GT Power. | It is used when we have the component-level data. |
| 4) | It is used for engine quasi-steady-state engine simulations. |
It is used to study the impact of each engine component on the overall performance. |
To change the model from mapped to dynamic or vice-versa. The steps are as follow:-
- After opening the model, go to the "Variant Manager" under the "Modelling" section from the top bar of Simulink.
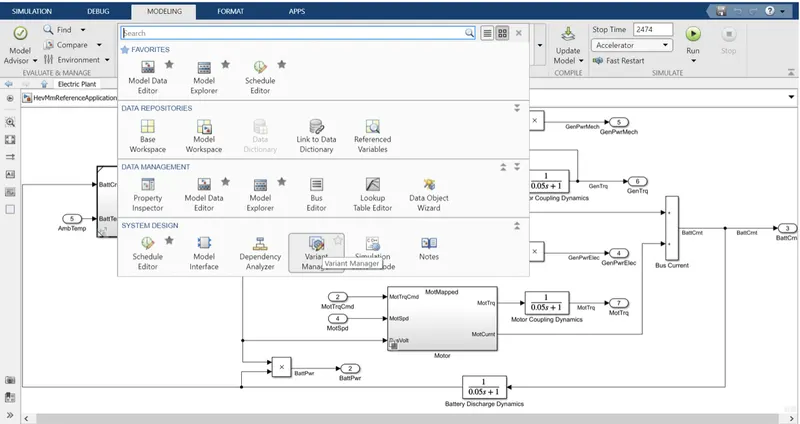
- So a new window will open up in front of us if we wish to change the model type for the "Generator" block. Then click on the "Generator" and two under options will appear i.e "GenDyanmic" & "GenMapped".

- Select the option from "GenDyanmic" or "GenMapped". Hence the model type will be changed.
The process is the same for Motor, Generator, Engine.
(2) AIM- Calculation of Miles Per Gallons. Factors Consider To Model Fuel Flow.
EXPLANATION- In the US, the new unit was formulated i.e. MPGe - Miles Per Gallon Equivalent. It compares the efficiency of the gasoline vehicles with the BEVs, PHEVs, EVs. It has been defined that 1 gallon of gas has the same amount of energy as 33.7 kWh of electricity.
E.g. A battery propels the vehicle for 3 miles per kWh capacity of the battery. So, 3 miles/kWh * 33.7 kWh/gallons = 101.1 MPGe.
In the below model, it is calculated by this block:-
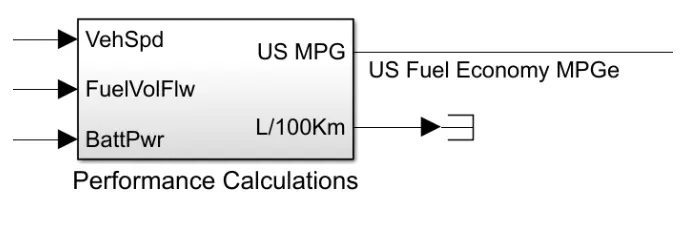
As we can see here the inputs are Vehicle Speed, Fuel Flow, and Battery Power.
Inside the block, MPGe is calculated through some basic arrangements as below:-
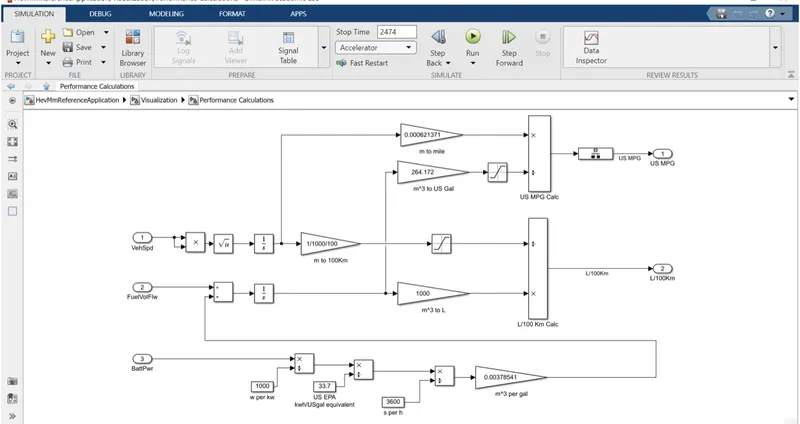
As we know 1 gallon of gas is equal to 33.7 kWh of electricity. So battery power is converted to kW (W/1000) and then it is divided by 33.7, followed by 3600 to convert it into sec. The fuel equivalent of the battery is added to the fuel flow.
The distance of travel is calculated from vehicle speed and time. After finding all such parameters we can calculate fuel efficiency. Hence MPGe is calculated in this way.
(3)AIM- Run The HEV Reference Application With WOT Drive Cycle.
OBJECTIVES- Change the grade and wind velocity in the environment block and comment on the results.
SOLUTION- Open the HEV reference application and then select the drive cycle as WOT Drive Cycle by double clicking on the "Drive Cycle Source".
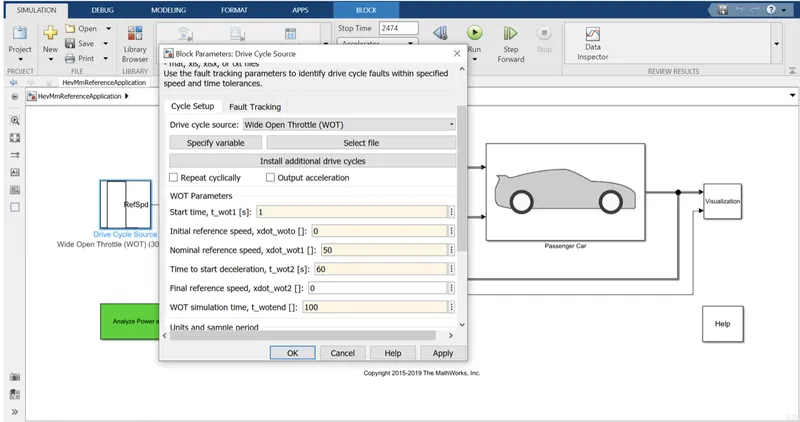
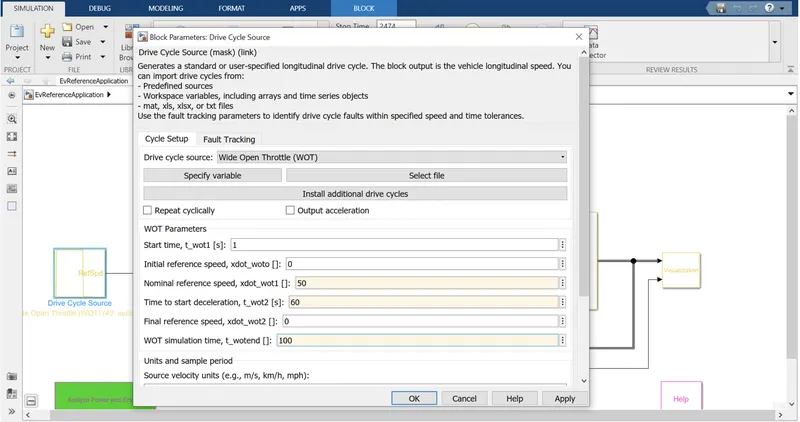
Here the start time is 1 sec, nominal reference speed as 50, time to start deceleration as 60 and WOT time as 100.
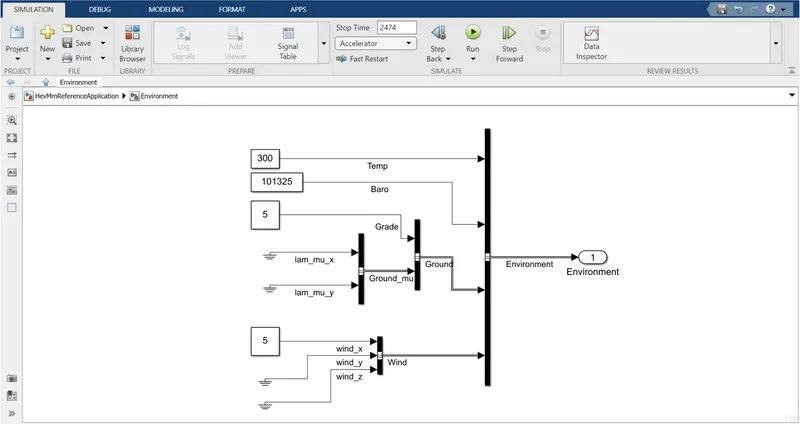
After this, open the "Environmental" block and set the grade as 5, wind velocity as 5 as shown below:-
Now, run the simulation and the graph obtain for the model is as under:-
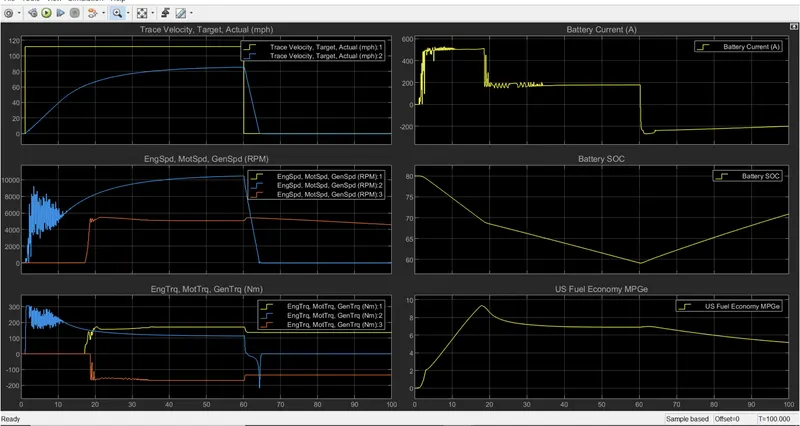
In the above image, the first graph shown the "Trace Velocity". In it the Yellow color is the trageted path for it but in real trace velocity doesn't increases suddenly. Gradually increases to the peak value and then it decreases slightly, final reaches to zero value. The actual path of velocity is shown in Blue color.
The secound graph show that the maximum motor speed is nearly 11000 rpm. The engine and generator starts after 17 sec, it is beacuase the battery SOC drops below 70%. Here after 60 sec the motor starts deceleration and hence battery starts charging, so SOC will starts increasing.
Maximum and minimun battery current (ia) will also get from the graph. In the last graph we see that vehicle gets maximum fuel efficiency of 9.6 at 18th sec, it is when the engine getting started.
(4)AIM- Compare The Simulated Results Of Hybrid And Pure Electric Powertrains.
OBJECTIVE- Keeping all other parameters same.
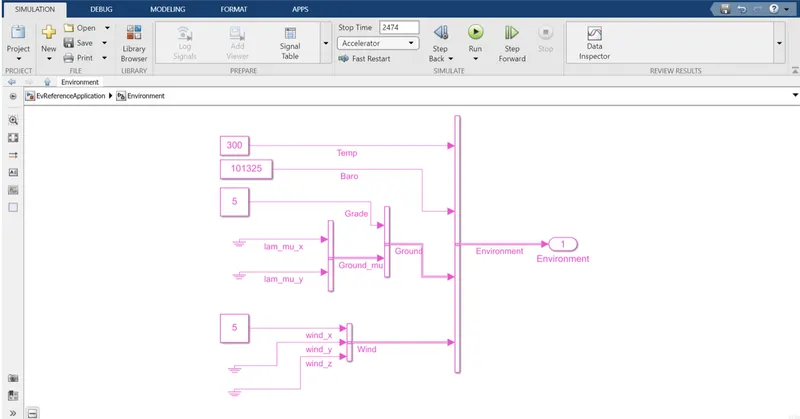
SOLUTION- Run the simulation for EV powertrain with grade and wind velocity both as 5. Drive is same as above HEV case as shown below:-
The grade and wind velocity as 5.
The output for the model is as shown below:-
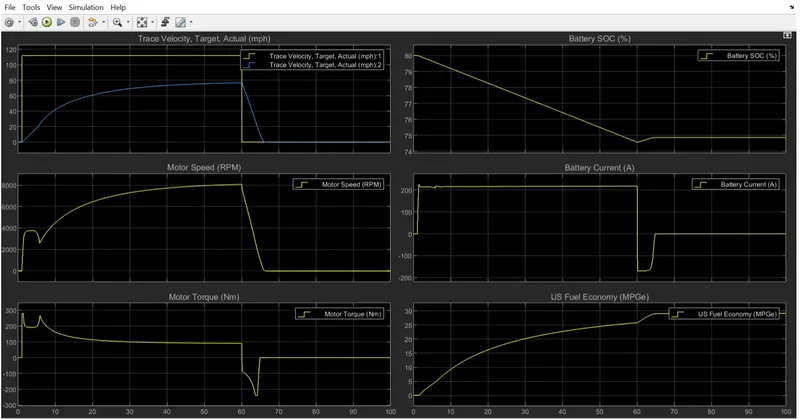
COMPARISON:-
- We can say that the Trace Velocity for HEV and EV model is similar.
- Coming to battery current, in HEV it reaches to 500 during starting and as egine starts after some time, it reduces to 198. It stays negative in value (regenerative braking) for longer period of time in HEV as compared to EV.
- In HEV battery SOC is improvement to nearly 14% while in EV it increases to 1% only.
- The motor torque and speed is very fluctuating for HEV while it is more stable in EV powertrain.
- As electric motor is more efficient than engine, the fuel economy of EV is greater than HEV.