Week - 4
(1)AIM- Control Logic Circuit Of Washing Machine.
OBJECTIVES- If Power Supply is ON then system Activated
If Water Supply is OFF then stop the process and indicate through LED
Soaking Time- 200sec, Washing Time- 100sec, Rinsing Time- 20sec, Drying Time- 50sec.
Show LED after the finish.
CONNECTIONS- Firstly, take a "Chart" block from the library browser and add 7 "State". Connect them and edit the "State" name along with the entry & exit condition value. Also, add the conditions as given for different "State" to activate as shown below figure.
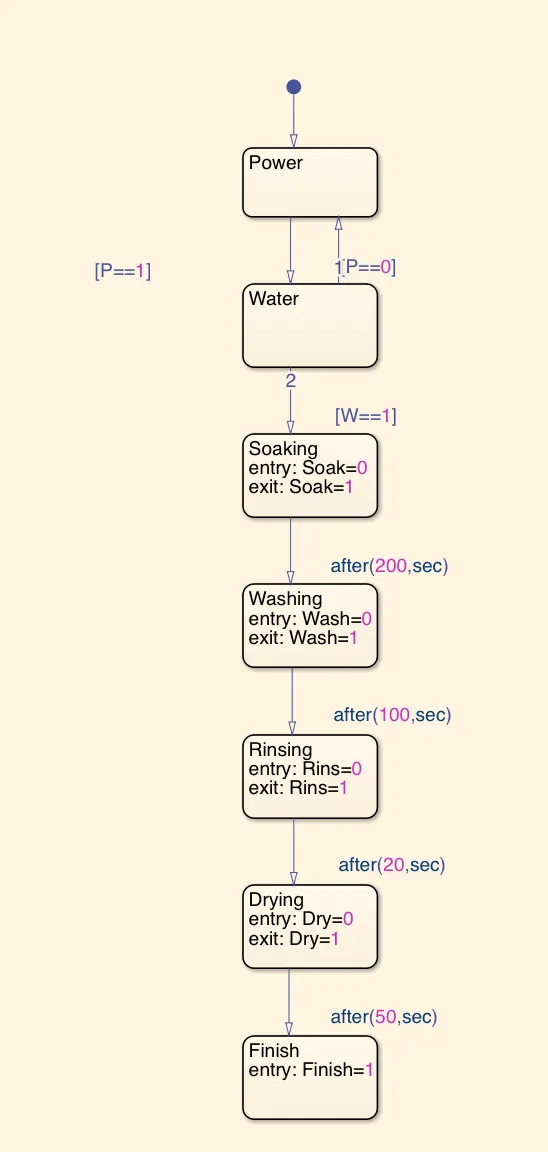
After arranging all the "State" and conditions, open "Symbols Pane" and give P & W as input data and the remaining as output data.
Now come out of the "Chart" block and connect the "Constant" block with P & W separately. Take two "Slider Switch" and connect them with the "Constant" block as one for one. Connect the output ports of the "Chart" block to "Display" respectively and one "Lamp" for each output signal. Also, connect each input signal to one "Lamp".
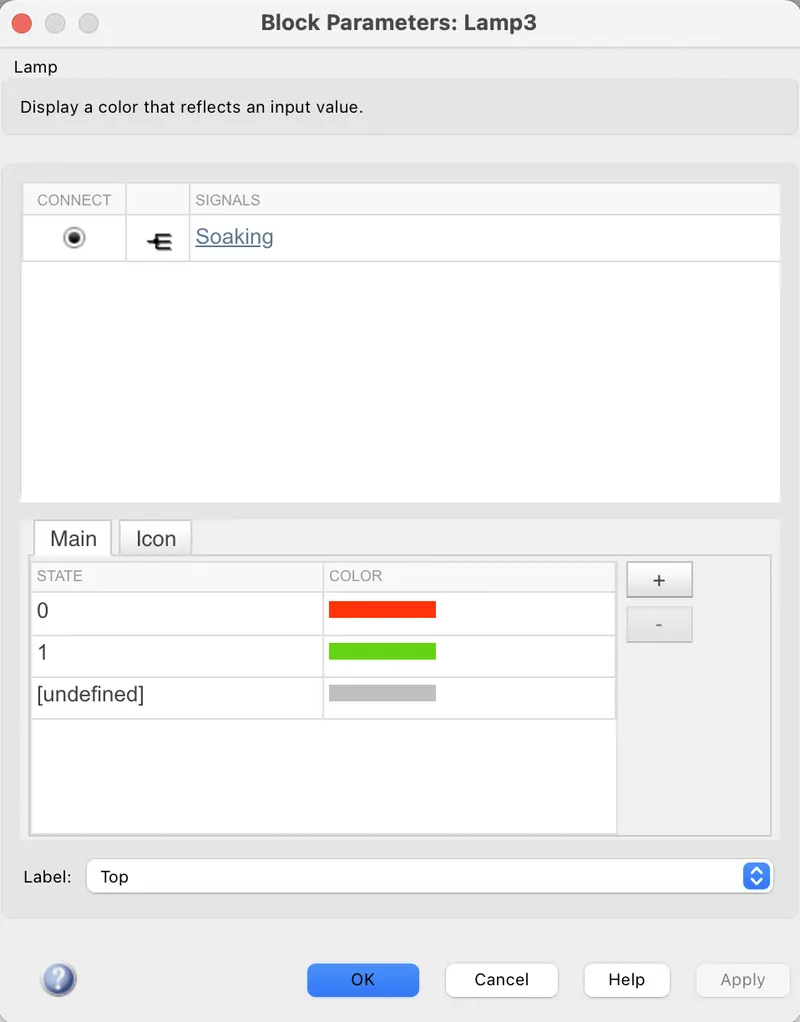
After connecting "Lamp" set the parameter of "Lamp" as a RED light for value 0 and a GREEN light for value 1 for each and every "Lamp".
MODEL-
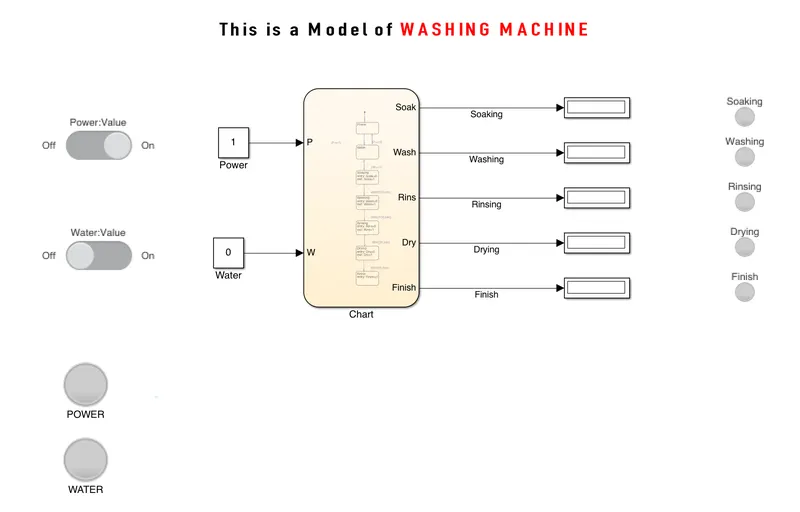
WORKING- The first step was to set the "Stop Time" to 500sec. Now when the power button was OFF, the system will not be activated and all indicators show RED light.
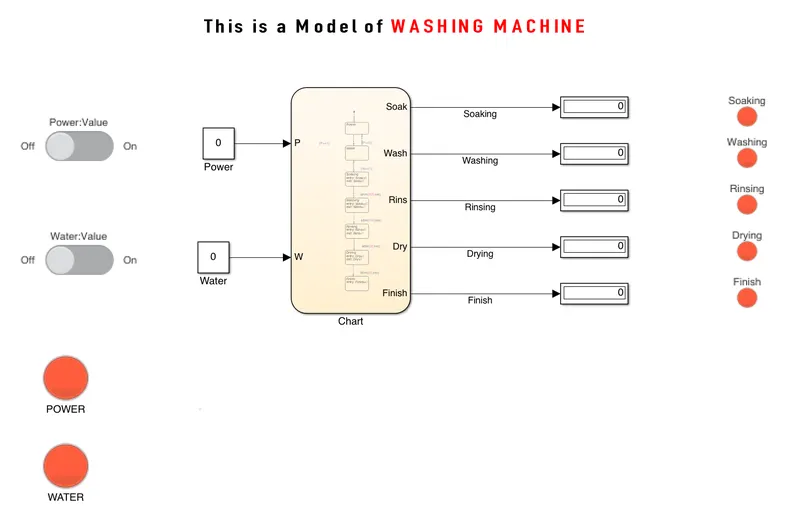
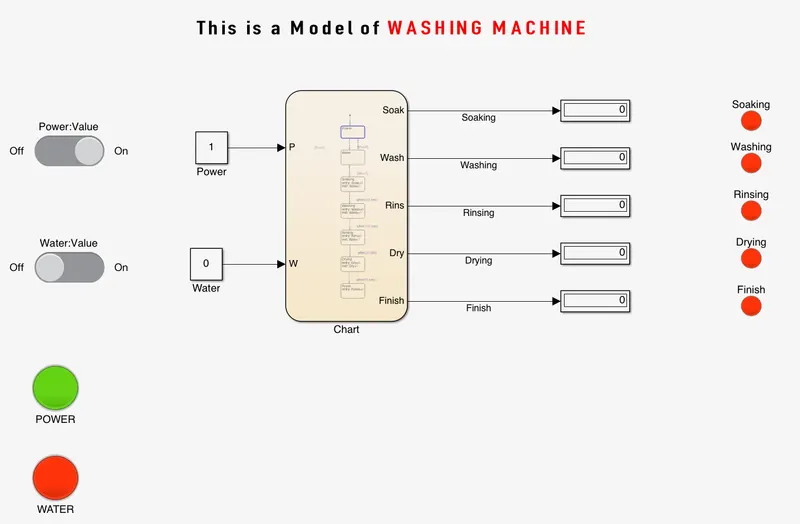
When the power button was ON, the system was activated but due to NO water supply the process stops and the indicator for water supply as well as all step indicator shows RED light.
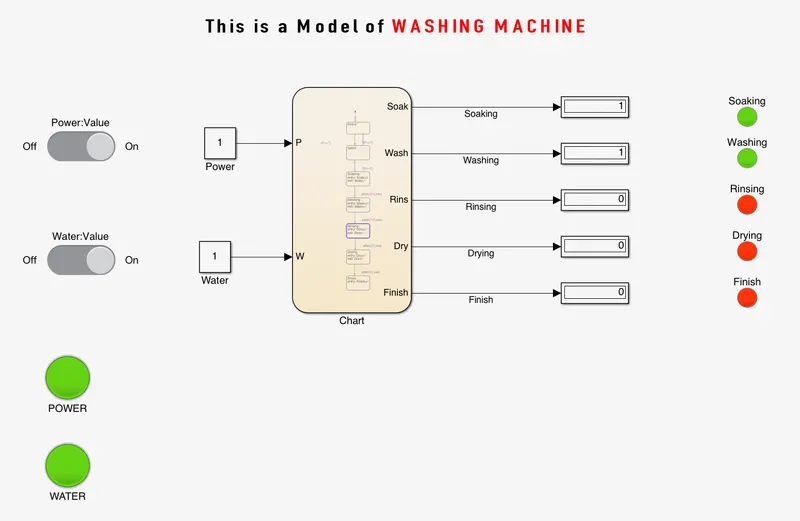
If the water supply was also ON then the process starts and follows the steps of washing as per conditions. As the steps were completed one by one the indicator shows GREEN light for that process.
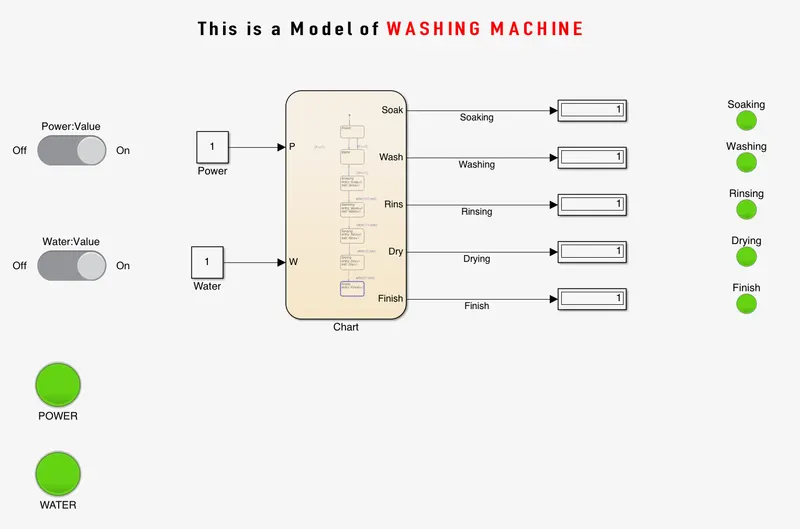
When all the processes were completed, the finish LED along with other indicators shows a GREEN light.
(2)AIM- Model a Simulink Chart for Gear Shift
OBJECTIVES- Different gear corresponding to speed as given. Change the speed while the simulation is running and display the gear number.
CONNECTIONS- Firstly, take a "Chart" block from the library browser and add 6 "State". Connect them and edit the "State" name along with the entry condition value. Also, add the conditions as given for different "State" to activate as shown below figure.
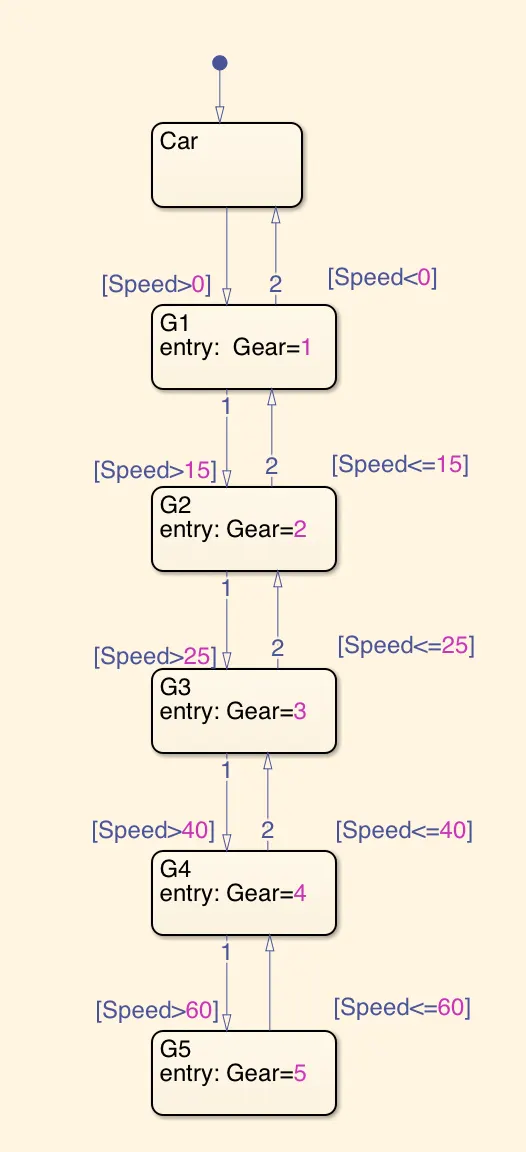
After arranging all the "State" and conditions, open "Symbols Pane" and give "Speed" as input data and the "Gear" as output data.
Now come out of the "Chart" block and connect the input port of the "Chart" block with the output port of the "Slider Gain" block. Add the "Constant" block and connect it with the input port of the "Slider Gain" block. Edit the name of the "Chart" block as "Gear Box".
To view the gear number, connect the "Display" block with the output port of "Gear Box".
MODEL-
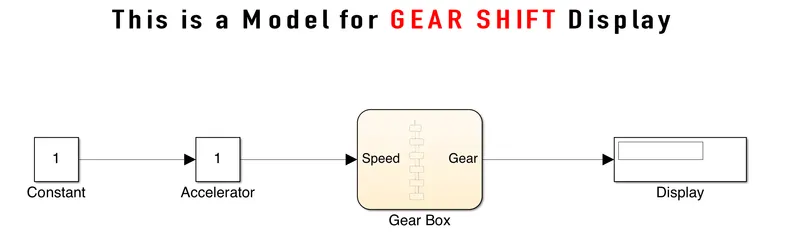
WORKING- As we had to change the speed while the simulation was running, so for that we had to set the "Stop Time" to "inf" i.e. Infinity.

As per data, we get the 5th gear after 60kmph speed so for that we had to set Slider Gain high point above 60. Here we had set Low Point=0 and High Point=100.
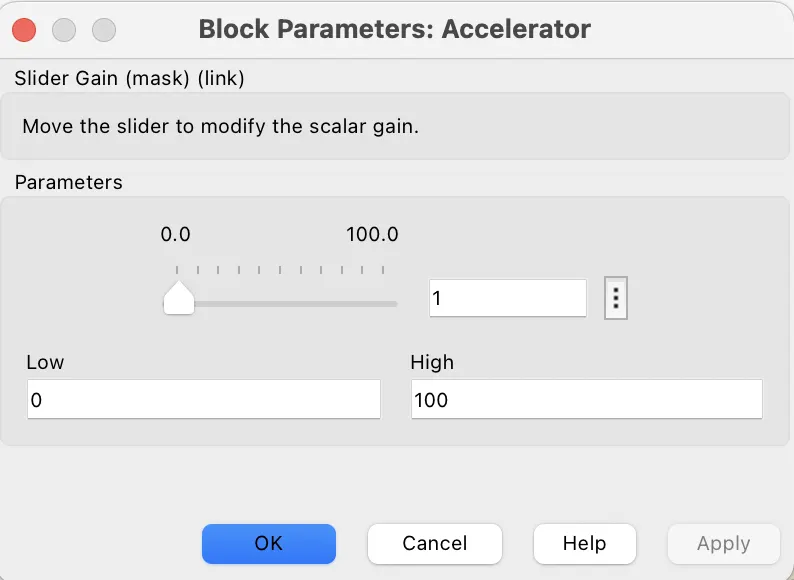
Now we had to start the simulation and open the Slider Gain by double-clicking it and change the speed by sliding the bar shown there between 0 to 100. As the speed varies the Gear changes and the Gear number was shown on Display.
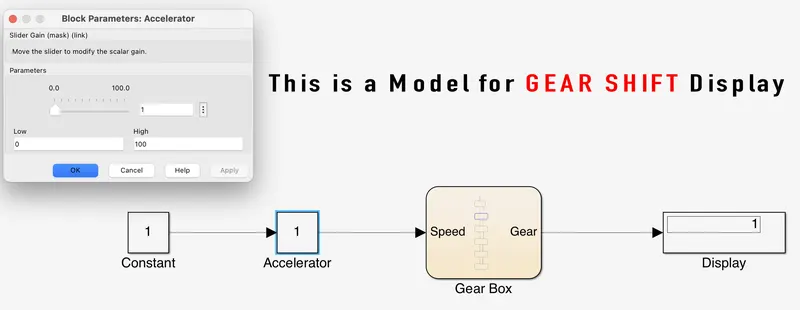
As we can see above there is a speed of 1kmph so Display was shown 1 as Gear Number.
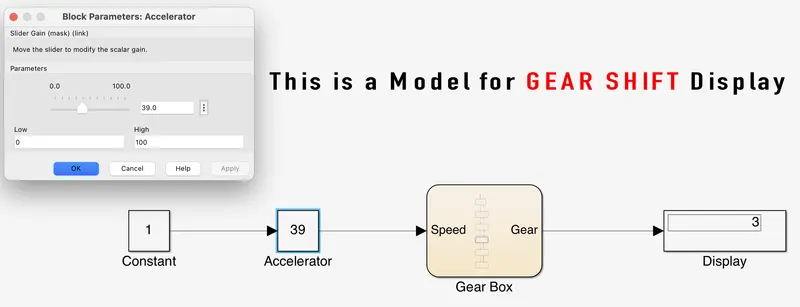
See as the slider bar moved to 39, the Display was showing 3 as Gear Number.
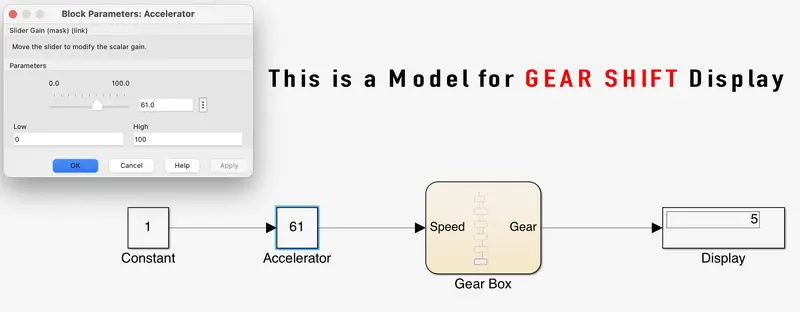
Final Gear(5) was shown when the slider moved to 61 i.e. 61kmph.