Week-4 Challenge WOT Condition Part-2
WEEK – 4
CHALLENGE WOT CONDITION PART-2
- What is the difference between mapped and dynamic model of engine, motor, and generator? How can you change model type?
Mapped Model:
It is the fast level simulation.
This is used to steady state data driven model.
It contains many subsystems.
Dynamic Model:
This is component level data simulation. .
It contains physical signals.
If you need more data.
|
Description |
Mapped |
Dynamic |
|
Block of engine |
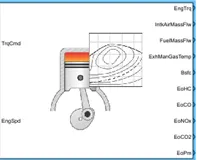 |
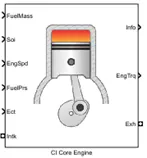 |
|
Block of motor |
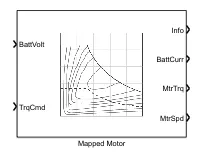 |
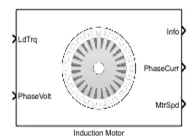 |
|
Control requirements |
System level for steady state data commands |
Component level for physical signals |
|
Data |
Import the set of steady state data |
More data needed |
How can you change model type?
Use the look-up tables for steady state data for import the matlab commands. It is operates set of steady state commands.
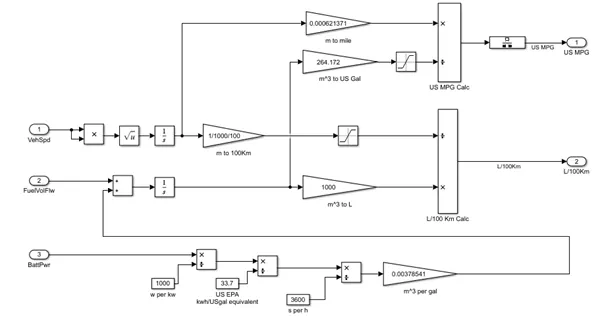
- How does the model calculate miles per gallon? Which factors are considered to model fuel flow?
Example of question 3 or 4 for fuel flow in visualization block model
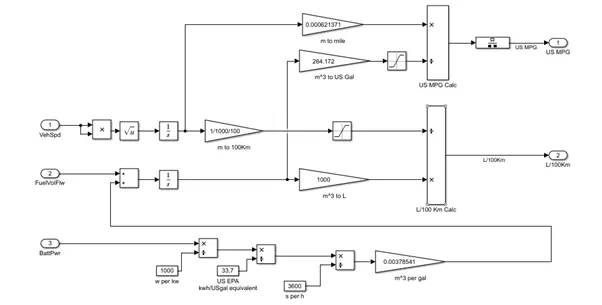
1 liter = 0.264gallon
1 mile = 1.609kilo meter
Which factors are considered to model fuel flow?
Vehicle speed, fuel volume, Battery power
- Run the HEV Reference application with WOT drive cycle. Change the grade and wind velocity in the environment block. Comment on the results.
HEV SIMULINK MODEL
The hybrid electric vehicle reference application represents a full multimode hybrid electric vehicle (HEV) model with an internal combustion engine, transmission, battery, motor, generator, and associated powertrain control algorithms. Use the reference application for powertrain matching analysis and component selection, control and diagnostic algorithm design, and hardware-in-the-loop (HIL) testing. To create and open a working copy of the hybrid electric vehicle reference application project,
By default, the HEV multimode reference application is configured with:
Mapped motor and generator
1.5–L spark-ignition (SI) dynamic engine
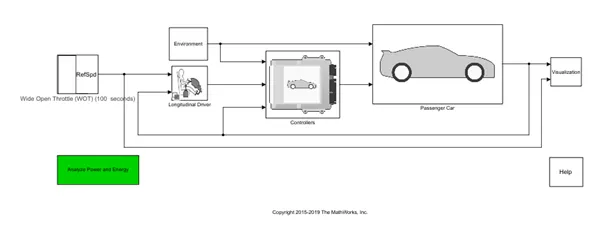
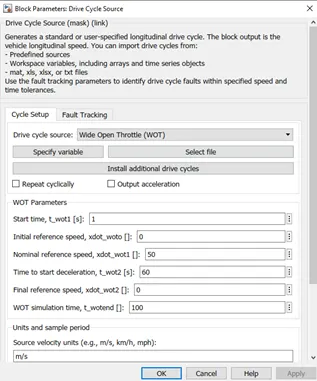
Drive Cycle Source block — WOT (100 seconds)
Generates a standard or user-specified drive cycle velocity versus time profile. Block output is the selected or specified vehicle longitudinal speed.
In this model the driving source is used for Wide Open Throttle (WOT) in 100sec. The parameters is the below the figure.
Environment subsystem
Creates environment variables, including road grade, wind velocity, and atmospheric temperature and pressure.
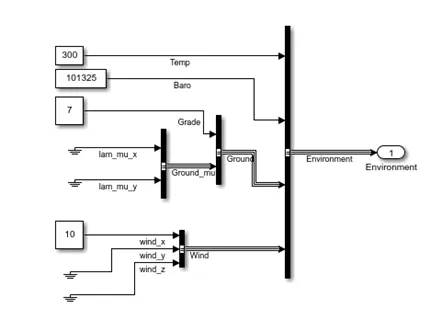
In this block changed the value of the Grade and Wind velocity.
Grade = 7
Wind velocity = 10
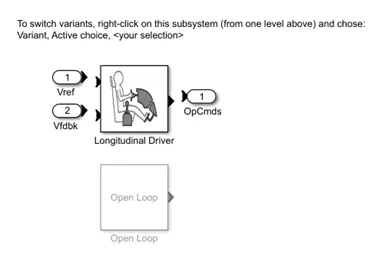
Longitudinal Driver subsystem
Uses the Longitudinal Driver or Open Loop variant to generate normalized acceleration and braking commands.
Longitudinal Driver variant implements a driver model that uses vehicle target and reference velocities.
Open Loop variant allows you to configure the acceleration, deceleration, gear, and clutch commands with constant or signal-based inputs.
Controllers subsystem
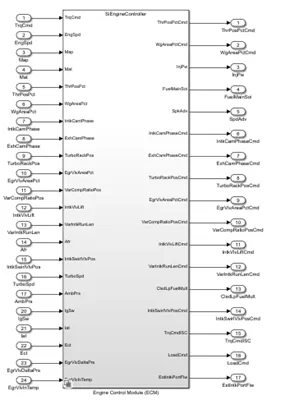
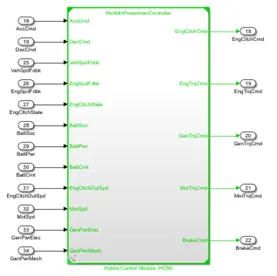
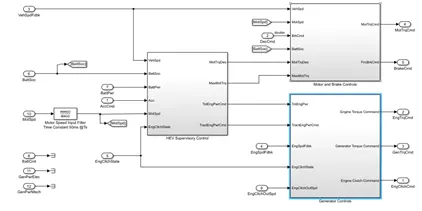
Implements a powertrain control module (PCM) containing a hybrid control module (HCM) and an engine control module (ECM).
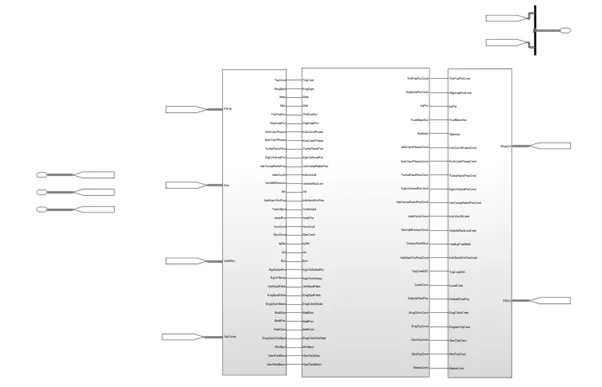
Sub System of Power train Control Module (PCM)
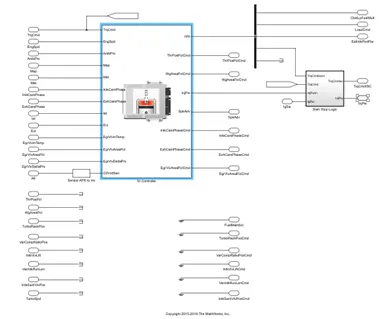
Sub System of Hybrid Control Module (HCM)
Passenger Car subsystem
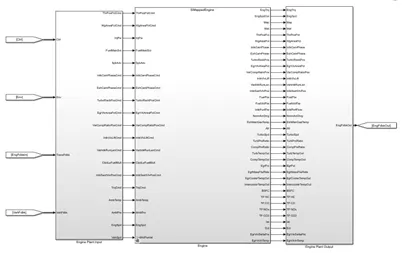
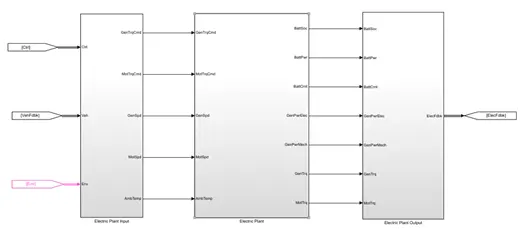
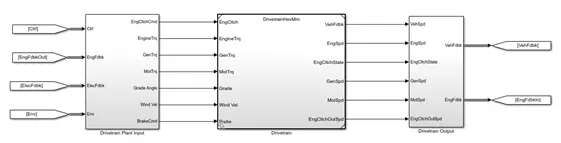
Implements a hybrid passenger car that contains engine, electric plant, and drivetrain subsystems.
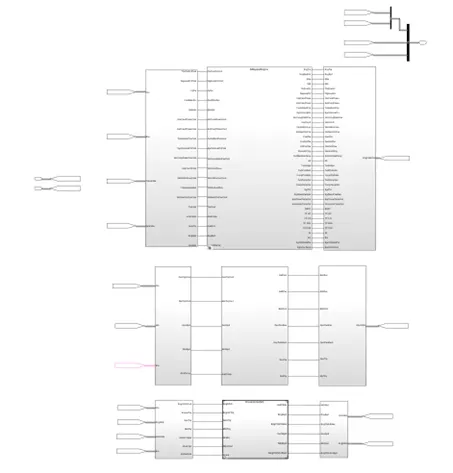
Sub System of Engine
Sub System of Electric
Sub System of Drivetrain
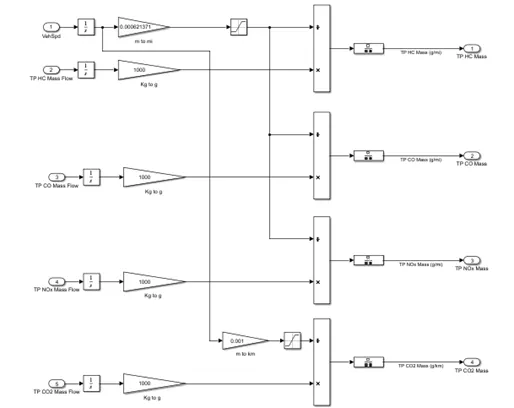
Visualization subsystem
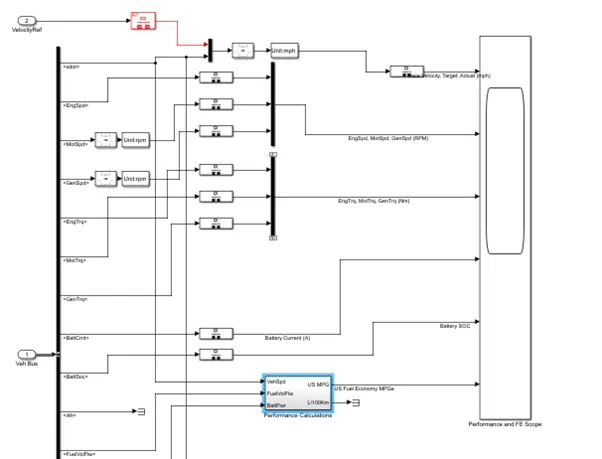
Displays vehicle-level performance, battery state of charge (SOC), fuel economy, and emission results that are useful for powertrain matching and component selection analysis.
Sub System of Performance calculations (MPG)
Sub System of Emission
Results :
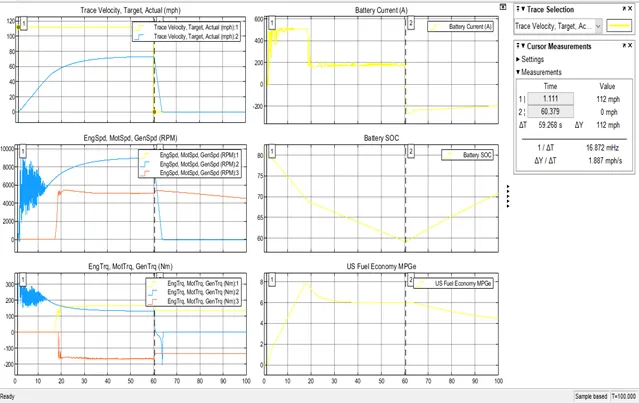
In this model results showing the 6 plots are velocity, RPM, Torque, Battery current & State of Charge and fuel economy MPG.
WOT Start to deceleration = 60sec
WOT Stop time = 100sec
Over all plots considered to the accelerating time only.
PLOT 1
In this plot for the miles per hour (mph) travel for the vehicle with a time. Initially the start to acceleration 1 sec in 112 mph upto 60 sec. after the 60sec the vehicle decelerating so vehicle zero velocity.
PLOT 2
In this plot for RPM in engine, motor and generator. The engine and generator RPM is same and motor RPM is greater than the engine RPM. The motor RPM reach the nearly 8500RPM in 60sec.then after decelerating.
PLOT 3
In this plot for the Torque in engine, motor and generator. Initially the engine and generator torque is the zero in still 18sec. after the 18 sec this torque for engine is positive and generator negative region. Then motor torque initially high (300N.m). the time of acceleration the motor torque is constant for 120N.m.
Decelerating time of motor torque is zero and engine torque is positively 120N.m and generator torque is Negatively -120N.m.
PLOT 4
This plot for Battery current (A). The battery current initially the time of acceleration that current taken by the 500amp in still 18sec. after the generator action to be taken so the current to be reduced upto 60sec. then decelerating time of current is negatively charged by the -200amp.
PLOT 5
This plot for Battery State of Charge (SOC). Initially the battery taken for the 80% of Charge. The accelerating time of Starting the battery charge to be linearly decreased still 60sec. In decelerating time the battery to be again charged by linearly.
PLOT 6
In this plot for US fuel economy MPG (Miles Per Gallon). This plot shows the fuel is used for particular time. In accelerating time the fuel consumed 8MPG for Motor and battery. The generator action is after 18sec so the fuel consumed 6MPG. Decelerating time fuel consumed for 4MPG.
- Keeping all other parameter same, compare the simulated results of hybrid and pure electric powertrains.
Simulink Model Pure EV
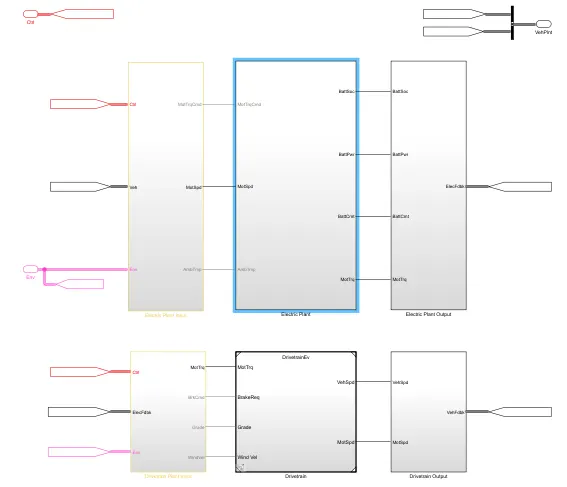
The electric vehicle reference application represents a full electric vehicle model with a motor-generator, battery, direct-drive transmission, and associated powertrain control algorithms. Use the electric vehicle reference application for powertrain matching analysis and component selection, control and diagnostic algorithm design, and hardware-in-the-loop (HIL) testing. To create and open a working copy of the conventional vehicle reference application project
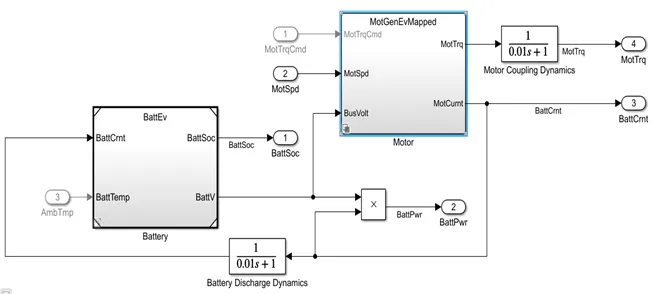
The electric vehicle reference application is configured with a mapped motor and battery.
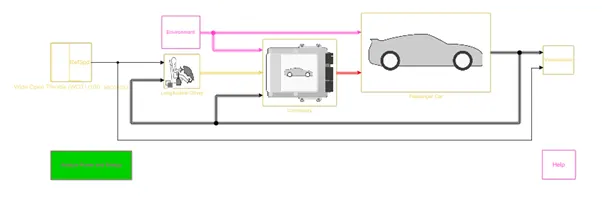
In this model same as the HEV model but controllers and passenger car blocks are slightly different due to pure electric vehicle.
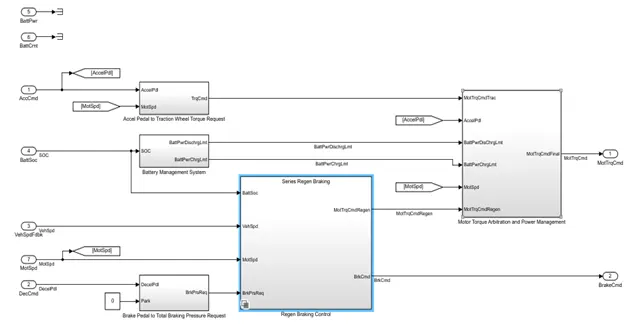
CONTROLLER
To determine the motor torque and brake pressure commands, the reference application implements a supervisory controller. Specifically, the controller subsystem includes a powertrain control module (PCM) with:
Regenerative braking control
Motor torque arbitration and power management
- Converts the driver accelerator pedal signal to a torque request.
- Converts the driver brake pedal signal to a brake pressure request.
- The algorithm multiplies the brake pedal signal by a maximum brake pressure.
- Implements a regenerative braking algorithm for the traction motor to recover the maximum amount of kinetic energy from the vehicle.
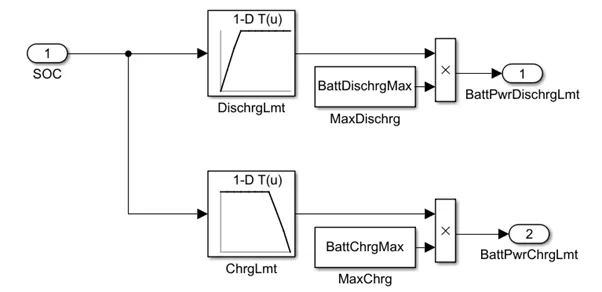
- Implements a virtual battery management system.
- The algorithm outputs the dynamic discharge and charge power limits as functions of battery state of charge (SOC).
- Implements a power management algorithm that ensures the battery dynamic discharge and charge power limits are not exceeded.
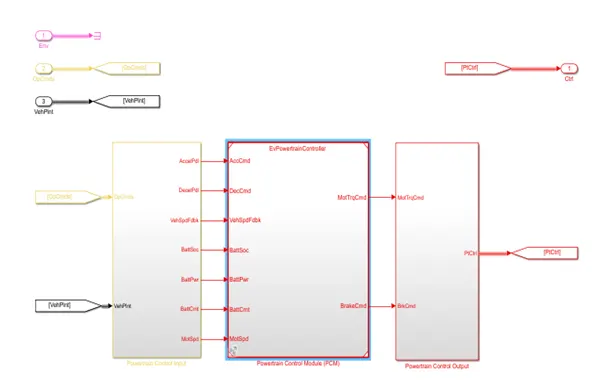
SUBSYSTEM OF PCM SUBSYSTEM
SUBSYSTEM OF BATTERY MANAGEMENT SYSTEM
SUBSYSTEM OF PASSENGER CAR
SUBSYSTEM OF ELECTRIC PLANT
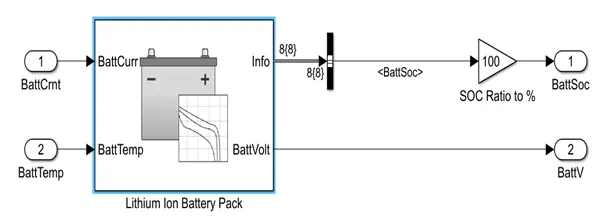
SUBSYSTEM OF BATTERY
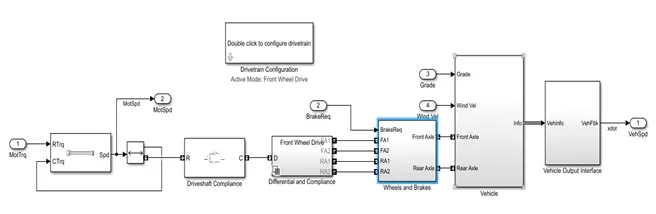
SUBSYSTEM OF DRIVETRAIN
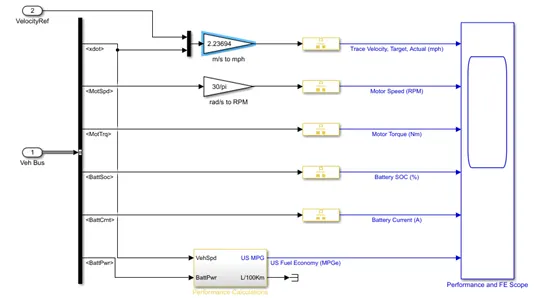
SUBSYSTEM OF VISULIZATION
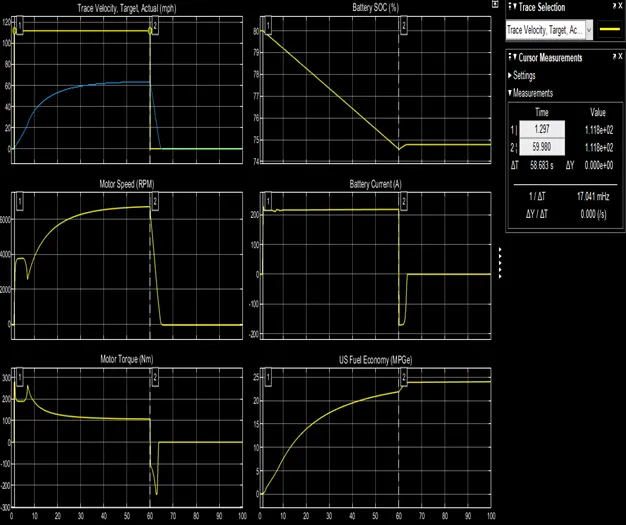
OUTPUT
In this scope for performance of vehicle plots are velocity, Speed, Torque, Fuel economy, Battery SOC and current. The accelerating time is 60sec. decelerating time after the 60sec the vehicle performance is to be stopped. i.e. zero.
COMPARE FOR HEV AND PURE EV
|
Description |
HEV |
EV |
|
Blocks used |
Generator, Battery, Motor, Gear, Engine, Differential, Clutch, Wheel and Brake. |
Battery, Motor, Gear, Differential, Wheel and Brakes |
|
Model |
Both Dynamic and Mapped |
Mapped Model |
|
Maximum RPM |
8500 RPM |
6700 RPM |
|
Maximum Torque |
300 N.m |
280 N.m |
|
Battery current |
500 A |
220 A |
|
Battery SOC |
80 % |
80 % |
|
Fuel MPG |
8 MPG |
21 MPG |
|
Accelerating time |
1-60sec |
1-60sec |
|
Decelerating time |
The fuel economy decrease depends on fuel |
Fuel increases depends on battery power. |