Week - 4
WEEK 4 CHALLENGES
QUESTIONS
- Implement control logic of a “washing machine” using Stateflow as per given sequence:
- If the power supply is available, the system gets activated
- If the Water supply is not available, stop the process & indicate through LED
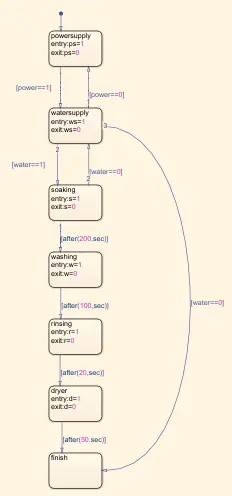
- Soaking time should be 200s followed by Washing time of 100s.
- Then rinsing happens for next 20s & dryer runs for 50s
After all the processes have completed turn on the finished LED
2. Make a Simulink chart for the “Gear shift” logic as per below conditions:
Speed Range(kmph) Gear
0 to 15 1
16 to 25 2
26 to 40 3
41 to 60 4
Above 61 5
Give speed input while the simulation is running & display the gear number.
1. WASHING MACHINE
Aim :
To Implement control logic of a “washing machine” using Stateflow as per given sequence:
- If the power supply is available, the system gets activated
- If the Water supply is not available, stop the process & indicate through LED
- Soaking time should be 200s followed by Washing time of 100s.
- Then rinsing happens for next 20s & dryer runs for 50s
After all the processes have completed turn on the finished LED
Requirements :
chart,
constant,
manual switch,
mux,
display,
scope,
lamp
Simulink diagram for model:
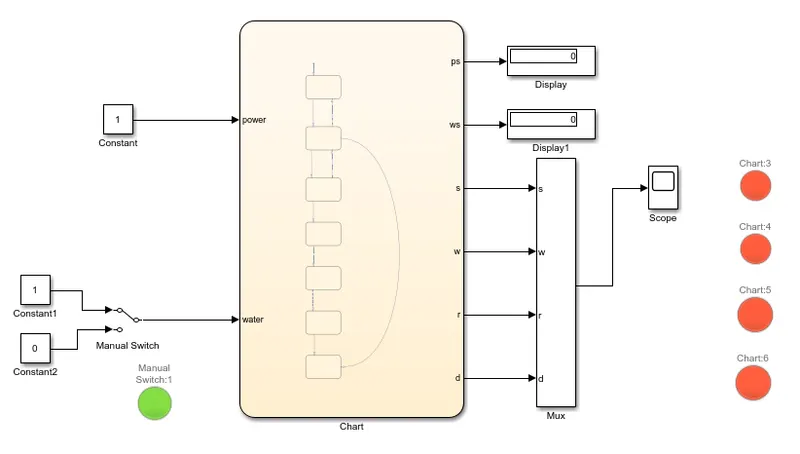
Block expanation:
All blocks function to the logic function (1 0r 0).
1. Constant
There are 3 constant block is used to the model. 1 constant block used to the power supply and remain constant block using water supply. this function of logic (1 or 0).An 1 is on condition and 0 is off condition. therefore, 1 is constant block input value the power is ON condition and 0 is the OFF condition. similarly, water suppy is respectively.
2. Chart :
A finite state machine is a representation of an event-driven (reactive) system. In an event-driven system, the system responds to an event by making a transition from one state (mode) to another. This transition occurs if the condition defining the change is true.
A Stateflow chart is a graphical representation of a finite state machine. States and transitions form the basic elements of the system. You can also represent stateless flow charts.
For example, you can use Stateflow charts to control a physical plant in response to events such as a temperature and pressure sensors, clocks, and user-driven events.
You can also use a state machine to represent the automatic transmission of a car. The transmission has these operating states: park, reverse, neutral, drive, and low. As the driver shifts from one position to another, the system makes a transition from one state to another, for example, from park to reverse.
A Stateflow chart can use MATLAB or C as the action language to implement control logic.
3. Manual switch
The switch operated to the manually. this is input of the constant block. the switch operated to the logic function. this output of the port is connected to the water supply and internally connect with led lamp. the lamp is used to the indicate the water supply( 1 0r 0 ). normally manual switch position upward and down ward. up-ward is 1 and downward is 0.
4. Mux
Mux is used to the more input and single output.it is input port connect to the soaking,washing,rinsing and dryer process. the output port is connect to the scope.
5. Scope
Scope is used to the visualize the output signal.
6. Lamp
there are 5 lamps used this model. lamps are connect to several input and outputs.5 lamps different colour is used for different processing purpose.
Chart Model:
Graph:
Working :
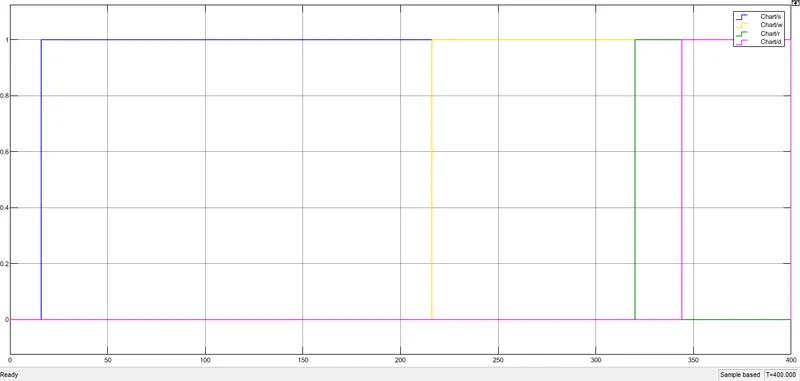
when power supply and water supply is 1. so this is activated and led is blinking (green colour). after the chart condition put the value of 1st starting soaking is activated 200sec the led blinking in blue colour. after the 100sec delay the washing is activated the led blinking in yellow colour. after the 20sec delay the rinsing is activated the led blinking in green colour and then dryer is runs 50sec. finally the process is complete the all led blinking in red colour. the output ports are operated the logic function(1 or 0).1 is activated corresponding led blinking in different colour for differnet processing. 0 is activated all the led blinking in red color. water supply is not available that is 0 then all the process for stopped.
Results:
Thus the control logic of a “washing machine” using Stateflow was implemented.
2. gear shift
Aim :
To Make a Simulink chart for the “Gear shift” logic as per below conditions:
| Speed Range(kmph) | Gear |
| 0 to 15 | 1 |
| 16 to 25 | 2 |
| 26 to 40 | 3 |
| 41 to 60 | 4 |
| Above 61 | 5 |
Give speed input while the simulation is running & display the gear number.
Requirements:
Chart,
constant,
Slider gain,
Display
Simulink diagram for model:
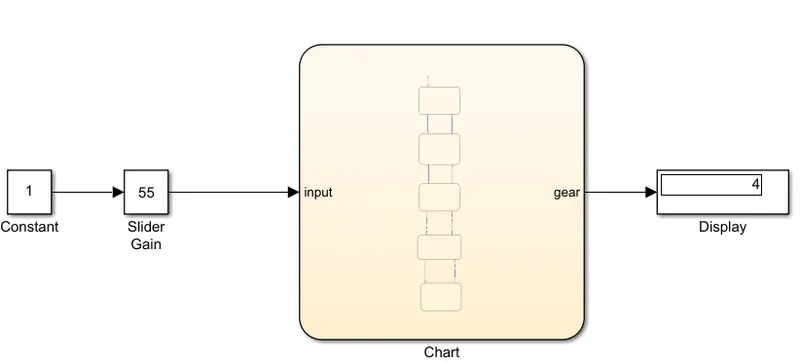
Chart for this model:
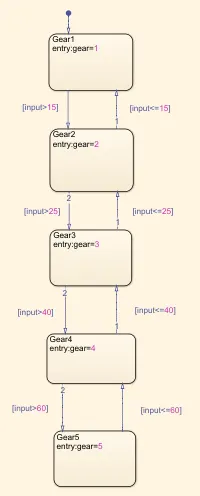
Block explanation:
1. Chart
A finite state machine is a representation of an event-driven (reactive) system. In an event-driven system, the system responds to an event by making a transition from one state (mode) to another. This transition occurs if the condition defining the change is true.
A Stateflow chart is a graphical representation of a finite state machine. States and transitions form the basic elements of the system. You can also represent stateless flow charts.
For example, you can use Stateflow charts to control a physical plant in response to events such as a temperature and pressure sensors, clocks, and user-driven events.
You can also use a state machine to represent the automatic transmission of a car. The transmission has these operating states: park, reverse, neutral, drive, and low. As the driver shifts from one position to another, the system makes a transition from one state to another, for example, from park to reverse.
A Stateflow chart can use MATLAB or C as the action language to implement control logic.
2. Slider gain :
The Slider Gain block performs a scalar gain that you can modify during simulation. Modify the gain using the slider parameter. the slider gain is used to the model for thorttle. it is input of the constant block and when range between the 0 to 100 kmph.
3. Display:
Display is used to the visualize the output.that is corresponding gear shift is visble for a model.
Working:
| Speed Range(kmph) | Gear |
| 0 to 15 | 1 |
| 16 to 25 | 2 |
| 26 to 40 | 3 |
| 41 to 60 | 4 |
| Above 61 | 5 |
then the speed range is 12 the output of the gear is 1. all speed range for operate a above table.
Results;
Thus the Simulink chart for the “Gear shift” logic was implemented.