Week-4 Challenge WOT Condition Part-2
1. What is the difference between mapped and dynamic model of engine, motor and generator? How can you change model type?
Mapped models are simpler data-based models of a physical system where Look Up Tables (LUTs) are employed to simulate the system. They are generally used to capture the quasi-stationary behavior of the system. The main advantage with such models is that they result in lower simulation times. However, they could take-up a larger storage space to keep the LUT data and would not capture the dynamic behaviour of the system.
Dynamic models are models of a physical system that captures its dynamic behavior i.e.. it's transient response. These models are generally built using further sub-systems/simulink blocks to implement the mathematical equations that describe the system dynamics. However, these models generally result in higher simulation time.
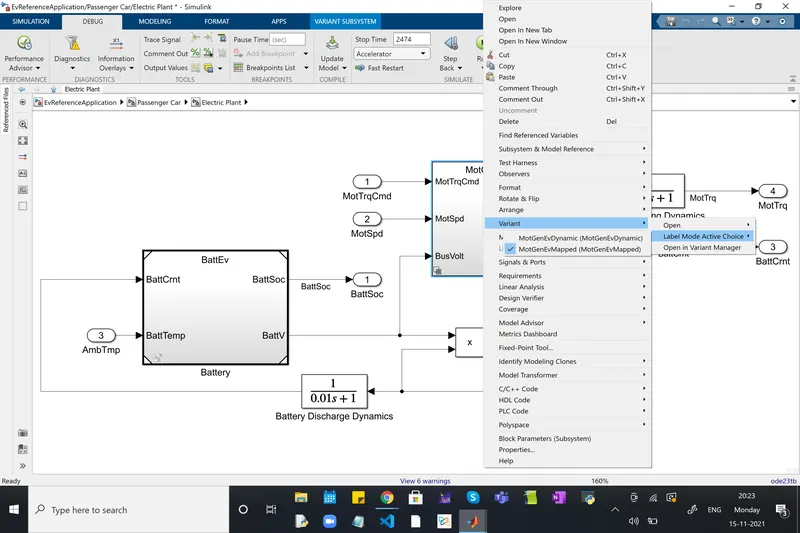
In the power-train block-set, the model-type can be changed by simply using the 'variant' option when 'right-clicked' on the model. As illustrated below for the motor model.
2. How does the model calculate miles per gallon? Which factors are considered to model fuel flow?
The calculations of the miles per gallon is carried out in the 'Performance Calculations' block as shown in the figure below. Here, two factors are used to compute the miles per gallon- Vehicle speed (VehSpd) and the battery power consumed (BattPwr). Using these signals, the following main steps are followed,
- The equivalent amount of gallons for battery power is obtained according the US EPA standards.
- The so obtained instantaneous amount of fuel is integrated over time to obtained the total/accumulated fuel.
- The Vehicle speed is integrated over time to obtain the distance travelled by the vehicle.
- The distance traveled is divided by the fuel consumed giving us the fuel consumption value (in miles per gallon)
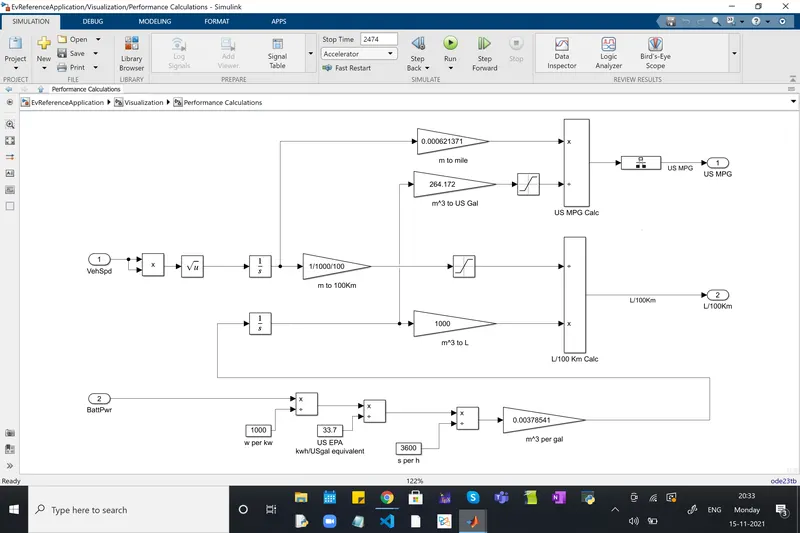
A factor of 33.7 is used to obtain the fuel-flow rate from the Battery Power which is in accordance with the US EPA standards. Of course, other factors are multiplied accordingly, to obtain the value in the required units.
3. Run the HEV ReferenceApplication with WOT drive cycle. Change the grade and wind velocity in the environment block. Comment on the results.
Presentation of simulation outputs:
The required simulations are conducted with HEV multimode reference application available in the Powertrain blockset. The 'driving sycle source' is set to WOT.
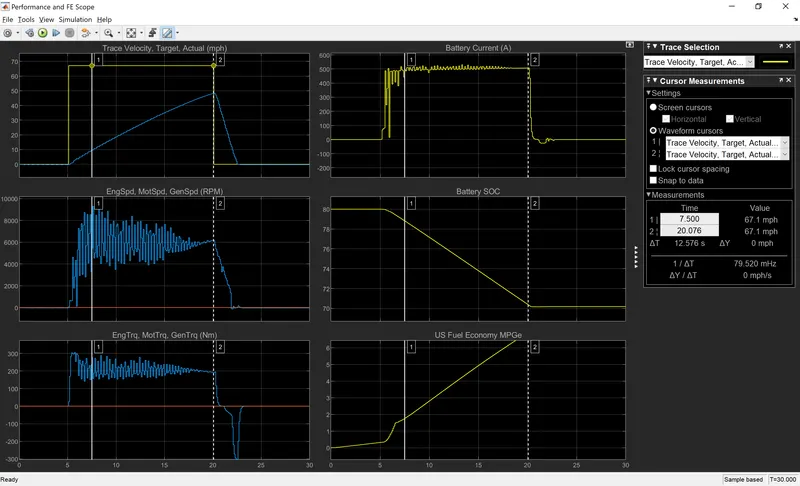
Fig. 1 show the simultion results for default settings while Fig. 3 and 4 show the simulation results for changes in grade and wind velocity respectively. Fig. 2 shows the environment block where the changes in the required parameters are made. The conclusions from these results follow these figures.
Fig. 1
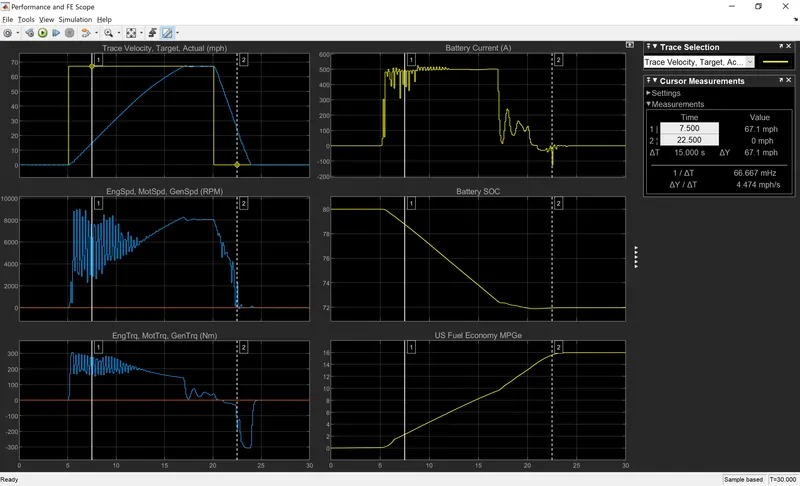
Fig.2
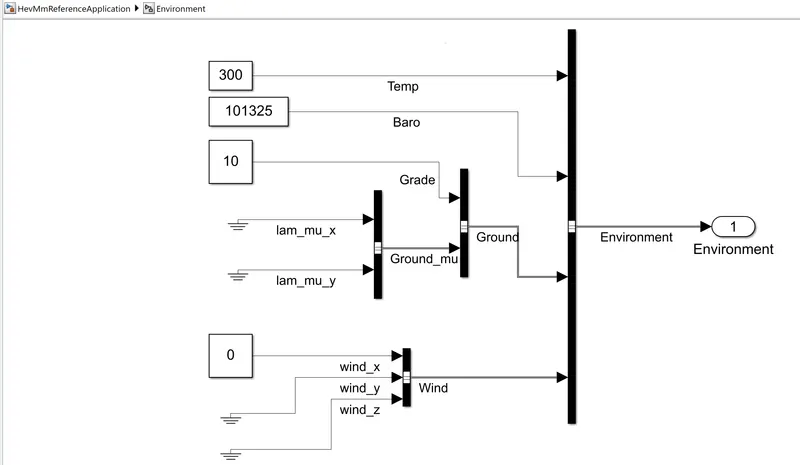
Fig. 3
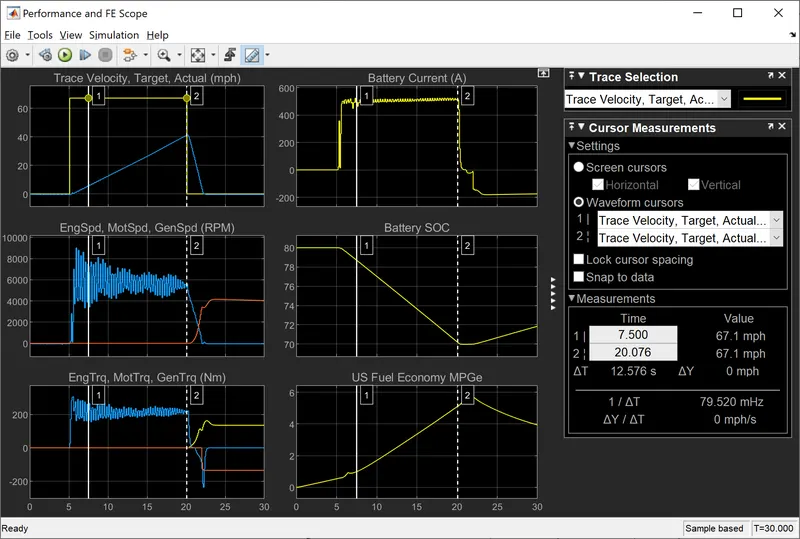
Fig. 4
Conclusions:
With default settings i.e. with both grade and wind velocity set to zero -
- The vehicle is unable to track the target speed successfully during the initial part of the driving cycle. However, It reaches the required speed of 30 m/s (~ 67mph) at around 16s and tracking is accomplished till 20s.
- It is seen that the Engine speed and torque remains zero throughout the cycle. So, the engine is not used even though it could have helped achieve better tracking till the maximum speed.
- The battery remains charged with an SOC or around 72% at the end of the cycle.
With grade set to 10 -
- The vehicle fails to track the target speed even here. Infact, the vehicle struggles even more to achieve tracking and does not even reach the target top-speed. This is due to the additional burden of the added 10% grade. This is also seen with the fact that the motor torque and velocity shows a general trend of higher values thourgh the cycle.
- Moreover, it is seen that, the battery is more depleted with 70% SOC at 20 seconds. Furthermore, the engine is initiated at this point to recharge the battery, which is also seen by negative current values. This suggests that the power mangement strategy is to use the engine to recharge the battery once it's depleted below around 70%.
With wind-speed set to 60 -
- A similar result to the previous case is seen i.e. wind-speed causes additional burden to achieve tracking and the vehicle fails to reach top-speed yet again. However, the engine is never used here, probably because the SOC doesn't fall below 70%.
4. Keeping all other parameters same, compare the simulated results of hybrid and pure electric powertrains.
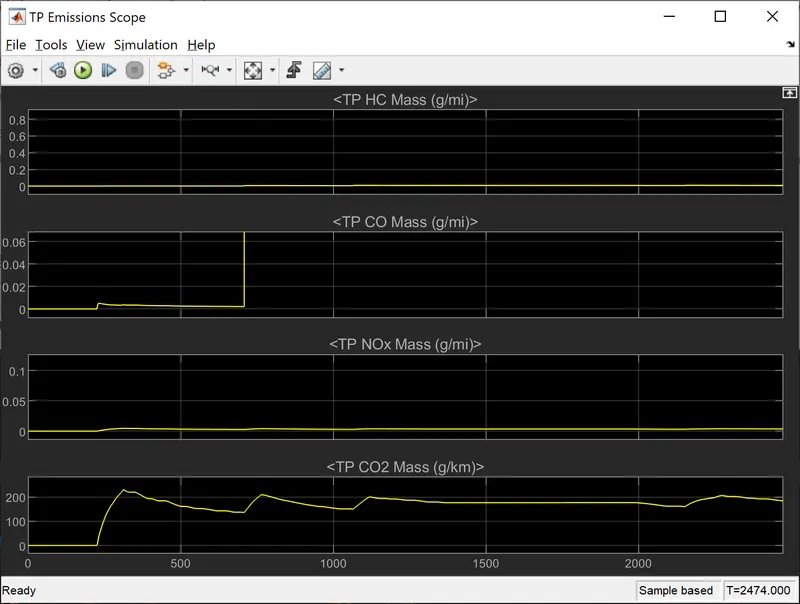
As required, a pure electric vehicle is simulated using the EV reference application model and a hybrid powertrain is simulated using the HEV multimode reference application model available in the powertrain blockset. Default settings are used for both simulations where the vehicle is tested over the FTP45 driving cycle. The EV results are shown in Fig. 1 while HEV results are shown in Fig.2 and 3 This is followed by the comparison analysis.
Fig. 1:
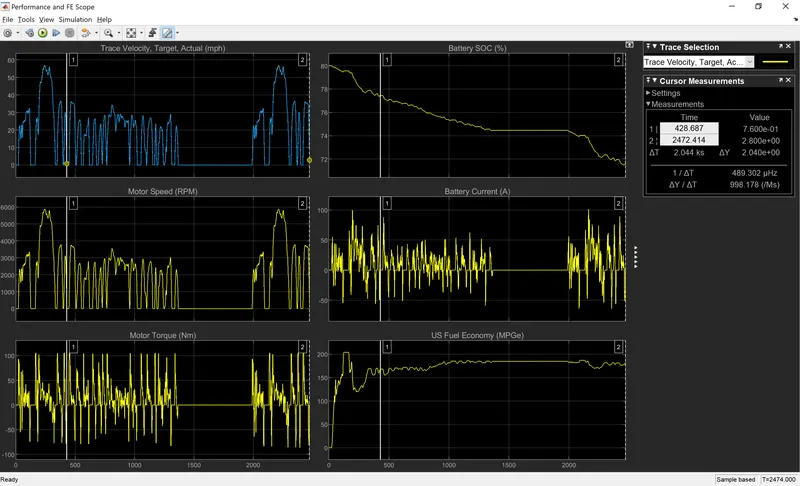
Fig. 2:
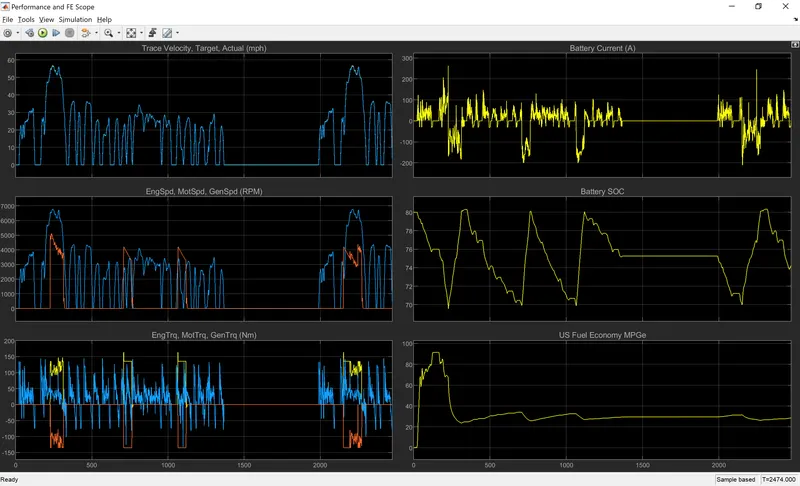
Fig. 3:
Comparison of the two simulations:
- The HEV simulation takes significantly more simulation time. This is because it includes the engine model that makes the whole system more complex.
- Both EV and HEV are able to track the target speed well.
- In HEV, when the battery SOC depletes to 70%, the engine is initiated to recharge the battery back untill 80%. This is evident from the non-zeros values of the engine speed and torque and positive generator torque in when the battery SOC is depleted till 70% until 80% is regained. This allows HEV to have more range than EV- at the end of the driving cycle, for HEV the SOC is below 70% while for EV it is around 74%.
- EV shows much better fuel efficiency at the end of the driving cycle i.e. over 100 MPG as compared to around 25 MPG of the HEV. This is of course because an engine is used in an HEV.
- HEV results in emissions as seen in Fig.3, while EV does not.
- Higher battery current is reached in EV.