Week - 4
1.
The required stateflow chart for the simulation of a washing machine is designed as shown below.
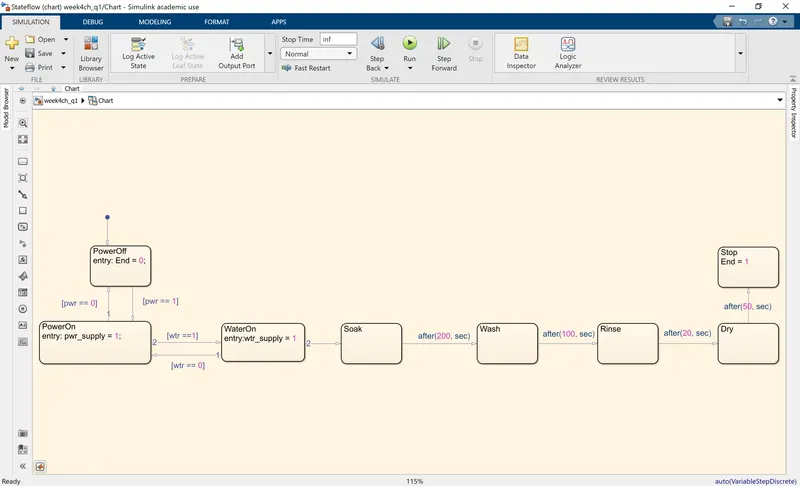
Description:
- The machine is activated i.e. gets into the "PowerOn" state when the power switch is turned ON.
- It then checks if the water-supply is ON and moves to the next state where an indication of this is sent out.
- It then moves on to the process of washing spending 200s, 100s, 20s and 50s in the Soak, Wash, Rinse and Dry states respectively.
- Finally, a Stop state is reached once the washing process is complete and an indication of this is sent out.
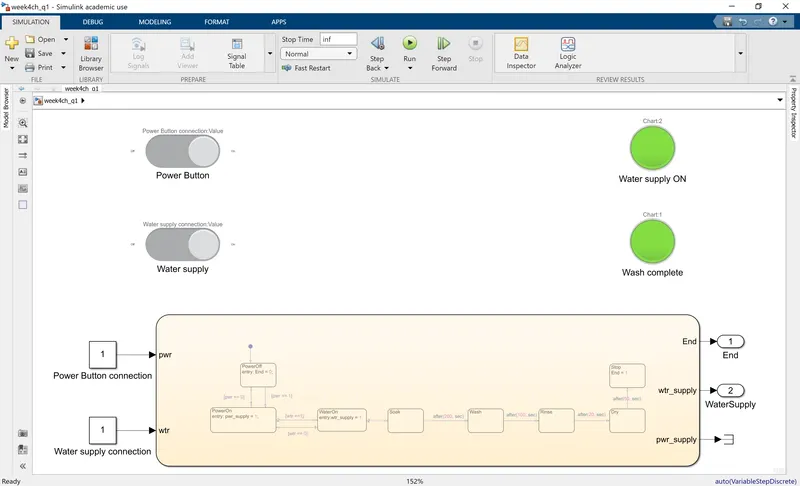
The full simulation of the washing machine system is made as shown below.
Inputs:
The Power and water supply signals are taken as inputs, each of which are connected to a button using constant blocks
Outputs:
The water supply signal and "washing complete" signal (End) are taken as outputs and are used to show the respective indications using LEDs/Lamp-blocks in simulink.
2.
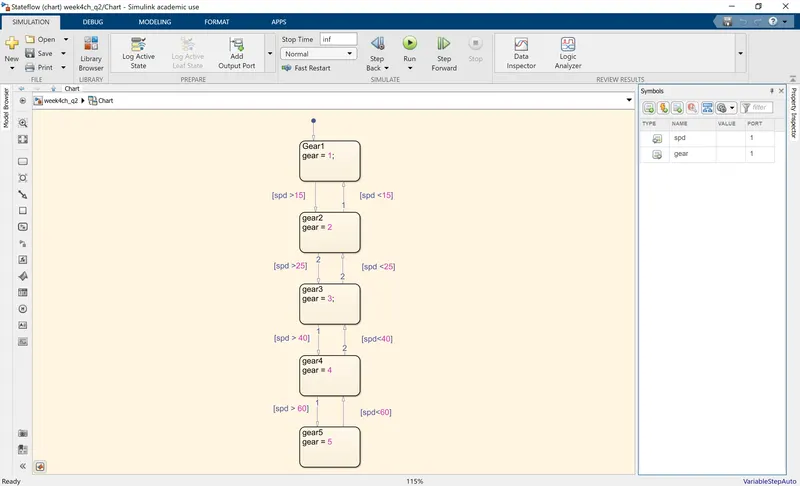
A state-flow chart required for simulation of a gear system is constructed as shown below. The design is made such that the there is upshifting when there is increase in speed and downshifting when there is a decrease. Each state is represents a gear-level.
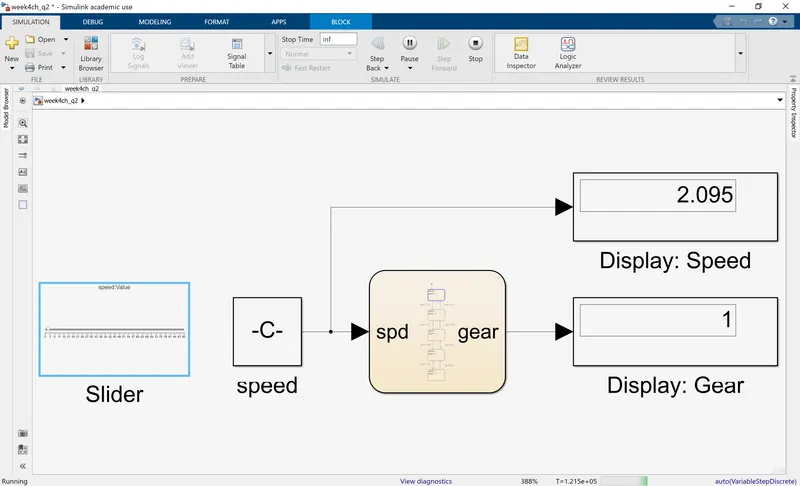
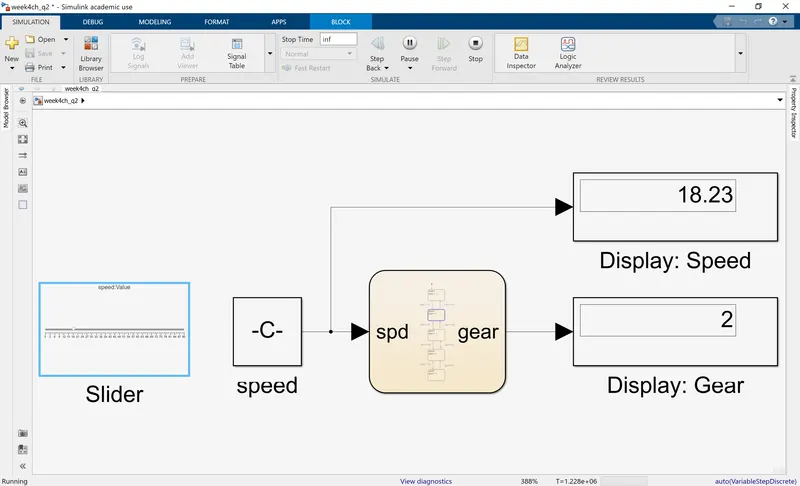
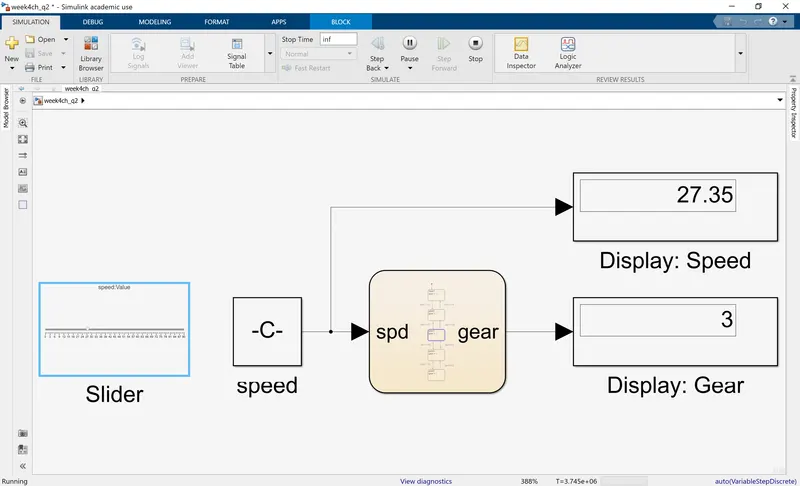
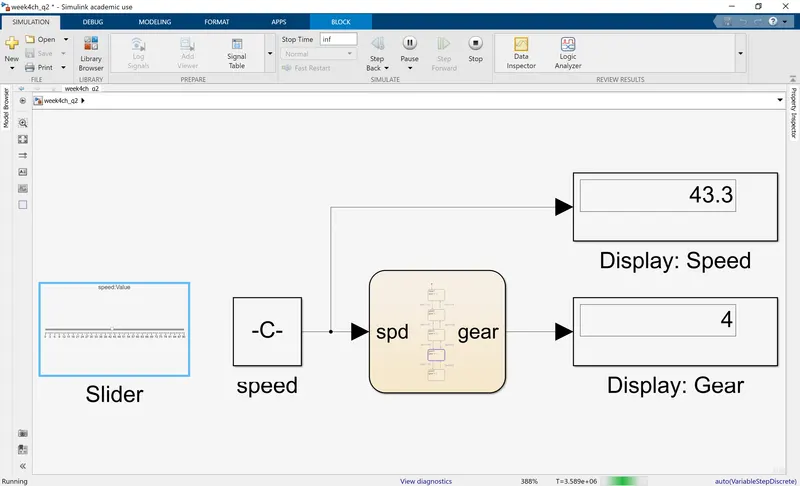
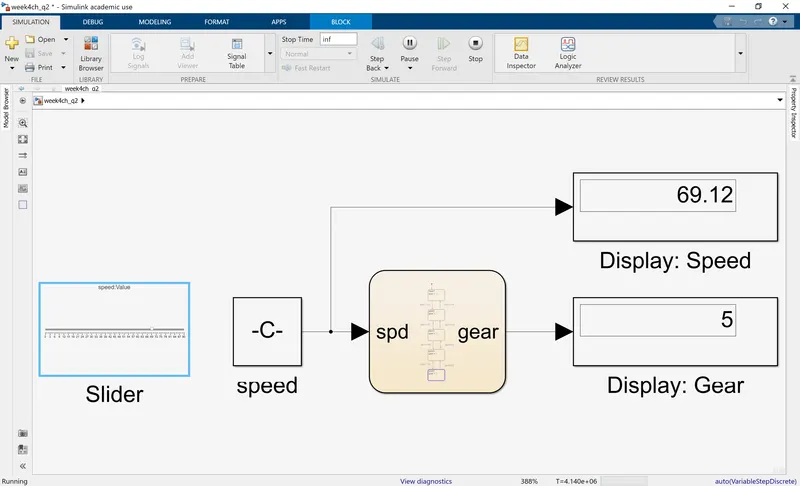
The full simulation of the gear system is constructed as shown below. Here, the speed value is given as input using the slider gain and resulting gear-level is taken as output. The result for speeds at each speed-range is shown in the following figures.